111 Stevefelkel Dr · Edisto, SC
Flood risk 1/10 · Minimal
- FEMA flood zone
- X (unshaded)
- Chance of flooding over 30 yrs
- 0.0%
- Est. flood insurance / yr
- $507 – $1,088
Fire risk 4/10 · Minor
- Est. fire insurance / yr
- $783 – $1,453
Heat risk 7/10 · Major
- Hot days now (above 107°F)
- 7 days/yr
- Hot days in 30 yrs
- 17 days/yr
Wind risk 8/10 · Major
- Chance of severe wind over 30 yrs
- 80.0%
Air-quality risk 3/10 · Minor
- Unhealthy air days now
- 3 days/yr
- Unhealthy air days in 30 yrs
- 3 days/yr
Risk factors via First Street. Map © Google.
Why this score? — see what drove the B grade
The composite is a weighted blend of 9 inputs, each scored 0–100. Each bar is that input's sub-score; the figure is the points it added to the 100-point composite (weight × sub-score).
- Cash flow +30.0/30.0
- 1% rule +10.0/10.0
- DSCR +10.0/10.0
- ARV discount +7.5/15.0
- Schools +5.0/10.0
- Livability +2.9/5.0
- Rent growth +2.5/5.0
- Condition / age +2.5/5.0
- Appreciation +0.0/10.0
$30,000
🖨 Deal sheet 📄 Offer letter ✓ Due diligence
Listing remarks
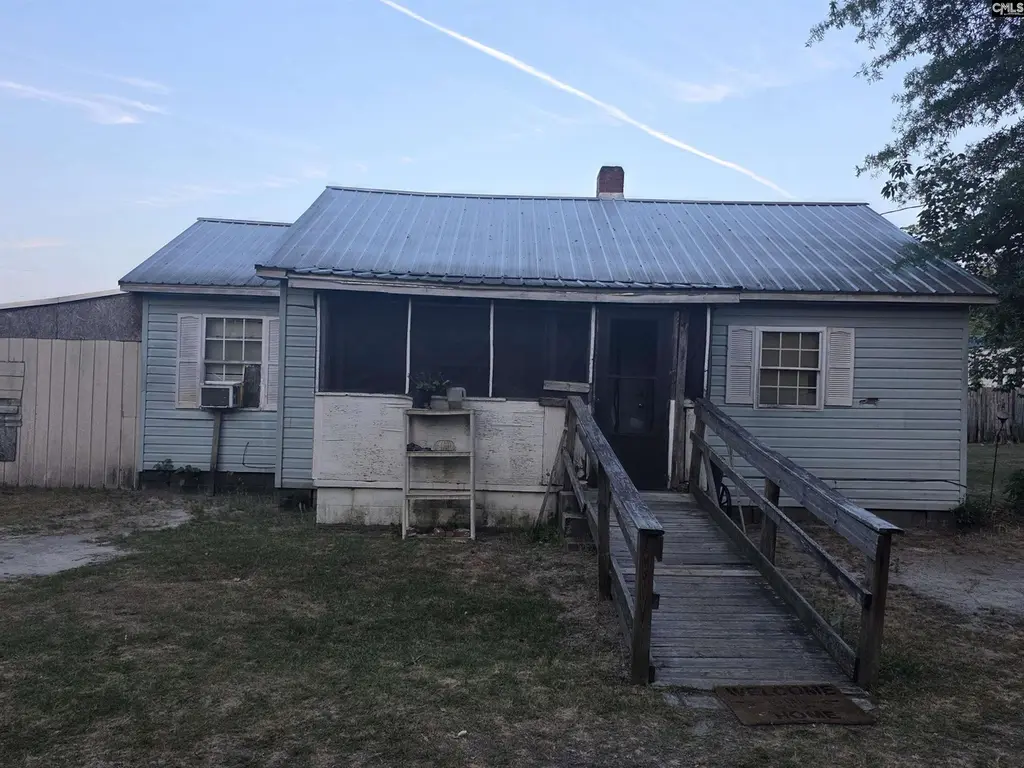
Investor special located in Orangeburg! This 3-bedroom, 1-bath home offers a great opportunity for those looking to renovate and add value. Property requires extensive repairs and is being sold AS-IS, WHERE-IS. TENANTS IN PLACE – DO NOT DISTURB. No showings will be permitted until a ratified contract is in place. Ideal for investors, flippers, or buyers looking for a project. Conveniently located with easy access to local amenities and major roadways. Disclaimer: CMLS has not reviewed and, therefore, does not endorse vendors who may appear in listings.
Key facts
- 9,583 sq ft lot
- Built 1965
- Listed 48 days
Property features AI
Exterior
- Utilities: Public water; Septic with public available
- Home design: Single-story home
- Construction: Crawlspace foundation
- Exterior features: Wood and other exterior finish; Paved road frontage; 0.22-acre lot
Interior
- Bedrooms: Master bedroom on the main level; Second bedroom on the main level
- Bathrooms: One full bathroom
- Heating & cooling: Heated area of 919
- Interior features: Main-level living
Neighborhood map
What this means for you Summary
Snapshot
- This is a 3-bed/1.0-bath single-family listed at $30k.
Deal economics
- At list price, monthly cash flow is $685 ($8k/yr) — positive.
- The deal already cash-flows at list — no discount required.
- Meets the 1% rule at list price ($1k rent vs $30k).
- Recommended offer: $29k (3.0% below list) — sets the bar for market timing.
Location & tenants
- Location reads 57/100 on livability (#270 in SC) — a working-class tenant base; expect higher turnover. Strengths: cost of living A+, crime B+; Watch: schools C-, amenities F, commute F.
- Market conditions: 226 active listings in the ZIP; 87 units permitted in Orangeburg County in 2024 (0 in 5+ unit buildings).
Forward outlook
- Local home prices are declining (-3.0%/yr); year-one equity from $207 of loan paydown is wiped out by about $900 of value loss. Plan a longer hold.
- Orangeburg County population projected at -27% by 2050 — secular population decline; favor cash flow + early exit over multi-decade hold.
- At projected returns (-3.0% appreciation + 3.0% rent growth), your $8k cash investment doubles in ~2 years — after that, you're playing with house money.
Negotiation context
- It's been on market 49 days — a 3% lower offer ($29k) is reasonable based on typical stale-listing flexibility.
- 2 sale attempts with the ask held roughly flat each time — persistent listings suggest the price (not the market) is what's stuck; bring a comps-based counter.
Risks & watch-outs
- Climate carrying-cost: severe wind risk, 80% chance of damaging wind over 30y; extreme-heat days projected 7→17/yr by 2055 (HVAC capex compounding) — expect insurance premiums to compound above CPI over the hold.
Questions for the listing agent
- It's been on market 49 days. Have you received any prior offers? Is the seller open to a 3% concession, seller financing, or rate buy-down credit?
- Built in 1965 — when were the roof, HVAC, electrical panel, plumbing, and water heater last replaced?
- Is there a deadline driving the sale (1031 exchange, divorce, estate, relocation)? That informs how much negotiation room exists.
- What's the average days-on-market for RENTAL listings here right now (not sales)? A rising rental-DOM trend means longer vacancies and softer asking-rent achievability than the comps imply.
- What's the recent tenant-quality profile in this submarket — average credit score on applications, eviction rate, late-payment / NSF rate, and stable-employment percentage? A property-management company in the area should have these aggregated.
- How much new for-sale + rental construction is in the pipeline within 1–3 miles? Heavy new supply typically softens prices + rents 12–24 months out; constrained supply supports both.
Investment metrics
- 1% rule
- 3.84% ✓
- Cap rate
- 33.71%
- Cash-on-cash
- 97.91%
- DSCR
- 5.36
- GRM
- 2.2
CMA / ARV
- ARV (on-the-fly)
- $108,032
- Comps found
- 1
Show comp detail 1 sale within ~0.75 mi
| Address | Dist | Beds/Ba | Sqft | Sold | Price | $/sf | Match |
|---|---|---|---|---|---|---|---|
| 452 Cimmaron St | 0.41mi | 3/1.0 | 900 (+7%) | 20mo | $115,000 | $128 | 53 |
Match score weights: distance 35% · size 25% · config 20% · recency 20%. Top-matched comps best support the ARV.
Projected returns pro-forma
-3.0% appreciation · 3.0% rent growth · sell at horizon
- IRR
- 98.9%
- Equity multiple
- 5.62×
- Total profit
- $38,819
- Equity at exit
- $4,473
- IRR
- —
- Equity multiple
- 11.73×
- Total profit
- $90,127
- Equity at exit
- $2,594
Cash invested: $8,400 (down + closing). Projections, not guarantees.
Landlord ↔ Tenant lean methodology
- Overall (STATE)
- 90 Strongly Landlord-Friendly
- State South Carolina
- 90 Strongly Landlord-Friendly · R+6
- County
- — inherits STATE
- City
- — inherits STATE
ZIP-level market 29115
- Home prices YoY
- -27.3%
- Active inventory
- 226
- Price-to-rent
- 2.2×
Monthly cashflow live
- Estimated rent
- $1,153 medium interval (Pro) →
- Mortgage (P&I)
- −$157
- Tax from tax record
- −$56 /mo · $666/yr
- Insurance
- −$12
- HOA
- −$0
- Vacancy / Maint / Mgmt
- −$242
- Net cashflow
- $685
Break-even live
UW: 25.0% down · 7.5% · 30yr · 1.5% tax · 5.0% vac · 8.0% maint · 8.0% mgmt
Financing live
Cash to close
- Down payment
- $7,500
- Closing costs
- $900
- Reserves months
- —
- Total cash needed
- —
Loan-product check · same deal, 3 products live
Conventional
25% down · 7.5% · 30yr
- Down + closing
- —
- Monthly P&I
- —
- Monthly cashflow
- —
- DSCR
- —
- Eligible?
- —
Personal DTI + credit; lowest rate.
DSCR
20% down · 8.5% · 30yr
- Down + closing
- —
- Monthly P&I
- —
- Monthly cashflow
- —
- DSCR
- —
- Eligible?
- —
No personal income docs; deal must DSCR.
Hard money
10% down · 12.0% · 12mo
- Down + closing
- —
- Monthly P&I
- —
- Monthly cashflow
- —
- DSCR
- —
- Eligible?
- —
Short-term bridge; refi at stabilization.
Listing history 20 events
-
2026-06-19days on market $30,000 Active 49 DOM
-
2026-06-18days on market $30,000 Active 48 DOM
-
2026-06-17days on market $30,000 Active 47 DOM
-
2026-06-16days on market $30,000 Active 46 DOM
-
2026-06-15days on market $30,000 Active 45 DOM
-
2026-06-14days on market $30,000 Active 43 DOM
-
2026-06-12days on market $30,000 Active 42 DOM
-
2026-06-09days on market $30,000 Active 39 DOM
-
2026-06-08days on market $30,000 Active 38 DOM
-
2026-06-07days on market $30,000 Active 37 DOM
-
2026-06-07days on market $30,000 Active 36 DOM
-
2026-06-04days on market $30,000 Active 33 DOM
-
2026-06-02days on market $30,000 Active 32 DOM
-
2026-06-01days on market $30,000 Active 31 DOM
-
2026-05-31days on market $30,000 Active 30 DOM
-
2026-05-31days on market $30,000 Active 29 DOM
-
2026-04-30$30,000 Active
-
2026-02-17$25,000 Active
-
2001-10-24soldstatus $40,000
-
1989-08-01soldstatus $13,500
ⓘ Source: listings_history table (triggers on properties + properties_extension) + one-shot
backfill from property_details.listing_events for pre-trigger history.
Tax reassessment forecast SC · Resets to sale price
- Current annual tax
- $666 · $56/mo
- Projected year-2 tax
- $666 · $56/mo
- Expected delta
- $0/yr ($0/mo · 0.0%)
ⓘ Screening estimate from a state-policy table — verify with the county assessor before closing.
Climate risk First Street
- Flood 1/10 Low FEMA zone X (unshaded) · 0% chance over 30 yrs
- Wildfire 4/10 Moderate
- Heat 7/10 Severe 7 d/yr ≥107°F today · 17 d/yr by 30 yrs out
- Wind 8/10 Severe 80% chance of damaging wind over 30 yrs
- Air quality 3/10 Moderate 3 unhealthy d/yr today · 3 by 30 yrs out
Nearby sold comps map
Loading sold comps map…
Walkable amenities ~0.75 mi
Loading nearby amenities…
Taxation est. · year 1
- Rental income
- $13,834
- − Mortgage interest
- −$1,680
- − Property taxes
- −$666
- − Insurance
- −$150
- − Repairs & maintenance
- −$1,107
- − Management
- −$1,107
- − Depreciation
- −$873
- Taxable income
- $8,251
- Est. tax owed @ 24.0%
- −$1,980
- After-tax cash flow
- $6,244/yr
For passive investors: Depreciation is non-cash, so a rental often shows a tax loss while cash-flowing — sheltering income. Rental losses are passive: they offset passive income freely, and up to $25,000/yr can offset ordinary (W-2) income if you actively participate and your MAGI is under $100k (phasing out to $0 by $150k); unused losses carry forward. On sale, claimed depreciation is recaptured at up to 25%, and gains may owe capital-gains tax (a 1031 exchange can defer both). Figures are a year-1 estimate at your 24.0% rate — not tax advice; consult a CPA.
Schools (NCES district)
No district data.
Livability — Edisto
- Score
- 57/100
- State rank
- #270
- US rank
- #21693
Category grades
Schools grade is shown separately in the Schools card above.
Census & demographics
- Census place
- Edisto, SC
- City population
- 15,135
- Population (ZIP)
- 27,179
Population outlook (Orangeburg County) Hauer SSP2
- Today (2025)
- 82,698 people
- By 2030
- 78,615 · -4.9%
- By 2040
- 69,308 · -16.2%
- By 2050
- 60,629 · -26.7%
- By 2075
- 42,678 · -48.4%
- By 2100
- 28,136 · -66.0%
Race, ethnicity, and origin ACS 2023
- Neighborhood character
- Predominantly Black (76%)
- Race & ethnicity
- Black 76% White 20% Hispanic / Latino 2% Two or more races 2%
- Foreign-born
- 2% · Canada
- Languages at home
- 97% English-only · Spanish 2%
Political lean MEDSL · Orangeburg
- 2024 margin
- Strong D (+24.6) · D 61.8% · R 37.2% · Other 1.1%
- 2008→2024 swing
- -13.5pp toward R · 2008: 38.1pp · 2024: 24.6pp
- All cycles
- 2024: D+24.6 2020: D+33.2 2016: D+37.0 2012: D+43.5 2008: D+38.1
Not yet ingested
- Civics
- —
Market trends
- HPI YoY
- ▼ -56.65%
- Current HPI
- 150.823
- Rent YoY
- —
- Metro
- —
- State GDP YoY
- ▲ 4.51%
- F500 in state
- 2
Industry mix (Fortune 500 HQ in SC)
| Industry | F500 HQs | Revenue |
|---|---|---|
| Packaging | 1 | $7B |
|
||
Price history
+122.2% since first listed4 events — show timeline
- 2026-04-30 Listed $30,000 Consolidated MLS
- 2026-02-17 Listed $25,000 Consolidated MLS
- 2001-10-24 Sold (Public Records) $40,000 Public Records
- 1989-08-01 Sold (Public Records) $13,500 Public Records
Property tax history
+0.2%/yrLatest (2024): $666 · +19.4% YoY. Source: county tax records.
Cash-flow waterfall
monthlySold comps — $/sqft
last 12 mo · ≤1 miLoading sold comps…