 🏷️ Likely Rental
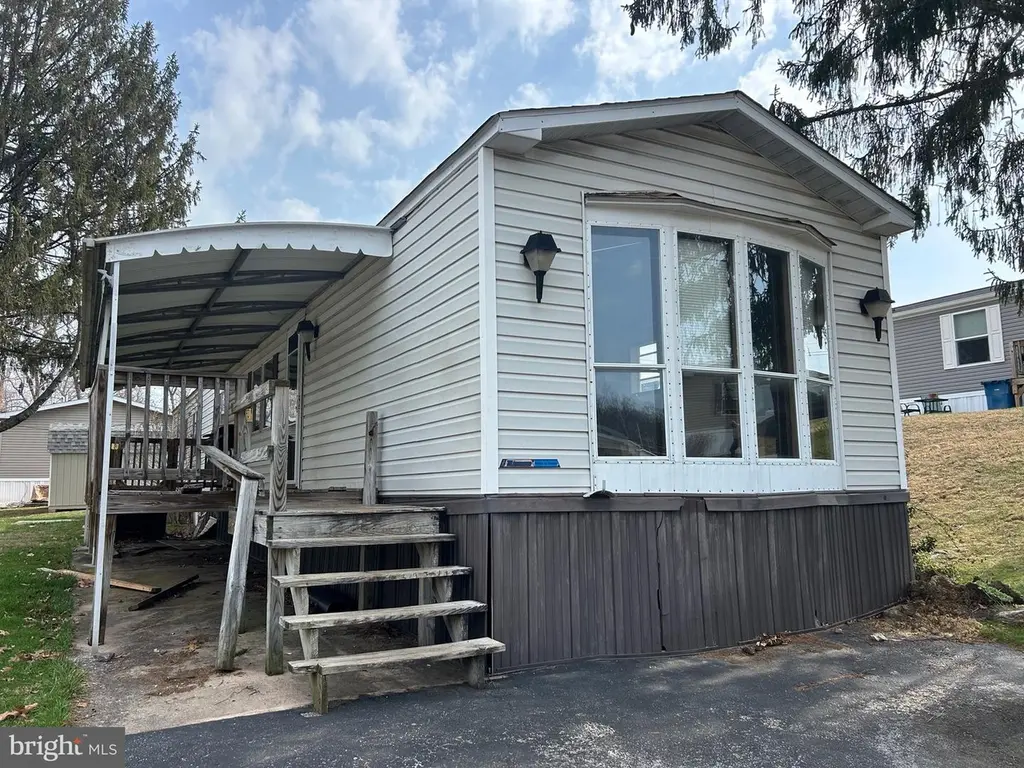
121 Chestnut Hill Dr · New Salem, PA
Flood risk 1/10 · Minimal
- FEMA flood zone
- X (unshaded)
- Chance of flooding over 30 yrs
- 0.0%
- Est. flood insurance / yr
- $507 – $1,088
Fire risk 1/10 · Minimal
- Est. fire insurance / yr
- $511 – $949
Heat risk 5/10 · Moderate
- Hot days now (above 102°F)
- 7 days/yr
- Hot days in 30 yrs
- 15 days/yr
Wind risk 4/10 · Minor
- Chance of severe wind over 30 yrs
- 12.0%
Air-quality risk 3/10 · Minor
- Unhealthy air days now
- 2 days/yr
- Unhealthy air days in 30 yrs
- 4 days/yr
Risk factors via First Street. Map © Google.
Why this score? — see what drove the D+ grade
The composite is a weighted blend of 9 inputs, each scored 0–100. Each bar is that input's sub-score; the figure is the points it added to the 100-point composite (weight × sub-score).
- Cash flow +15.0/30.0
- ARV discount +7.5/15.0
- 1% rule +5.0/10.0
- DSCR +5.0/10.0
- Schools +4.8/10.0
- Livability +3.3/5.0
- Rent growth +2.5/5.0
- Condition / age +2.5/5.0
- Appreciation +0.0/10.0
$10,000
🖨 Deal sheet (PDF) 📄 Offer letter ✓ Due diligence
Listing remarks MLS
HOME MUST BE MOVED BY BUYER – THIS HOME CANNOT REMAIN IN THE PARK. Great opportunity to own a well-maintained mobile home ready for relocation! This home features a spacious eat-in kitchen with plenty of room for dining, a large and inviting living room perfect for relaxing or entertaining, and a full bathroom equipped with convenient his-and-hers sinks. In addition, there is a versatile bonus room on the side that can be used as a family room, office, or flex space, complete with access to an extra deck for outdoor enjoyment. Ideal for buyers looking to place a home on their own land or in a new location—don’t miss this unique opportunity!
Key facts
- Full bathroom
- Bonus room
- Large living room
Tags
Neighborhood map
What this means for you Summary
Snapshot
- This is a 2-bed/1.5-bath manufactured listed at $10k.
Deal economics
- At list price, monthly cash flow is $1k ($13k/yr) — positive.
- The deal already cash-flows at list — no discount required.
- Meets the 1% rule at list price ($2k rent vs $10k).
- Recommended offer: $9k (6.0% below list) — sets the bar for market timing.
- Cap rate 138.2% vs local median 3.9% in New Salem — top-decile yield for the area; either an underpriced asset or a hidden risk that comps aren't pricing in. Stress-test before assuming the spread holds.
Location & tenants
- Location reads 66/100 on livability (#1,075 in PA) — a middle-class / working-renter tenant base. Strengths: employment A+, cost of living A+, housing A+; Watch: amenities F, commute F, health & safety F.
- Spring Grove Area SD (suburban): math 45% / reading 65% proficiency, ranked #98 of 539 in PA (top 18%) — acceptable for families but not a draw, mixed tenant base, ~2y average lease.
- Zoned schools: New Salem El Sch (math 62% / reading 77%, grade A-, #151 of 1,518 statewide, top 12%, 414 students, 33% FRL); Spring Grove Area Intrmd Sch (math 44% / reading 65%, grade B-, #76 of 512 statewide, top 16%, 651 students, 38% FRL); Spring Grove Area Hs (math 71%, 1,166 students, 32% FRL).
- Market conditions: 147 active listings in the ZIP; 3 comparable units currently listed for rent nearby; rentals at typical pace (median 15d on market — plan ~3-4 weeks tenant-placement turnaround); solid renter incomes; 1,328 units permitted in York County in 2024 (338 in 5+ unit buildings).
Forward outlook
- Local home prices are declining (-3.0%/yr); year-one equity from $69 of loan paydown is wiped out by about $300 of value loss. Plan a longer hold.
- At projected returns (-3.0% appreciation + 3.0% rent growth), your $3k cash investment doubles in ~1 year — after that, you're playing with house money.
Negotiation context
- It's been on market 78 days — a 6% lower offer ($9k) is reasonable based on typical stale-listing flexibility.
- 3 sale attempts since 24y ago; this cycle's ask has dropped $10k (50%) from the opening price — seller is motivated, your offer sets the floor, not the list.
Risks & watch-outs
- Watch-outs: property tax is 3.7% of price.
- Climate carrying-cost: extreme-heat days projected 7→15/yr by 2055 (HVAC capex compounding) — expect insurance premiums to compound above CPI over the hold.
Questions for the listing agent
- It's been on market 78 days. Have you received any prior offers? Is the seller open to a 6% concession, seller financing, or rate buy-down credit?
- Property tax is high relative to price — has the assessment been appealed recently, and will the sale trigger a re-assessment?
- Why hasn't it sold? Are there any deal-killer items the seller is aware of (foundation, flood, title, zoning, code violations)?
- Is there a deadline driving the sale (1031 exchange, divorce, estate, relocation)? That informs how much negotiation room exists.
- Schools are F-rated, which usually means shorter tenancies and higher turnover. Who's the typical renter profile here, and what's been the actual vacancy rate?
- The area grade is low — what's the realistic commute time and amenity access for the typical tenant pool here? Any planned neighborhood developments (good or bad) we should know about?
- What's the average days-on-market for RENTAL listings here right now (not sales)? A rising rental-DOM trend means longer vacancies and softer asking-rent achievability than the comps imply.
- What's the recent tenant-quality profile in this submarket — average credit score on applications, eviction rate, late-payment / NSF rate, and stable-employment percentage? A property-management company in the area should have these aggregated.
- How much new for-sale + rental construction is in the pipeline within 1–3 miles? Heavy new supply typically softens prices + rents 12–24 months out; constrained supply supports both.
Investment metrics
- 1% rule
- 15.01% ✓
- Cap rate
- 138.15%
- Cash-on-cash
- 470.93%
- DSCR
- 21.95
- GRM
- 0.6
CMA / ARV
- ARV (median comp)
- $105,262
- List price
- $10,000
- Delta
- -90.50%
- Verdict
- UNDERPRICED
- Comps
- 20 within 1.0 mi
Projected returns pro-forma
-3.0% appreciation · 3.0% rent growth · sell at horizon
- IRR
- —
- Equity multiple
- 25.43×
- Total profit
- $68,399
- Equity at exit
- $1,491
- IRR
- —
- Equity multiple
- 54.51×
- Total profit
- $149,815
- Equity at exit
- $865
Cash invested: $2,800 (down + closing). Projections, not guarantees.
Landlord ↔ Tenant lean methodology
- Overall (STATE)
- 62 Landlord-Friendly
- State Pennsylvania
- 62 Landlord-Friendly · EVEN
- County
- — inherits STATE
- City
- — inherits STATE
ZIP-level market 17408
- Home prices YoY
- -26.6%
- Active inventory
- 147
- Price-to-rent
- 0.6×
Monthly cashflow live
- Estimated rent
- $1,501 medium interval (Pro) →
- Mortgage (P&I)
- −$52
- Tax from tax record
- −$31 /mo · $367/yr
- Insurance
- −$4
- HOA
- −$0
- Vacancy / Maint / Mgmt
- −$315
- Net cashflow
- $1,099
Break-even live
Sensitivity live
| Price | -10% $1,104 | -5% $1,102 | +0% $1,099 | +5% $1,096 | +10% $1,093 |
|---|---|---|---|---|---|
| Rent | -10% $980 | -5% $1,040 | +0% $1,099 | +5% $1,158 | +10% $1,217 |
| Rate | -1.0pp $1,104 | -0.5pp $1,101 | base $1,099 | +0.5pp $1,096 | +1.0pp $1,094 |
UW: 25.0% down · 7.5% · 30yr · 1.5% tax · 5.0% vac · 8.0% maint · 8.0% mgmt
Financing live
Cash to close
- Down payment
- $2,500
- Closing costs
- $300
- Reserves months
- —
- Total cash needed
- —
Loan-product check · same deal, 3 products live
Conventional
25% down · 7.5% · 30yr
- Down + closing
- —
- Monthly P&I
- —
- Monthly cashflow
- —
- DSCR
- —
- Eligible?
- —
Personal DTI + credit; lowest rate.
DSCR
20% down · 8.5% · 30yr
- Down + closing
- —
- Monthly P&I
- —
- Monthly cashflow
- —
- DSCR
- —
- Eligible?
- —
No personal income docs; deal must DSCR.
Hard money
10% down · 12.0% · 12mo
- Down + closing
- —
- Monthly P&I
- —
- Monthly cashflow
- —
- DSCR
- —
- Eligible?
- —
Short-term bridge; refi at stabilization.
Rent comps 3 comps
| Address | Beds | Baths | Sqft | Rent | $/sqft | DOM | Units | Dist |
|---|---|---|---|---|---|---|---|---|
| 3906 Tunnel Hill Rd York, PA | 2.0 | 1.0 | 1100 | $1,595 | $1.45 | 15d | 15 | 0.55mi |
| 3533 Messersmith Rd Seven Valleys, PA | 1.0–2.0 | 1.0 | 725 | $1,295 | $1.79 | 15d | 1 | 0.58mi |
| 1480 Seven Valleys Rd Unit 3 York, PA | 2.0 | 1.0 | 850 | $1,399 | $1.65 | 45d | 1 | 0.64mi |
Listing history 23 events
-
2026-06-22days on market $10,000 Active 78 DOM
-
2026-06-18days on market $10,000 Active 75 DOM
-
2026-06-17days on market $10,000 Active 74 DOM
-
2026-06-16days on market $10,000 Active 73 DOM
-
2026-06-15days on market $10,000 Active 72 DOM
-
2026-06-14days on market $10,000 Active 70 DOM
-
2026-06-13days on market $10,000 Active 69 DOM
-
2026-06-10days on market $10,000 Active 67 DOM
-
2026-06-09days on market $10,000 Active 66 DOM
-
2026-06-08days on market $10,000 Active 65 DOM
-
2026-06-07days on market $10,000 Active 64 DOM
-
2026-06-05days on market $10,000 Active 61 DOM
-
2026-06-03days on market $10,000 Active 60 DOM
-
2026-06-02days on market $10,000 Active 59 DOM
-
2026-06-01days on market $10,000 Active 58 DOM
-
2026-05-31days on market $10,000 Active 57 DOM
-
2026-05-30days on market $10,000 Active 56 DOM
-
2026-05-19price $10,000 666-char remark
Show marketing remark (666 chars)
HOME MUST BE MOVED BY BUYER – THIS HOME CANNOT REMAIN IN THE PARK. Great opportunity to own a well-maintained mobile home ready for relocation! This home features a spacious eat-in kitchen with plenty of room for dining, a large and inviting living room perfect for relaxing or entertaining, and a full bathroom equipped with convenient his-and-hers sinks. In addition, there is a versatile bonus room on the side that can be used as a family room, office, or flex space, complete with access to an extra deck for outdoor enjoyment. Ideal for buyers looking to place a home on their own land or in a new location—don’t miss this unique opportunity!
-
2026-04-04$20,000 Active 666-char remark
Show marketing remark (666 chars)
HOME MUST BE MOVED BY BUYER – THIS HOME CANNOT REMAIN IN THE PARK. Great opportunity to own a well-maintained mobile home ready for relocation! This home features a spacious eat-in kitchen with plenty of room for dining, a large and inviting living room perfect for relaxing or entertaining, and a full bathroom equipped with convenient his-and-hers sinks. In addition, there is a versatile bonus room on the side that can be used as a family room, office, or flex space, complete with access to an extra deck for outdoor enjoyment. Ideal for buyers looking to place a home on their own land or in a new location—don’t miss this unique opportunity!
-
2018-09-28historical
-
2017-07-15$85,900
-
2003-06-05historical
-
2002-12-05$20,000
ⓘ Source: listings_history table (triggers on properties + properties_extension) + one-shot
backfill from property_details.listing_events for pre-trigger history.
Tax reassessment forecast PA · Partial reset (capped growth)
- Current annual tax
- $367 · $31/mo
- Projected year-2 tax
- $367 · $31/mo
- Expected delta
- $0/yr ($0/mo · 0.0%)
ⓘ Screening estimate from a state-policy table — verify with the county assessor before closing.
Climate risk First Street
- Flood 1/10 Low FEMA zone X (unshaded) · 0% chance over 30 yrs
- Wildfire 1/10 Low
- Heat 5/10 Major 7 d/yr ≥102°F today · 15 d/yr by 30 yrs out
- Wind 4/10 Moderate 12% chance of damaging wind over 30 yrs
- Air quality 3/10 Moderate 2 unhealthy d/yr today · 4 by 30 yrs out
Nearby sold comps map
Loading sold comps map…
Walkable amenities ~0.75 mi
Loading nearby amenities…
Taxation est. · year 1
- Rental income
- $18,016
- − Mortgage interest
- −$560
- − Property taxes
- −$367
- − Insurance
- −$50
- − Repairs & maintenance
- −$1,441
- − Management
- −$1,441
- − Depreciation
- −$291
- Taxable income
- $13,865
- Est. tax owed @ 24.0%
- −$3,328
- After-tax cash flow
- $9,858/yr
For passive investors: Depreciation is non-cash, so a rental often shows a tax loss while cash-flowing — sheltering income. Rental losses are passive: they offset passive income freely, and up to $25,000/yr can offset ordinary (W-2) income if you actively participate and your MAGI is under $100k (phasing out to $0 by $150k); unused losses carry forward. On sale, claimed depreciation is recaptured at up to 25%, and gains may owe capital-gains tax (a 1031 exchange can defer both). Figures are a year-1 estimate at your 24.0% rate — not tax advice; consult a CPA.
Schools (NCES district)
- District
- Spring Grove Area SD
- NCES district ID
- 4222590
- Math proficiency
- 45% ▼ -14.00%
- Reading proficiency
- 65% ▼ -9.00%
- Median HH income
- $64,950
- Composite
- 48.28/100
- National rank
- #2155
- State rank
- #98 of 539 in PA
Livability — New Salem
- Score
- 66/100
- State rank
- #1075
- US rank
- #12137
Category grades
Schools grade is shown separately in the Schools card above.
Census & demographics
- County
- York County · 278,806 people
- Metro
- York-Hanover, PA
- Population (ZIP)
- 25,431
- Household income
- $94,565
- Rent vs Own
- Severe rent burden
- 435.0
Population outlook (York County) Hauer SSP2
- Today (2025)
- 454,205 people
- By 2030
- 457,407 · +0.7%
- By 2040
- 457,529 · +0.7%
- By 2050
- 448,261 · -1.3%
- By 2075
- 427,388 · -5.9%
- By 2100
- 384,218 · -15.4%
Race, ethnicity, and origin ACS 2023
- Neighborhood character
- Predominantly White (78%)
- Race & ethnicity
- White 78% Hispanic / Latino 8% Two or more races 6% Black 5% Asian 4%
- Hispanic origin (detail)
- Mexican 1% Puerto Rican 6%
- Common ancestry
- Romanian 2% Slovak 2% Italian 1%
- Foreign-born
- 5% · Canada, Vietnam
- Languages at home
- 89% English-only · Spanish 6% Other Indo-European 2% Vietnamese 1%
Political lean MEDSL · York
- 2024 margin
- Strong R (+25.3) · D 36.9% · R 62.1%
- 2008→2024 swing
- -11.7pp toward R · 2008: -13.6pp · 2024: -25.3pp
- All cycles
- 2024: R+25.3 2020: R+24.6 2016: R+29.3 2012: R+21.2 2008: R+13.6
Not yet ingested
- Civics
- —
Market trends
- HPI YoY
- ▼ -86.74%
- Current HPI
- 239.5179
- Rent YoY
- —
- Metro
- York-Hanover, PA
- State GDP YoY
- ▲ 1.68%
- F500 in state
- 34
Industry mix (Fortune 500 HQ in PA)
| Industry | F500 HQs | Revenue |
|---|---|---|
| Healthcare | 2 | $309B |
|
||
| Insurance | 2 | $27B |
|
||
| Telecommunications / Media | 1 | $124B |
|
||
| Industrial Distribution | 1 | $22B |
|
||
| Financial Services | 1 | $20B |
|
||
| Chemicals / Materials | 1 | $18B |
|
||
Price history
-50.0% since first listed6 events — show timeline
- 2026-05-19 Price Changed $10,000 BRIGHT MLS
- 2026-04-04 Listed $20,000 BRIGHT MLS
- 2018-09-28 Listing Removed — BRIGHT MLS
- 2017-07-15 Listed $85,900 BRIGHT MLS
- 2003-06-05 Listing Removed — BRIGHT MLS
- 2002-12-05 Listed $20,000 BRIGHT MLS
Property tax history
+1.8%/yrLatest (2025): $367 · +1.1% YoY. Source: county tax records.
Cash-flow waterfall
monthlySold comps — $/sqft
last 12 mo · ≤1 miLoading sold comps…