 🏢 Co-op
43-33 46th St Unit A6 · New York, NY
Flood risk 1/10 · Minimal
- FEMA flood zone
- X (unshaded)
- Chance of flooding over 30 yrs
- 0.0%
- Est. flood insurance / yr
- $507 – $1,088
Fire risk 1/10 · Minimal
- Est. fire insurance / yr
- $691 – $1,283
Heat risk 6/10 · Moderate
- Hot days now (above 99°F)
- 7 days/yr
- Hot days in 30 yrs
- 15 days/yr
Wind risk 6/10 · Moderate
- Chance of severe wind over 30 yrs
- 27.0%
Air-quality risk 5/10 · Moderate
- Unhealthy air days now
- 6 days/yr
- Unhealthy air days in 30 yrs
- 8 days/yr
Risk factors via First Street. Map © Google.
Why this score? — see what drove the D+ grade
The composite is a weighted blend of 9 inputs, each scored 0–100. Each bar is that input's sub-score; the figure is the points it added to the 100-point composite (weight × sub-score).
- Cash flow +11.7/30.0
- ARV discount +7.5/15.0
- 1% rule +5.7/10.0
- Schools +5.0/10.0
- Rent growth +4.1/5.0
- Livability +3.8/5.0
- Condition / age +3.8/5.0
- Appreciation +3.6/10.0
- DSCR +3.5/10.0
$349,000
🖨 Deal sheet 📄 Offer letter ✓ Due diligence
Listing remarks
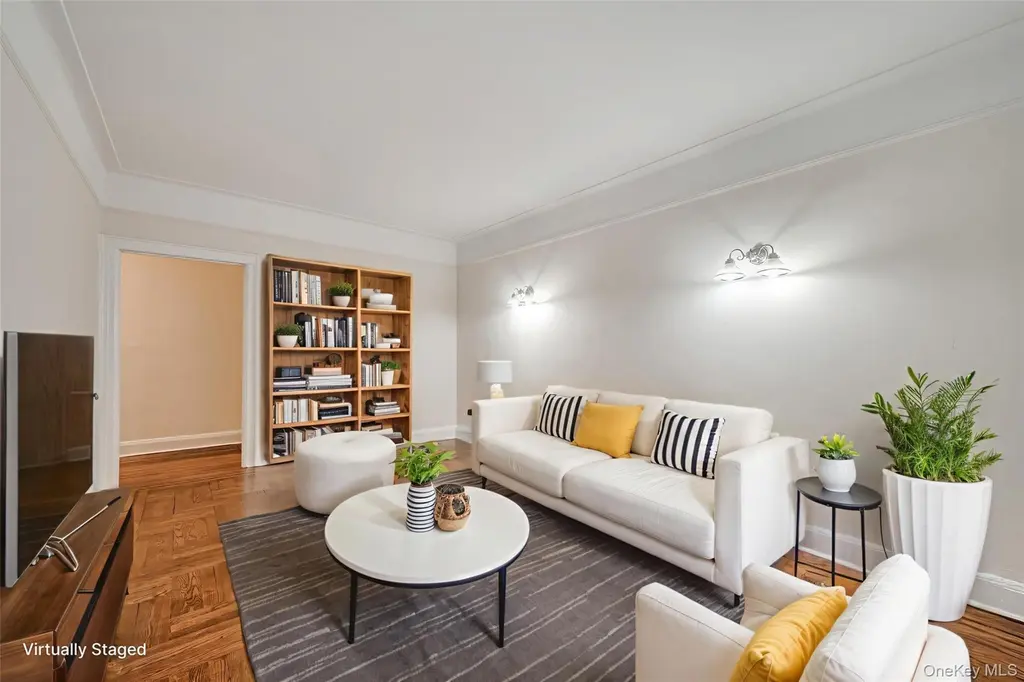
Sunnyside Pre-War Bungalow-Style One Bedroom Co-op! Sunnyside Pre-War Bungalow-Style One Bedroom Co-op! Enjoy your own private entrance and stoop. This spacious one bedroom features large rooms and hardwood floors throughout. Enjoy the amenities of living in a co-op building but the feel of living in your own home with west-facing views to 46th Street and a very quick trip to the #7 subway at 46th Street. There is an efficient galley kitchen and a full bathroom with bathtub. Maintenance: $790 / mo. 43-33 46th Street is a commuter's dream, less than a minute from the station with easy access to all the convenience for shopping and dining on Queens Blvd. Close proximity to #7 subway, Q32 and
Key facts
- West-facing views
- Private entrance
- Hardwood floors
Tags
Property features AI
Finance
- HOA & community: Association: 4312-4333 46th St Apts Corp.; Live-in superintendent
Exterior
- Parking: On-street parking
- Utilities: Con-Edison electric service; Public sewer; Cable available; Electricity available; Natural gas available; Sewer connected; Water connected
- Home design: Stock cooperative; One level; Entry at first level; Located in a 6-story building
- Construction: Brick construction
- Exterior features: Brick exterior; Not waterfront
Interior
- Kitchen: Gas range; Refrigerator
- Bedrooms: One bedroom on the first floor
- Flooring: Hardwood floors
- Bathrooms: One full bathroom
- Heating & cooling: Steam heating; Wall/window air conditioning unit(s)
- Interior features: First-floor bedroom; Galley-style kitchen; Three total rooms
Neighborhood map
What this means for you Summary
Snapshot
- This is a 1-bed/1.0-bath condo listed at $349k. Condition is rated good.
Deal economics
- At list price, monthly cash flow is $-99 ($-1k/yr) — negative.
- The deal already cash-flows at list — no discount required.
- Meets the 1% rule at list price ($4k rent vs $349k).
- Recommended offer: $328k (6.0% below list) — sets the bar for market timing.
- Cap rate 6.0% vs local median 2.6% in New York — top-decile yield for the area; either an underpriced asset or a hidden risk that comps aren't pricing in. Stress-test before assuming the spread holds.
Location & tenants
- Location reads 75/100 on livability (#268 in NY, #4,188 nationally) — a middle-class / working-renter tenant base. Strengths: amenities A+, commute A+, health & safety A; Watch: crime F, cost of living F.
- Market conditions: Rents rising fast (+6.3%/yr); 78 active listings in the ZIP; 3 comparable units currently listed for rent nearby; rentals leasing fast (median 8d on market — plan ~1-2 weeks tenant-placement turnaround); solid renter incomes; 5,302 units permitted in Queens County in 2024 (4,918 in 5+ unit buildings).
- At $3,720/mo this rent would consume 55% of the median local household income ($81k/yr) (locally 1859% of renters already pay >50% of income on rent) — very limited rent-growth headroom before tenants either downsize or default.
Forward outlook
- Local home prices are declining (-2.7%/yr); year-one equity from $2k of loan paydown is wiped out by about $9k of value loss. Plan a longer hold.
- Queens County population projected at +16% by 2050 — long-run rental-demand tailwind backs the buy-and-hold thesis.
Negotiation context
- It's been on market 70 days — a 6% lower offer ($328k) is reasonable based on typical stale-listing flexibility.
- 2 sale attempts with the ask held roughly flat each time — persistent listings suggest the price (not the market) is what's stuck; bring a comps-based counter.
Risks & watch-outs
- Watch-outs: built in 1936 — expect roof / HVAC / electrical / plumbing capex.
- Climate carrying-cost: major wind risk, 27% chance of damaging wind over 30y; extreme-heat days projected 7→15/yr by 2055 (HVAC capex compounding) — expect insurance premiums to compound above CPI over the hold.
Questions for the listing agent
- What do current leases actually rent for vs. the listed asking? Can we see a recent rent roll and the last 12 months of T-12 income?
- It's been on market 70 days. Have you received any prior offers? Is the seller open to a 6% concession, seller financing, or rate buy-down credit?
- Built in 1936 — when were the roof, HVAC, electrical panel, plumbing, and water heater last replaced?
- What does the HOA fee cover, when was the last increase, and are there any pending special assessments or reserve-fund shortfalls?
- Any open or pending special assessments — roof, HVAC, plumbing, elevator, façade? What's the per-unit balance and payoff schedule, and is the seller paying it off at close or rolling it to the buyer?
- Why hasn't it sold? Are there any deal-killer items the seller is aware of (foundation, flood, title, zoning, code violations)?
- Is there a deadline driving the sale (1031 exchange, divorce, estate, relocation)? That informs how much negotiation room exists.
- Schools are B-rated — typically a magnet for longer-tenancy family renters. What's the average tenant stay here, and is there a school-zone premium baked into asking?
- Crime grade is F in this area — have there been break-ins, vandalism, or insurance claims at this property in the last 3 years? What carrier currently insures it and at what premium?
- The area grade is low — what's the realistic commute time and amenity access for the typical tenant pool here? Any planned neighborhood developments (good or bad) we should know about?
- What's the average days-on-market for RENTAL listings here right now (not sales)? A rising rental-DOM trend means longer vacancies and softer asking-rent achievability than the comps imply.
- What's the recent tenant-quality profile in this submarket — average credit score on applications, eviction rate, late-payment / NSF rate, and stable-employment percentage? A property-management company in the area should have these aggregated.
- How much new apartment / multifamily construction is in the pipeline within 1–3 miles? Heavy new supply (>2% of stock underway) typically softens rents 12–24 months out; light construction supports rent growth.
Investment metrics
- 1% rule
- 1.07% ✓
- Cap rate
- 5.95%
- Cash-on-cash
- -1.22%
- DSCR
- 0.95
- GRM
- 7.8
CMA / ARV
No comps found within radius.
Projected returns pro-forma
-2.71% appreciation · 6.31% rent growth · sell at horizon
- IRR
- -12.0%
- Equity multiple
- 0.54×
- Total profit
- $-45,363
- Equity at exit
- $56,571
- IRR
- 1.7%
- Equity multiple
- 1.14×
- Total profit
- $14,050
- Equity at exit
- $38,020
Cash invested: $97,720 (down + closing). Projections, not guarantees.
Landlord ↔ Tenant lean methodology
- Overall (CITY)
- 0 Strongly Tenant-Friendly
- State New York
- 15 Strongly Tenant-Friendly · D+10
- County
- — inherits STATE
- City New York
- 0 Strongly Tenant-Friendly · D+34
ZIP-level market 11104
- Home prices YoY
- -1.2%
- Rents YoY
- 6.3%
- Active inventory
- 78
- Price-to-rent
- 7.8×
Monthly cashflow live
- Estimated rent
- $3,720 medium interval (Pro) →
- Mortgage (P&I)
- −$1,830
- Tax est. 1.5%
- −$436 /mo · $5,235/yr
- Insurance
- −$145
- HOA est. from 1 same-building comp
- −$626
- Vacancy / Maint / Mgmt
- −$781
- Net cashflow
- $-99
Break-even live
UW: 25.0% down · 7.5% · 30yr · 1.5% tax · 5.0% vac · 8.0% maint · 8.0% mgmt
Financing live
Cash to close
- Down payment
- $87,250
- Closing costs
- $10,470
- Reserves months
- —
- Total cash needed
- —
Loan-product check · same deal, 3 products live
Conventional
25% down · 7.5% · 30yr
- Down + closing
- —
- Monthly P&I
- —
- Monthly cashflow
- —
- DSCR
- —
- Eligible?
- —
Personal DTI + credit; lowest rate.
DSCR
20% down · 8.5% · 30yr
- Down + closing
- —
- Monthly P&I
- —
- Monthly cashflow
- —
- DSCR
- —
- Eligible?
- —
No personal income docs; deal must DSCR.
Hard money
10% down · 12.0% · 12mo
- Down + closing
- —
- Monthly P&I
- —
- Monthly cashflow
- —
- DSCR
- —
- Eligible?
- —
Short-term bridge; refi at stabilization.
Rent comps 3 comps
| Address | Beds | Baths | Sqft | Rent | $/sqft | DOM | Units | Dist |
|---|---|---|---|---|---|---|---|---|
| 34-35 44th St Astoria, NY | 1.0–2.0 | 1.0–2.0 | 613 | $3,576 | $5.83 | 1d | 26 | 0.73mi |
| 3705 30th St Long Island City, NY | 2.0 | 1.0–2.0 | 700 | $4,840 | $6.91 | 10d | 3 | 1.05mi |
| 2719 44th Dr Long Island City, NY | 1.0 | 1.0 | 628 | $4,945 | $7.87 | 7d | 2 | 1.26mi |
HOA detail condo
- Monthly dues
- $0 · $0/yr
- Assessments
- None detected in remarks — confirm with the listing agent.
Listing history 6 events
-
2026-06-03statusdays on market $349,000 Pending 70 DOM
-
2026-06-01days on market $349,000 Active 69 DOM
-
2026-05-31days on market $349,000 Active 68 DOM
-
2026-03-24$349,000 Active
-
2026-03-13historical
-
2026-01-08$379,999 Active
ⓘ Source: listings_history table (triggers on properties + properties_extension) + one-shot
backfill from property_details.listing_events for pre-trigger history.
Climate risk First Street
- Flood 1/10 Low FEMA zone X (unshaded) · 0% chance over 30 yrs
- Wildfire 1/10 Low
- Heat 6/10 Major 7 d/yr ≥99°F today · 15 d/yr by 30 yrs out
- Wind 6/10 Major 27% chance of damaging wind over 30 yrs
- Air quality 5/10 Major 6 unhealthy d/yr today · 8 by 30 yrs out
Nearby sold comps map
Loading sold comps map…
Walkable amenities ~0.75 mi
Loading nearby amenities…
Taxation est. · year 1
- Rental income
- $44,639
- − Mortgage interest
- −$19,549
- − Property taxes
- −$5,235
- − Insurance
- −$1,745
- − Repairs & maintenance
- −$3,571
- − Management
- −$3,571
- − HOA
- −$7,512
- − Depreciation
- −$10,153
- Taxable loss
- −$6,697
- Est. tax savings @ 24.0%
- +$1,607
- After-tax cash flow
- $418/yr
For passive investors: Depreciation is non-cash, so a rental often shows a tax loss while cash-flowing — sheltering income. Rental losses are passive: they offset passive income freely, and up to $25,000/yr can offset ordinary (W-2) income if you actively participate and your MAGI is under $100k (phasing out to $0 by $150k); unused losses carry forward. On sale, claimed depreciation is recaptured at up to 25%, and gains may owe capital-gains tax (a 1031 exchange can defer both). Figures are a year-1 estimate at your 24.0% rate — not tax advice; consult a CPA.
Condition & rehab AI · 13 photos
This pre-war bungalow-style one-bedroom co-op is in good condition with good flooring and neutral paint. It needs minor repairs to the kitchen and bathroom and could benefit from exterior painting and updates to the kitchen and bathroom for increased resale and rental value.
Repairs flagged
- Minor Kitchen cabinets — Slight wear visible on the edges.
- Minor Bathroom fixtures — Slight discoloration visible on the fixtures.
Value-add opportunities
- Both Paint the exterior — Enhances curb appeal and resale value.
- Both Replace kitchen cabinets — Modernizes the kitchen and improves functionality.
- Both Install new bathroom fixtures — Enhances the bathroom's appearance and functionality.
Renovation cost estimate screening
| Repair item | Severity | Est. cost |
|---|---|---|
| Kitchen cabinets · Slight wear visible on the edges. | Minor | $500–3,000 |
| Bathroom fixtures · Slight discoloration visible on the fixtures. | Minor | $500–3,000 |
| Total estimated repair cost · 2 items | $1,000–6,000 |
Value-add ROI direction
- Both Paint the exterior — Enhances curb appeal and resale value. ↑
- Both Replace kitchen cabinets — Modernizes the kitchen and improves functionality. ↑
- Both Install new bathroom fixtures — Enhances the bathroom's appearance and functionality. ↑
ⓘ Cost ranges are severity-bucket heuristics (US national rule-of-thumb). Get contractor quotes + a written scope before underwriting a rehab budget.
Schools (NCES district)
No district data.
Livability — New York
- Score
- 75/100
- State rank
- #268
- US rank
- #4188
Category grades
Schools grade is shown separately in the Schools card above.
Census & demographics
- Census place
- New York, NY
- County
- Queens County · 1,914,869 people
- City population
- 7,731,280
- Metro
- New York-Newark-Jersey City, NY-NJ-PA
- Population (ZIP)
- 26,132
- Household income
- $80,709
- Rent vs Own
- Severe rent burden
- 1859.0
Population outlook (Queens County) Hauer SSP2
- Today (2025)
- 2,546,320 people
- By 2030
- 2,643,059 · +3.8%
- By 2040
- 2,815,563 · +10.6%
- By 2050
- 2,944,423 · +15.6%
- By 2075
- 3,123,338 · +22.7%
- By 2100
- 3,098,688 · +21.7%
Race, ethnicity, and origin ACS 2023
- Neighborhood character
- Highly diverse neighborhood (Simpson 0.70)
- Race & ethnicity
- White 38% Asian 28% Hispanic / Latino 27% Two or more races 16% Black 2%
- Hispanic origin (detail)
- Mexican 3% Puerto Rican 3% Dominican 2%
- Common ancestry
- Scandinavian 4% Romanian 3% Lithuanian 2%
- Foreign-born
- 46% · Canada, Jamaica, China
- Languages at home
- 38% English-only · Spanish 24% Other Indo-European 18% Other Asian/Pacific 6%
Political lean MEDSL · Queens
- 2024 margin
- Strong D (+24.6) · D 62.3% · R 37.7%
- 2008→2024 swing
- -26.2pp toward R · 2008: 50.8pp · 2024: 24.6pp
- All cycles
- 2024: D+24.6 2020: D+45.2 2016: D+53.4 2012: D+58.5 2008: D+50.8
Not yet ingested
- Civics
- —
Market trends
- HPI YoY
- ▼ -2.71%
- Current HPI
- 224.0688
- Rent YoY
- ▲ 6.31%
- Metro
- New York-Newark-Jersey City, NY-NJ-PA
- State GDP YoY
- ▲ 2.60%
- F500 in state
- 92
Industry mix (Fortune 500 HQ in NY)
| Industry | F500 HQs | Revenue |
|---|---|---|
| Financial Services | 10 | $950B |
|
||
| Consumer Goods | 9 | $162B |
|
||
| Insurance | 4 | $225B |
|
||
| Telecommunications | 2 | $144B |
|
||
| Pharmaceuticals | 2 | $112B |
|
||
| Media / Entertainment | 2 | $69B |
|
||
Price history
-8.2% since first listed3 events — show timeline
- 2026-03-24 Listed $349,000 OneKey® MLS as Distributed by MLS Grid
- 2026-03-13 Listing Removed — OneKey® MLS as Distributed by MLS Grid
- 2026-01-08 Listed $379,999 OneKey® MLS as Distributed by MLS Grid
Cash-flow waterfall
monthlySold comps — $/sqft
last 12 mo · ≤1 miLoading sold comps…