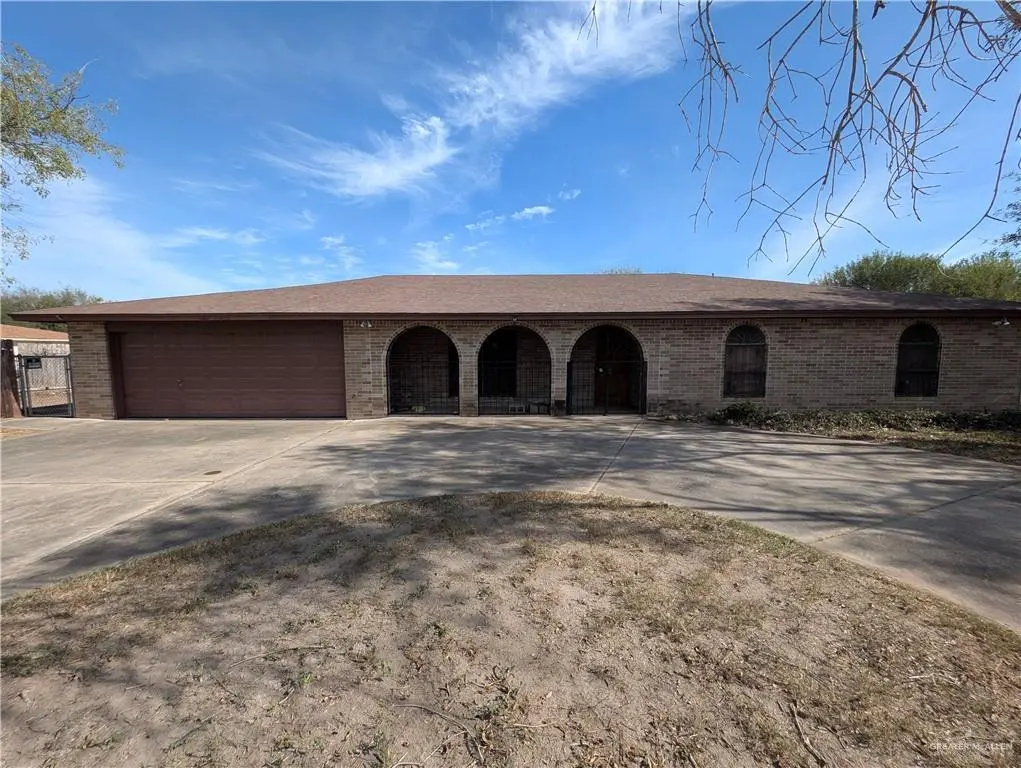
2012 Spring Glen St · Mission, TX
Flood risk 3/10 · Minor
- FEMA flood zone
- X
- Chance of flooding over 30 yrs
- 0.2%
- Est. flood insurance / yr
- $507 – $1,088
Fire risk 1/10 · Minimal
- Est. fire insurance / yr
- $1,222 – $2,270
Heat risk 8/10 · Major
- Hot days now (above 111°F)
- 6 days/yr
- Hot days in 30 yrs
- 19 days/yr
Wind risk 8/10 · Major
- Chance of severe wind over 30 yrs
- 94.0%
Air-quality risk 2/10 · Minimal
- Unhealthy air days now
- 1 days/yr
- Unhealthy air days in 30 yrs
- 2 days/yr
Risk factors via First Street. Map © Google.
Why this score? — see what drove the D+ grade
The composite is a weighted blend of 9 inputs, each scored 0–100. Each bar is that input's sub-score; the figure is the points it added to the 100-point composite (weight × sub-score).
- ARV discount +15.0/15.0
- Cash flow +12.8/30.0
- 1% rule +4.5/10.0
- DSCR +3.8/10.0
- Livability +3.8/5.0
- Rent growth +2.7/5.0
- Condition / age +2.5/5.0
- Schools +1.7/10.0
- Appreciation +0.0/10.0
$250,000
🖨 Deal sheet 📄 Offer letter ✓ Due diligence
Listing remarks MLS
4-bedroom, 2-bath home features two separate living rooms and two dining areas. Situated on almost half-acre corner lot, the property includes a large backyard and a huge covered patio — perfect for outdoor dining, summer barbecues, or just enjoying peace and privacy. The home’s location is unbeatable: minutes from shopping, dining, parks, quality schools, and all the amenities you need for day-to-day convenience.
Key facts
- Quality schools
- Large backyard
- Dining areas
Tags
Neighborhood map
What this means for you Summary
Snapshot
- This is a 5-bed/3.0-bath single-family listed at $250k.
Deal economics
- At list price, monthly cash flow is $-24 ($-287/yr) — negative.
- To cash-flow at today's rent, offer at most $246k (1.7% below list).
- To meet the 1% rule (rent ≥ 1% of price), the offer needs to be $238k (4.9% below list).
- Recommended offer: $220k (12.0% below list) — sets the bar for market timing.
- Cap rate 6.2% vs local median 3.5% in Mission — top-decile yield for the area; either an underpriced asset or a hidden risk that comps aren't pricing in. Stress-test before assuming the spread holds.
Location & tenants
- Location reads 75/100 on livability (#148 in TX, #4,155 nationally) — a middle-class / working-renter tenant base. Strengths: cost of living A+, housing A+, health & safety A+; Watch: schools C-, amenities F, commute F.
- Mission CISD (urban): math 15% / reading 28% proficiency, ranked #775 of 826 in TX (top 94%) — low school quality limits family demand, transient renter base, plan for 1-2y turnover; 78% free/reduced lunch — lower-income household profile, screen leases tightly.
- Market conditions: Rents flat; 852 active listings in the ZIP; 8 comparable units currently listed for rent nearby; rentals lingering (median 44d on market — plan ~5-8 weeks vacancy on turnover, expect pricing pressure); 50% of comp listings sitting > 30 days — soft ceiling on asking rent; 7,378 units permitted in Hidalgo County in 2024 (641 in 5+ unit buildings).
- At $2,377/mo this rent would consume 53% of the median local household income ($54k/yr) (locally 1714% of renters already pay >50% of income on rent) — very limited rent-growth headroom before tenants either downsize or default.
Forward outlook
- Local home prices are declining (-3.0%/yr); year-one equity from $2k of loan paydown is wiped out by about $8k of value loss. Plan a longer hold.
- Hidalgo County population projected at +28% by 2050 — long-run rental-demand tailwind backs the buy-and-hold thesis.
Negotiation context
- It's been on market 196 days — a 12% lower offer ($220k) is reasonable based on typical stale-listing flexibility.
Risks & watch-outs
- Climate carrying-cost: severe wind risk, 94% chance of damaging wind over 30y; extreme-heat days projected 6→19/yr by 2055 (HVAC capex compounding) — expect insurance premiums to compound above CPI over the hold.
Questions for the listing agent
- What do current leases actually rent for vs. the listed asking? Can we see a recent rent roll and the last 12 months of T-12 income?
- It's been on market 196 days. Have you received any prior offers? Is the seller open to a 12% concession, seller financing, or rate buy-down credit?
- Why hasn't it sold? Are there any deal-killer items the seller is aware of (foundation, flood, title, zoning, code violations)?
- Is there a deadline driving the sale (1031 exchange, divorce, estate, relocation)? That informs how much negotiation room exists.
- The area grade is low — what's the realistic commute time and amenity access for the typical tenant pool here? Any planned neighborhood developments (good or bad) we should know about?
- What's the average days-on-market for RENTAL listings here right now (not sales)? A rising rental-DOM trend means longer vacancies and softer asking-rent achievability than the comps imply.
- What's the recent tenant-quality profile in this submarket — average credit score on applications, eviction rate, late-payment / NSF rate, and stable-employment percentage? A property-management company in the area should have these aggregated.
- How much new for-sale + rental construction is in the pipeline within 1–3 miles? Heavy new supply typically softens prices + rents 12–24 months out; constrained supply supports both.
Investment metrics
- 1% rule
- 0.95% ✗
- Cap rate
- 6.18%
- Cash-on-cash
- -0.41%
- DSCR
- 0.98
- GRM
- 8.8
CMA / ARV
- ARV (median comp)
- $303,540
- List price
- $250,000
- Delta
- -17.64%
- Verdict
- UNDERPRICED
- Comps
- 20 within 1.0 mi
Show comp detail 12 sales within ~0.75 mi
| Address | Dist | Beds/Ba | Sqft | Sold | Price | $/sf | Match |
|---|---|---|---|---|---|---|---|
| 1106 Fairway Dr | 0.33mi | 4/3.0 (-1) | 2,468 (0%) | 1mo | $539,000 | $218 | 79 |
| 2212 N Bryan Rd | 0.11mi | 4/2.0 (-1) | 2,524 (+2%) | 4mo | $329,000 | $130 | 78 |
| 1501 Sheri Lee Dr | 0.38mi | 4/3.5 (-1) | 2,595 (+5%) | 8mo | $325,000 | $125 | 61 |
| 1801 Melissa Rae Dr | 0.50mi | 4/3.5 (-1) | 2,634 (+7%) | 10mo | $449,900 | $171 | 50 |
| 1512 E 22nd St | 0.36mi | 4/3.0 (-1) | 2,157 (-13%) | 12mo | $279,000 | $129 | 47 |
| 1605 Lila Beth Ln | 0.57mi | 4/4.0 (-1) | 2,731 (+11%) | 0mo | $398,500 | $146 | 46 |
| 1208 E 28th St | 0.68mi | 5/3.5 | 2,795 (+13%) | 0mo | $318,000 | $114 | 44 |
| 1108 Ann Marie St | 0.37mi | 4/2.0 (-1) | 2,223 (-10%) | 18mo | $219,000 | $99 | 42 |
| 1101 Country Club Dr | 0.42mi | 4/2.0 (-1) | 2,153 (-13%) | 12mo | $255,000 | $118 | 40 |
| 1606 Sheri Lee Dr | 0.55mi | 4/3.0 (-1) | 2,663 (+8%) | 20mo | $379,900 | $143 | 39 |
| 1012 Thornwood Dr | 0.58mi | 4/3.5 (-1) | 2,748 (+11%) | 10mo | $250,000 | $91 | 39 |
| 1609 Crown Point Blvd | 0.58mi | 4/2.5 (-1) | 2,752 (+12%) | 12mo | $389,000 | $141 | 37 |
Match score weights: distance 35% · size 25% · config 20% · recency 20%. Top-matched comps best support the ARV.
Projected returns pro-forma
-3.0% appreciation · 0.93% rent growth · sell at horizon
- IRR
- -19.5%
- Equity multiple
- 0.33×
- Total profit
- $-46,741
- Equity at exit
- $37,276
- IRR
- -17.8%
- Equity multiple
- 0.13×
- Total profit
- $-61,177
- Equity at exit
- $21,615
Cash invested: $70,000 (down + closing). Projections, not guarantees.
Landlord ↔ Tenant lean methodology
- Overall (STATE)
- 87 Strongly Landlord-Friendly
- State Texas
- 87 Strongly Landlord-Friendly · R+5
- County
- — inherits STATE
- City
- — inherits STATE
ZIP-level market 78572
- Home prices YoY
- -22.9%
- Rents YoY
- 0.9%
- Active inventory
- 852
- Price-to-rent
- 8.8×
Monthly cashflow live
- Estimated rent
- $2,377 high interval (Pro) →
- Mortgage (P&I)
- −$1,311
- Tax from tax record
- −$487 /mo · $5,839/yr
- Insurance
- −$104
- HOA
- −$0
- Vacancy / Maint / Mgmt
- −$499
- Net cashflow
- $-24
Break-even live
UW: 25.0% down · 7.5% · 30yr · 1.5% tax · 5.0% vac · 8.0% maint · 8.0% mgmt
Financing live
Cash to close
- Down payment
- $62,500
- Closing costs
- $7,500
- Reserves months
- —
- Total cash needed
- —
Loan-product check · same deal, 3 products live
Conventional
25% down · 7.5% · 30yr
- Down + closing
- —
- Monthly P&I
- —
- Monthly cashflow
- —
- DSCR
- —
- Eligible?
- —
Personal DTI + credit; lowest rate.
DSCR
20% down · 8.5% · 30yr
- Down + closing
- —
- Monthly P&I
- —
- Monthly cashflow
- —
- DSCR
- —
- Eligible?
- —
No personal income docs; deal must DSCR.
Hard money
10% down · 12.0% · 12mo
- Down + closing
- —
- Monthly P&I
- —
- Monthly cashflow
- —
- DSCR
- —
- Eligible?
- —
Short-term bridge; refi at stabilization.
Rent comps 8 comps
| Address | Beds | Baths | Sqft | Rent | $/sqft | DOM | Units | Dist |
|---|---|---|---|---|---|---|---|---|
| 1606 Terrace Dr Mission, TX | 4.0 | 3.0 | 2127 | $2,600 | $1.22 | 14d | 1 | 0.51mi |
| 1301 San Felipe Dr Mission, TX | 4.0 | 3.0 | 2788 | $2,100 | $0.75 | 44d | 1 | 0.59mi |
| 1412 E 28th St Mission, TX | 4.0 | 3.0 | 2068 | $2,300 | $1.11 | 23d | 1 | 0.70mi |
| 1511 E 28th St Mission, TX | 4.0 | 2.5 | 2741 | $2,400 | $0.88 | 44d | 1 | 0.77mi |
| 2516 Wisteria Dr Mission, TX | 4.0 | 3.0 | 2066 | $2,800 | $1.36 | 14d | 1 | 0.90mi |
| 2515 Dove Ave Mission, TX | 5.0 | 3.0 | 2637 | $2,500 | $0.95 | 44d | 1 | 1.22mi |
| 2510 May Ave Mission, TX | 4.0 | 4.0 | 2437 | $2,500 | $1.03 | 23d | 1 | 1.28mi |
| 2200 E 27th St Mission, TX | 4.0 | 3.5 | 2351 | $2,600 | $1.11 | 44d | 1 | 1.41mi |
Listing history 19 events
-
2026-06-18days on market $250,000 Active 196 DOM
-
2026-06-17days on market $250,000 Active 195 DOM
-
2026-06-16days on market $250,000 Active 194 DOM
-
2026-06-15days on market $250,000 Active 193 DOM
-
2026-06-14days on market $250,000 Active 191 DOM
-
2026-06-10days on market $250,000 Active 188 DOM
-
2026-06-09days on market $250,000 Active 187 DOM
-
2026-06-08days on market $250,000 Active 186 DOM
-
2026-06-07days on market $250,000 Active 185 DOM
-
2026-06-03days on market $250,000 Active 181 DOM
-
2026-06-02days on market $250,000 Active 180 DOM
-
2026-06-01days on market $250,000 Active 179 DOM
-
2026-05-31days on market $250,000 Active 178 DOM
-
2026-05-31days on market $250,000 Active 177 DOM
-
2026-04-09price $250,000 429-char remark
Show marketing remark (429 chars)
4-bedroom, 2-bath home features two separate living rooms and two dining areas. Situated on almost half-acre corner lot, the property includes a large backyard and a huge covered patio — perfect for outdoor dining, summer barbecues, or just enjoying peace and privacy. The home’s location is unbeatable: minutes from shopping, dining, parks, quality schools, and all the amenities you need for day-to-day convenience.
-
2026-03-02price $280,000 429-char remark
Show marketing remark (429 chars)
4-bedroom, 2-bath home features two separate living rooms and two dining areas. Situated on almost half-acre corner lot, the property includes a large backyard and a huge covered patio — perfect for outdoor dining, summer barbecues, or just enjoying peace and privacy. The home’s location is unbeatable: minutes from shopping, dining, parks, quality schools, and all the amenities you need for day-to-day convenience.
-
2026-01-28price $299,500 429-char remark
Show marketing remark (429 chars)
4-bedroom, 2-bath home features two separate living rooms and two dining areas. Situated on almost half-acre corner lot, the property includes a large backyard and a huge covered patio — perfect for outdoor dining, summer barbecues, or just enjoying peace and privacy. The home’s location is unbeatable: minutes from shopping, dining, parks, quality schools, and all the amenities you need for day-to-day convenience.
-
2025-12-04$325,000 Active 429-char remark
Show marketing remark (429 chars)
4-bedroom, 2-bath home features two separate living rooms and two dining areas. Situated on almost half-acre corner lot, the property includes a large backyard and a huge covered patio — perfect for outdoor dining, summer barbecues, or just enjoying peace and privacy. The home’s location is unbeatable: minutes from shopping, dining, parks, quality schools, and all the amenities you need for day-to-day convenience.
-
2020-11-12soldstatus
ⓘ Source: listings_history table (triggers on properties + properties_extension) + one-shot
backfill from property_details.listing_events for pre-trigger history.
Tax reassessment forecast TX · Resets to sale price
- Current annual tax
- $5,839 · $487/mo
- Projected year-2 tax
- $5,839 · $487/mo
- Expected delta
- $0/yr ($0/mo · 0.0%)
ⓘ Screening estimate from a state-policy table — verify with the county assessor before closing.
Climate risk First Street
- Flood 3/10 Moderate FEMA zone X · 20% chance over 30 yrs
- Wildfire 1/10 Low
- Heat 8/10 Severe 6 d/yr ≥111°F today · 19 d/yr by 30 yrs out
- Wind 8/10 Severe 94% chance of damaging wind over 30 yrs
- Air quality 2/10 Low 1 unhealthy d/yr today · 2 by 30 yrs out
Nearby sold comps map
Loading sold comps map…
Walkable amenities ~0.75 mi
Loading nearby amenities…
Taxation est. · year 1
- Rental income
- $28,525
- − Mortgage interest
- −$14,004
- − Property taxes
- −$5,839
- − Insurance
- −$1,250
- − Repairs & maintenance
- −$2,282
- − Management
- −$2,282
- − Depreciation
- −$7,273
- Taxable loss
- −$4,405
- Est. tax savings @ 24.0%
- +$1,057
- After-tax cash flow
- $770/yr
For passive investors: Depreciation is non-cash, so a rental often shows a tax loss while cash-flowing — sheltering income. Rental losses are passive: they offset passive income freely, and up to $25,000/yr can offset ordinary (W-2) income if you actively participate and your MAGI is under $100k (phasing out to $0 by $150k); unused losses carry forward. On sale, claimed depreciation is recaptured at up to 25%, and gains may owe capital-gains tax (a 1031 exchange can defer both). Figures are a year-1 estimate at your 24.0% rate — not tax advice; consult a CPA.
Schools (NCES district)
- District
- Mission CISD
- NCES district ID
- 4831040
- Math proficiency
- 15% ▼ -35.00%
- Reading proficiency
- 28% ▼ -15.00%
- Median HH income
- $32,855
- Composite
- 17.47/100
- National rank
- #9061
- State rank
- #775 of 826 in TX
Livability — Mission
- Score
- 75/100
- State rank
- #148
- US rank
- #4155
Category grades
Schools grade is shown separately in the Schools card above.
Census & demographics
- Census place
- Mission, TX
- County
- Hidalgo County · 623,128 people
- City population
- 78,024
- Metro
- McAllen-Edinburg-Mission, TX
- Population (ZIP)
- 78,024
- Household income
- $54,298
- Rent vs Own
- Severe rent burden
- 1714.0
Population outlook (Hidalgo County) Hauer SSP2
- Today (2025)
- 955,232 people
- By 2030
- 1,009,774 · +5.7%
- By 2040
- 1,120,332 · +17.3%
- By 2050
- 1,225,036 · +28.2%
- By 2075
- 1,439,189 · +50.7%
- By 2100
- 1,533,429 · +60.5%
Race, ethnicity, and origin ACS 2023
- Neighborhood character
- Predominantly Hispanic (85%)
- Race & ethnicity
- Hispanic / Latino 85% Two or more races 47% White 12% Asian 2%
- Hispanic origin (detail)
- Mexican 80%
- Common ancestry
- Slovak 1% Portuguese 0%
- Foreign-born
- 28% · Canada, South Korea
- Languages at home
- 22% English-only · Spanish 76%
Political lean MEDSL · Hidalgo
- 2024 margin
- Toss-up / Even · D 48.1% · R 51.0%
- 2008→2024 swing
- -41.6pp toward R · 2008: 38.7pp · 2024: -2.9pp
- All cycles
- 2024: R+2.9 2020: D+17.1 2016: D+40.5 2012: D+41.8 2008: D+38.7
Not yet ingested
- Civics
- —
Market trends
- HPI YoY
- ▼ -62.35%
- Current HPI
- 209.3573
- Rent YoY
- ▲ 0.93%
- Metro
- McAllen-Edinburg-Mission, TX
- State GDP YoY
- ▲ 3.95%
- F500 in state
- 110
Industry mix (Fortune 500 HQ in TX)
| Industry | F500 HQs | Revenue |
|---|---|---|
| Energy | 16 | $1,198B |
|
||
| Technology | 5 | $198B |
|
||
| Engineering / Construction | 4 | $72B |
|
||
| Energy Services | 3 | $60B |
|
||
| Utilities | 3 | $41B |
|
||
| Healthcare | 2 | $330B |
|
||
Price history
-23.1% since first listed5 events — show timeline
- 2026-04-09 Price Changed $250,000 MCALLENMLS
- 2026-03-02 Price Changed $280,000 MCALLENMLS
- 2026-01-28 Price Changed $299,500 MCALLENMLS
- 2025-12-04 Listed $325,000 MCALLENMLS
- 2020-11-12 Sold (Public Records) — Public Records
Property tax history
+5.1%/yrLatest (2025): $5,839 · +10.0% YoY. Source: county tax records.
Cash-flow waterfall
monthlySold comps — $/sqft
last 12 mo · ≤1 miLoading sold comps…