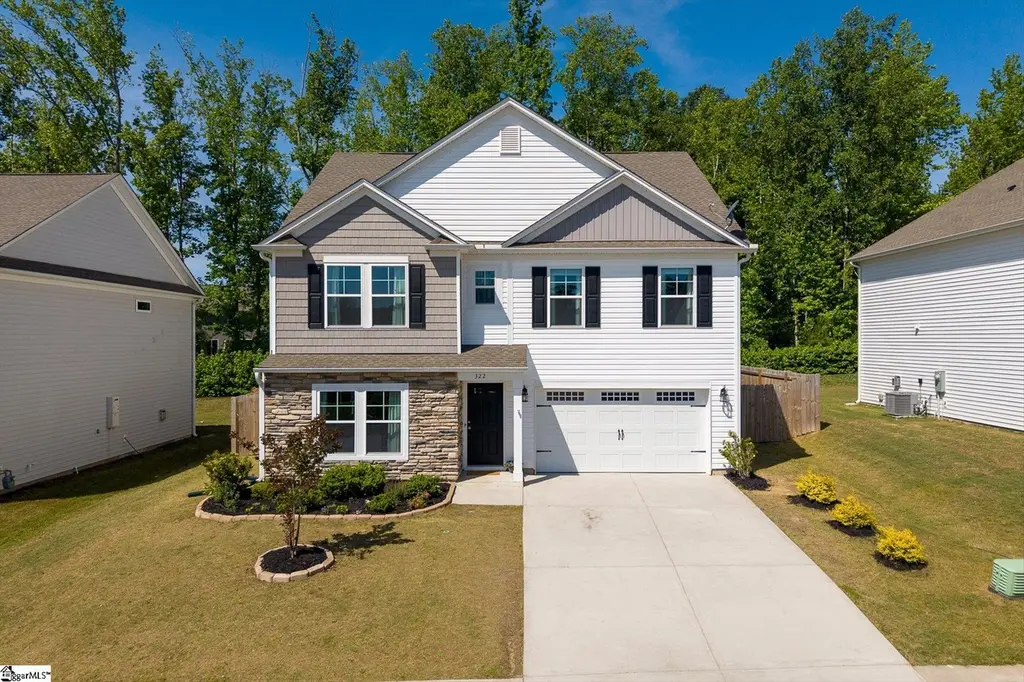
322 Chinchilla Dr · Fountain Inn, SC
Flood risk 1/10 · Minimal
- FEMA flood zone
- X (unshaded)
- Chance of flooding over 30 yrs
- 0.0%
- Est. flood insurance / yr
- $507 – $1,088
Fire risk 4/10 · Minor
- Est. fire insurance / yr
- $783 – $1,453
Heat risk 6/10 · Moderate
- Hot days now (above 105°F)
- 7 days/yr
- Hot days in 30 yrs
- 17 days/yr
Wind risk 2/10 · Minimal
- Chance of severe wind over 30 yrs
- 2.0%
Air-quality risk 3/10 · Minor
- Unhealthy air days now
- 3 days/yr
- Unhealthy air days in 30 yrs
- 3 days/yr
Risk factors via First Street. Map © Google.
Why this score? — see what drove the D grade
The composite is a weighted blend of 9 inputs, each scored 0–100. Each bar is that input's sub-score; the figure is the points it added to the 100-point composite (weight × sub-score).
- Cash flow +11.0/30.0
- ARV discount +9.4/15.0
- Schools +4.2/10.0
- Livability +4.1/5.0
- Rent growth +3.6/5.0
- DSCR +3.2/10.0
- 1% rule +2.5/10.0
- Condition / age +2.5/5.0
- Appreciation +0.0/10.0
$345,000
🖨 Deal sheet 📄 Offer letter ✓ Due diligence
Listing remarks
Experience the perfect blend of modern style and comfortable living at 322 Chinchilla Drive. This stunning home makes a lasting first impression with its striking stone accents, classic shutters, and meticulous landscaping. Step inside to find an inviting open floor plan characterized by clean lines, modern flooring, and large windows that flood the home with natural light. The main living area features a spacious family room centered around a cozy fireplace with a classic white mantel, creating a warm atmosphere for everyday living. The kitchen is a chef's dream, offering abundant working space and cabinets. It features elegant gray cabinetry with gold hardware, granite countertops, a cent
Key facts
- Large windows
- Open floor plan
- Classic shutters
Tags
Property features AI
Finance
- HOA & community: Homeowners association present; HOA covers common area insurance and electric, pool, street lights, and enforces restrictive covenants; Community amenities include pool, common areas, some sidewalks, and lighting
Exterior
- Parking: Attached 2-car garage; Paved concrete driveway
- Utilities: Public water; Public sewer; Public garbage pickup; Electric power
- Home design: Residential property; 2-story home; Built in 2021
- Construction: Architectural roof; Slab foundation; Exterior finished with stone and vinyl siding
- Exterior features: Covered back porch; Patio; Vinyl/aluminum trim; Stone and vinyl siding exterior; Fenced yard; Level lot with some trees
Interior
- Kitchen: Granite countertops; Built-in microwave; Smooth-top range; Garbage disposal
- Bedrooms: Primary suite on 2nd level with double sinks, separate shower, garden tub, and walk-in closet; Bedroom 2: approx. 10 x 11; Bedroom 3: approx. 11 x 14; Bedroom 4: approx. 12 x 14; Primary bedroom approx. 17 x 18
- Flooring: Luxury vinyl tile/plank
- Bathrooms: 2 full bathrooms; 1 half bathroom
- Heating & cooling: Forced-air heating; Central electric cooling with damper control; Gas water heater
- Interior features: Attic with disappearing stairs; Cable available; 9-ft+ ceilings; Ceiling fans; Cathedral/vaulted ceilings; Smooth ceilings; Granite countertops; Open floor plan; Garden tub; Walk-in pantry; Multiple walk-in closets; Gas-log fireplace
- Laundry & utility: Laundry on 2nd floor; Walk-in laundry
Neighborhood map
What this means for you Summary
Snapshot
- This is a 4-bed/2.5-bath single-family listed at $345k.
Deal economics
- At list price, monthly cash flow is $-143 ($-2k/yr) — negative.
- To cash-flow at today's rent, offer at most $320k (7.3% below list).
- To meet the 1% rule (rent ≥ 1% of price), the offer needs to be $259k (24.8% below list).
- Recommended offer: $259k (24.8% below list) — sets the bar for 1% rule.
- Cap rate 5.8% vs local median 4.2% in Fountain Inn — top-decile yield for the area; either an underpriced asset or a hidden risk that comps aren't pricing in. Stress-test before assuming the spread holds.
Location & tenants
- Location reads 82/100 on livability (#4 in SC, #1,162 nationally) — a professional / high-income tenant draw. Strengths: crime A+, cost of living A+, housing A+; Watch: commute F.
- Greenville 01 (suburban): math 44% / reading 54% proficiency, ranked #10 of 80 in SC (top 12%) — families likely to look elsewhere, expect single-tenant / working-renter base with shorter leases.
- Zoned schools: Fountain Inn Elementary (math 48% / reading 47%, grade D, #199 of 597 statewide, top 35%, 835 students, 100% FRL) — zoned schools average 100% FRL vs 42% district-wide (58 pts higher); higher-poverty schools than district average — tighter screening recommended.
- Market conditions: Rents rising fast (+4.5%/yr); 482 active listings in the ZIP; 2 comparable units currently listed for rent nearby; 621 units permitted in Laurens County in 2024 (0 in 5+ unit buildings).
- This rent runs 44% of the median local income ($70k/yr) — at the standard rent-burdened threshold; future hikes will face affordability resistance.
Forward outlook
- Local home prices are declining (-3.0%/yr); year-one equity from $2k of loan paydown is wiped out by about $10k of value loss. Plan a longer hold.
- Laurens County population projected to shrink 7% by 2050 — rents likely to lag national; underwrite the cash flow, not the appreciation.
Negotiation context
- It's been on market 43 days — a 3% lower offer ($335k) is reasonable based on typical stale-listing flexibility.
- 3 sale attempts since 2y ago with the ask held roughly flat each time — persistent listings suggest the price (not the market) is what's stuck; bring a comps-based counter.
Risks & watch-outs
- Climate carrying-cost: extreme-heat days projected 7→17/yr by 2055 (HVAC capex compounding) — expect insurance premiums to compound above CPI over the hold.
Questions for the listing agent
- What do current leases actually rent for vs. the listed asking? Can we see a recent rent roll and the last 12 months of T-12 income?
- It's been on market 43 days. Have you received any prior offers? Is the seller open to a 25% concession, seller financing, or rate buy-down credit?
- What does the HOA fee cover, when was the last increase, and are there any pending special assessments or reserve-fund shortfalls?
- Is there a deadline driving the sale (1031 exchange, divorce, estate, relocation)? That informs how much negotiation room exists.
- The area grade is low — what's the realistic commute time and amenity access for the typical tenant pool here? Any planned neighborhood developments (good or bad) we should know about?
- What's the average days-on-market for RENTAL listings here right now (not sales)? A rising rental-DOM trend means longer vacancies and softer asking-rent achievability than the comps imply.
- What's the recent tenant-quality profile in this submarket — average credit score on applications, eviction rate, late-payment / NSF rate, and stable-employment percentage? A property-management company in the area should have these aggregated.
- How much new for-sale + rental construction is in the pipeline within 1–3 miles? Heavy new supply typically softens prices + rents 12–24 months out; constrained supply supports both.
Investment metrics
- 1% rule
- 0.75% ✗
- Cap rate
- 5.79%
- Cash-on-cash
- -1.78%
- DSCR
- 0.92
- GRM
- 11.1
CMA / ARV
- ARV (on-the-fly)
- $359,931
- Comps found
- 12
Show comp detail 12 sales within ~0.75 mi
| Address | Dist | Beds/Ba | Sqft | Sold | Price | $/sf | Match |
|---|---|---|---|---|---|---|---|
| 145 Bruinen Dr | 0.21mi | 4/2.5 | 2,443 (-3%) | 2mo | $325,000 | $133 | 83 |
| 314 Gammon Ln Lot 0378 | 0.66mi | 4/3.0 | 2,511 (-0%) | 14mo | $343,900 | $137 | 55 |
| 14 Snowy Ct | 0.28mi | 5/3.0 (+1) | 2,292 (-9%) | 13mo | $350,000 | $153 | 54 |
| 307 Boxbury Way | 0.55mi | 5/3.0 (+1) | 2,511 (-0%) | 17mo | $344,900 | $137 | 53 |
| 111 Bruinen Dr | 0.30mi | 5/3.0 (+1) | 2,280 (-9%) | 16mo | $345,000 | $151 | 50 |
| 601 Bonifay Dr | 0.58mi | 5/3.0 (+1) | 2,511 (-0%) | 19mo | $344,810 | $137 | 50 |
| 508 Gammon Ln | 0.72mi | 5/3.0 (+1) | 2,592 (+3%) | 7mo | $370,000 | $143 | 49 |
| 534 Bonifay Dr | 0.59mi | 5/3.0 (+1) | 2,511 (-0%) | 21mo | $342,900 | $137 | 48 |
| 335 Gammon Ln | 0.69mi | 5/3.0 (+1) | 2,511 (-0%) | 16mo | $359,900 | $143 | 47 |
| 335 Gammon Ln | 0.69mi | 5/3.0 (+1) | 2,511 (-0%) | 16mo | $359,900 | $143 | 47 |
| 145 Boxbury Way | 0.51mi | 5/3.0 (+1) | 2,368 (-6%) | 20mo | $324,900 | $137 | 43 |
| 114 Mosby Dr | 0.64mi | 4/2.5 | 2,175 (-14%) | 8mo | $334,000 | $154 | 41 |
Match score weights: distance 35% · size 25% · config 20% · recency 20%. Top-matched comps best support the ARV.
Projected returns pro-forma
-3.0% appreciation · 4.55% rent growth · sell at horizon
- IRR
- -17.7%
- Equity multiple
- 0.37×
- Total profit
- $-60,992
- Equity at exit
- $51,441
- IRR
- -7.4%
- Equity multiple
- 0.51×
- Total profit
- $-47,765
- Equity at exit
- $29,829
Cash invested: $96,600 (down + closing). Projections, not guarantees.
Landlord ↔ Tenant lean methodology
- Overall (STATE)
- 90 Strongly Landlord-Friendly
- State South Carolina
- 90 Strongly Landlord-Friendly · R+6
- County
- — inherits STATE
- City
- — inherits STATE
ZIP-level market 29644
- Home prices YoY
- -28.6%
- Rents YoY
- 4.5%
- Active inventory
- 482
- Price-to-rent
- 11.1×
Monthly cashflow live
- Estimated rent
- $2,595 medium interval (Pro) →
- Mortgage (P&I)
- −$1,809
- Tax from tax record
- −$205 /mo · $2,463/yr
- Insurance
- −$144
- HOA
- −$35
- Vacancy / Maint / Mgmt
- −$545
- Net cashflow
- $-143
Break-even live
UW: 25.0% down · 7.5% · 30yr · 1.5% tax · 5.0% vac · 8.0% maint · 8.0% mgmt
Financing live
Cash to close
- Down payment
- $86,250
- Closing costs
- $10,350
- Reserves months
- —
- Total cash needed
- —
Loan-product check · same deal, 3 products live
Conventional
25% down · 7.5% · 30yr
- Down + closing
- —
- Monthly P&I
- —
- Monthly cashflow
- —
- DSCR
- —
- Eligible?
- —
Personal DTI + credit; lowest rate.
DSCR
20% down · 8.5% · 30yr
- Down + closing
- —
- Monthly P&I
- —
- Monthly cashflow
- —
- DSCR
- —
- Eligible?
- —
No personal income docs; deal must DSCR.
Hard money
10% down · 12.0% · 12mo
- Down + closing
- —
- Monthly P&I
- —
- Monthly cashflow
- —
- DSCR
- —
- Eligible?
- —
Short-term bridge; refi at stabilization.
Rent comps 2 comps
| Address | Beds | Baths | Sqft | Rent | $/sqft | DOM | Units | Dist |
|---|---|---|---|---|---|---|---|---|
| 370 Alyssa Lndg Dr Fountain Inn, SC | 5.0 | 3.0 | 2300 | $2,449 | $1.06 | 19d | 1 | 1.11mi |
| 40 Fernhill Ln Fountain Inn, SC | 3.0 | 3.0 | 1983 | $1,900 | $0.96 | 3d | 1 | 1.40mi |
HOA detail
- Monthly dues
- $35 · $420/yr
- Likely covers
- landscaping
Listing history 21 events
-
2026-06-18days on market $345,000 Active 43 DOM
-
2026-06-17days on market $345,000 Active 42 DOM
-
2026-06-16days on market $345,000 Active 41 DOM
-
2026-06-15days on market $345,000 Active 40 DOM
-
2026-06-13days on market $345,000 Active 38 DOM
-
2026-06-13days on market $345,000 Active 37 DOM
-
2026-06-10days on market $345,000 Active 35 DOM
-
2026-06-09days on market $345,000 Active 34 DOM
-
2026-06-08days on market $345,000 Active 33 DOM
-
2026-06-07days on market $345,000 Active 32 DOM
-
2026-06-03days on market $345,000 Active 28 DOM
-
2026-06-03days on market $345,000 Active 27 DOM
-
2026-06-01days on market $345,000 Active 26 DOM
-
2026-05-31days on market $345,000 Active 25 DOM
-
2026-05-19price $345,000
-
2026-05-06$350,000 Active
-
2024-06-03historical
-
2024-05-16$370,000 Active
-
2024-05-15historical
-
2024-03-27price $370,000
-
2024-03-01$380,000 Active
ⓘ Source: listings_history table (triggers on properties + properties_extension) + one-shot
backfill from property_details.listing_events for pre-trigger history.
Tax reassessment forecast SC · Resets to sale price
- Current annual tax
- $2,463 · $205/mo
- Projected year-2 tax
- $2,463 · $205/mo
- Expected delta
- $0/yr ($0/mo · 0.0%)
ⓘ Screening estimate from a state-policy table — verify with the county assessor before closing.
Climate risk First Street
- Flood 1/10 Low FEMA zone X (unshaded) · 0% chance over 30 yrs
- Wildfire 4/10 Moderate
- Heat 6/10 Major 7 d/yr ≥105°F today · 17 d/yr by 30 yrs out
- Wind 2/10 Low 2% chance of damaging wind over 30 yrs
- Air quality 3/10 Moderate 3 unhealthy d/yr today · 3 by 30 yrs out
Nearby sold comps map
Loading sold comps map…
Walkable amenities ~0.75 mi
Loading nearby amenities…
Taxation est. · year 1
- Rental income
- $31,140
- − Mortgage interest
- −$19,325
- − Property taxes
- −$2,463
- − Insurance
- −$1,725
- − Repairs & maintenance
- −$2,491
- − Management
- −$2,491
- − HOA
- −$420
- − Depreciation
- −$10,036
- Taxable loss
- −$7,812
- Est. tax savings @ 24.0%
- +$1,875
- After-tax cash flow
- $157/yr
For passive investors: Depreciation is non-cash, so a rental often shows a tax loss while cash-flowing — sheltering income. Rental losses are passive: they offset passive income freely, and up to $25,000/yr can offset ordinary (W-2) income if you actively participate and your MAGI is under $100k (phasing out to $0 by $150k); unused losses carry forward. On sale, claimed depreciation is recaptured at up to 25%, and gains may owe capital-gains tax (a 1031 exchange can defer both). Figures are a year-1 estimate at your 24.0% rate — not tax advice; consult a CPA.
Schools (NCES district)
- District
- Greenville 01
- NCES district ID
- 4502310
- Math proficiency
- 44% ▼ -10.00%
- Reading proficiency
- 54% ▼ -2.00%
- Median HH income
- $49,596
- Composite
- 41.88/100
- National rank
- #3370
- State rank
- #10 of 80 in SC
Livability — Fountain Inn
- Score
- 82/100
- State rank
- #4
- US rank
- #1162
Category grades
Schools grade is shown separately in the Schools card above.
Census & demographics
- Census place
- Fountain Inn, SC
- County
- Greenville County · 573,815 people
- City population
- 22,907
- Metro
- Greenville-Anderson, SC
- Population (ZIP)
- 22,907
- Household income
- $70,301
- Rent vs Own
- Severe rent burden
- 475.0
Population outlook (Laurens County) Hauer SSP2
- Today (2025)
- 66,741 people
- By 2030
- 66,454 · -0.4%
- By 2040
- 64,881 · -2.8%
- By 2050
- 61,941 · -7.2%
- By 2075
- 53,266 · -20.2%
- By 2100
- 41,495 · -37.8%
Race, ethnicity, and origin ACS 2023
- Neighborhood character
- Predominantly White (66%)
- Race & ethnicity
- White 66% Black 18% Two or more races 10% Hispanic / Latino 10%
- Hispanic origin (detail)
- Mexican 3% Puerto Rican 2%
- Common ancestry
- Slovak 3% Romanian 2% Lithuanian 2%
- Foreign-born
- 6% · Canada, Jamaica
- Languages at home
- 89% English-only · Spanish 9% Tagalog/Filipino 1%
Political lean MEDSL · Laurens
- 2024 margin
- Solid R (+40.9) · D 29.0% · R 69.9% · Other 1.1%
- 2008→2024 swing
- -22.8pp toward R · 2008: -18.1pp · 2024: -40.9pp
- All cycles
- 2024: R+40.9 2020: R+32.3 2016: R+29.9 2012: R+17.5 2008: R+18.1
Not yet ingested
- Civics
- —
Market trends
- HPI YoY
- ▼ -100.45%
- Current HPI
- 250.5271
- Rent YoY
- ▲ 4.55%
- Metro
- Greenville-Anderson, SC
- State GDP YoY
- ▲ 4.51%
- F500 in state
- 2
Industry mix (Fortune 500 HQ in SC)
| Industry | F500 HQs | Revenue |
|---|---|---|
| Packaging | 1 | $7B |
|
||
Price history
-9.2% since first listed7 events — show timeline
- 2026-05-19 Price Changed $345,000 Greater Greenville MLS
- 2026-05-06 Listed $350,000 Greater Greenville MLS
- 2024-06-03 Listing Removed — Greater Greenville MLS
- 2024-05-16 Listed $370,000 Greater Greenville MLS
- 2024-05-15 Listing Removed — Greater Greenville MLS
- 2024-03-27 Price Changed $370,000 Greater Greenville MLS
- 2024-03-01 Listed $380,000 Greater Greenville MLS
Property tax history
+40.5%/yrLatest (2025): $2,463 · +4.5% YoY. Source: county tax records.
Cash-flow waterfall
monthlySold comps — $/sqft
last 12 mo · ≤1 miLoading sold comps…