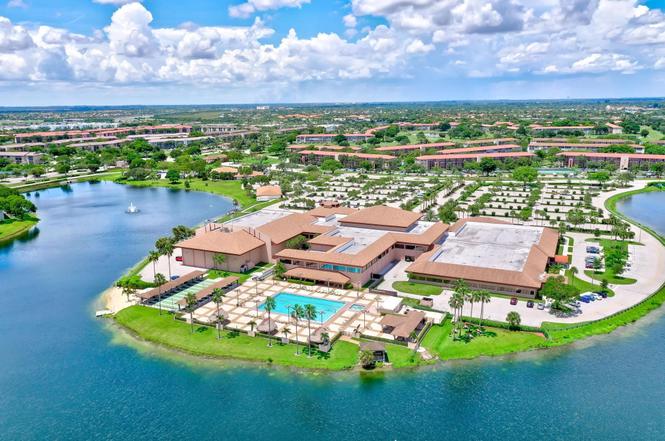
 🌊 Lakefront
1400 SW 137th Ave Unit 311F · Pembroke Pines, FL
Flood risk 6/10 · Moderate
- FEMA flood zone
- X (shaded)
- Chance of flooding over 30 yrs
- 0.75%
- Est. flood insurance / yr
- $507 – $1,088
Fire risk 1/10 · Minimal
- Est. fire insurance / yr
- $947 – $1,759
Heat risk 10/10 · Severe
- Hot days now (above 106°F)
- 7 days/yr
- Hot days in 30 yrs
- 28 days/yr
Wind risk 10/10 · Severe
- Chance of severe wind over 30 yrs
- 99.0%
Air-quality risk 2/10 · Minimal
- Unhealthy air days now
- 2 days/yr
- Unhealthy air days in 30 yrs
- 2 days/yr
Risk factors via First Street. Map © Google.
Why this score? — see what drove the D grade
The composite is a weighted blend of 9 inputs, each scored 0–100. Each bar is that input's sub-score; the figure is the points it added to the 100-point composite (weight × sub-score).
- Cash flow +8.8/30.0
- 1% rule +7.5/10.0
- ARV discount +7.5/15.0
- Livability +4.2/5.0
- Schools +4.1/10.0
- Appreciation +4.0/10.0
- Rent growth +2.5/5.0
- Condition / age +2.5/5.0
- DSCR +2.4/10.0
$164,800
🖨 Deal sheet (PDF) 📄 Offer letter ✓ Due diligence
Listing remarks
NEWEST SECTION AND THE BEST BUILDING IN THE ENTIRE COMMUNITY !!! "HIBISCUS MODEL" ; BRIGHT 1 BEDROOM; 1.5 BATHROOMS CONDO ON THE 3RD FLOOR; PRIVATE BALCONY ; WASHER AND DRYER; WALKING DISTANCE FROM THE FITNESS CENTER; SERENE LAKE VIEW; LAMINATED FLOORS. 55+ COMMUNITY OFFERING EXCELLENT AMENITIES. PRIME LOCATION NEAR UPSCALE SHOPPING & DINING. CONFORTABLE LIVING AT ITS BEST!
Key facts
- Private balcony
- Washer and dryer
- Laminated floors
Tags
Property features AI
Finance
- HOA & community: Monthly HOA with multiple amenities; On-site clubhouse and fitness center; Pool and sauna; Billiard room; Bocce ball and pickleball courts; Cafe/restaurant; Courtesy bus; Trash chute; Parking managed by association; HOA covers grounds and structure maintenance, pest control, sewer, trash, water, common areas, roof repairs, and pool service; Monthly HOA fee: $630; Senior community
Exterior
- Parking: Assigned parking
- Security: Security guard; Key card entry; Security fence; Smoke detectors
- Utilities: Public water; Public sewer; Electric service
- Home design: Condominium; Resale property; Third-floor entry; Four-story building; Building name: F
- Construction: CBS construction
- Exterior features: Screened porch; Fenced yard; Waterfront: Yes (no specific waterfront features listed)
Interior
- Kitchen: Dishwasher; Electric range; Microwave; Refrigerator; Electric water heater
- Bedrooms: Three bedrooms on the main level (third-floor entry)
- Flooring: Laminate flooring
- Bathrooms: One full bathroom; One half bathroom
- Heating & cooling: Central heating; Central air conditioning
- Interior features: Blinds on windows; Unfurnished
- Laundry & utility: Electric water heater
Neighborhood map
What this means for you Summary
Snapshot
- This is a 1-bed/1.5-bath condo listed at $165k.
Deal economics
- At list price, monthly cash flow is $-136 ($-2k/yr) — negative.
- To cash-flow at today's rent, offer at most $145k (11.9% below list).
- Meets the 1% rule at list price ($2k rent vs $165k).
- Recommended offer: $145k (11.9% below list) — sets the bar for cash-flow.
- Cap rate 5.3% vs local median 4.0% in Pembroke Pines — top-decile yield for the area; either an underpriced asset or a hidden risk that comps aren't pricing in. Stress-test before assuming the spread holds.
Location & tenants
- Location reads 83/100 on livability (#54 in FL, #933 nationally) — a professional / high-income tenant draw. Strengths: housing A+, health & safety A+, crime A-; Watch: amenities D+, cost of living D+.
- Broward (suburban): math 42% / reading 53% proficiency, ranked #46 of 73 in FL (top 63%) — families likely to look elsewhere, expect single-tenant / working-renter base with shorter leases.
- Zoned schools: Nova Blanche Forman Elementary (math 35% / reading 55%, grade D-, #1,271 of 2,144 statewide, top 60%, 769 students, 72% FRL); Nova Middle School (math 44% / reading 53%, grade C-, #274 of 571 statewide, top 50%, 1,284 students, 68% FRL); Charles W Flanagan High School (math 29% / reading 50%, grade F, #304 of 667 statewide, top 47%, 2,475 students, 57% FRL).
- Market conditions: Rents soft (-0.2%/yr); 549 active listings in the ZIP; 40 comparable units currently listed for rent nearby; rentals at typical pace (median 21d on market — plan ~3-4 weeks tenant-placement turnaround); solid renter incomes; 2,111 units permitted in Broward County in 2024 (1,265 in 5+ unit buildings).
- This rent runs 32% of the median local income ($77k/yr) — at the standard rent-burdened threshold; future hikes will face affordability resistance.
Forward outlook
- Local home prices are declining (-2.0%/yr); year-one equity from $1k of loan paydown is wiped out by about $3k of value loss. Plan a longer hold.
- Broward County population projected at +34% by 2050 — long-run rental-demand tailwind backs the buy-and-hold thesis.
Negotiation context
- It's been on market 102 days — a 9% lower offer ($150k) is reasonable based on typical stale-listing flexibility.
- 3 sale attempts since 2y ago with the ask held roughly flat each time — persistent listings suggest the price (not the market) is what's stuck; bring a comps-based counter.
Risks & watch-outs
- Watch-outs: HOA is 30% of rent.
- Climate carrying-cost: major flood risk; severe wind risk, 99% chance of damaging wind over 30y; extreme-heat days projected 7→28/yr by 2055 (HVAC capex compounding) — expect insurance premiums to compound above CPI over the hold.
Questions for the listing agent
- What do current leases actually rent for vs. the listed asking? Can we see a recent rent roll and the last 12 months of T-12 income?
- It's been on market 102 days. Have you received any prior offers? Is the seller open to a 12% concession, seller financing, or rate buy-down credit?
- What does the HOA fee cover, when was the last increase, and are there any pending special assessments or reserve-fund shortfalls?
- Any open or pending special assessments — roof, HVAC, plumbing, elevator, façade? What's the per-unit balance and payoff schedule, and is the seller paying it off at close or rolling it to the buyer?
- Why hasn't it sold? Are there any deal-killer items the seller is aware of (foundation, flood, title, zoning, code violations)?
- Is there a deadline driving the sale (1031 exchange, divorce, estate, relocation)? That informs how much negotiation room exists.
- Schools are A-rated — typically a magnet for longer-tenancy family renters. What's the average tenant stay here, and is there a school-zone premium baked into asking?
- The area grade is low — what's the realistic commute time and amenity access for the typical tenant pool here? Any planned neighborhood developments (good or bad) we should know about?
- This sits on a lake — are riparian / water-frontage rights deeded with the parcel? Any dock permits, shoreline easements, or HOA water-use restrictions?
- What's the documented flood / surge / shoreline-erosion history here (FEMA AND non-FEMA — e.g., storm surge, creek backup, septic-field saturation)?
- Any water-quality or seasonal algae-bloom issues that affect tenant satisfaction or short-term-rental demand?
- What's the average days-on-market for RENTAL listings here right now (not sales)? A rising rental-DOM trend means longer vacancies and softer asking-rent achievability than the comps imply.
- What's the recent tenant-quality profile in this submarket — average credit score on applications, eviction rate, late-payment / NSF rate, and stable-employment percentage? A property-management company in the area should have these aggregated.
- How much new apartment / multifamily construction is in the pipeline within 1–3 miles? Heavy new supply (>2% of stock underway) typically softens rents 12–24 months out; light construction supports rent growth.
Investment metrics
- 1% rule
- 1.25% ✓
- Cap rate
- 5.30%
- Cash-on-cash
- -3.53%
- DSCR
- 0.84
- GRM
- 6.6
CMA / ARV
No comps found within radius.
Projected returns pro-forma
-2.01% appreciation · 0.0% rent growth · sell at horizon
- IRR
- -19.9%
- Equity multiple
- 0.26×
- Total profit
- $-34,095
- Equity at exit
- $31,912
- IRR
- -21.3%
- Equity multiple
- -0.22×
- Total profit
- $-56,391
- Equity at exit
- $27,181
Cash invested: $46,144 (down + closing). Projections, not guarantees.
Landlord ↔ Tenant lean methodology
- Overall (STATE)
- 87 Strongly Landlord-Friendly
- State Florida
- 87 Strongly Landlord-Friendly · R+3
- County
- — inherits STATE
- City
- — inherits STATE
ZIP-level market 33027
- Home prices YoY
- -0.6%
- Rents YoY
- -0.2%
- Active inventory
- 549
- Price-to-rent
- 6.6×
Monthly cashflow live
- Estimated rent
- $2,067 high interval (Pro) →
- Mortgage (P&I)
- −$864
- Tax est. 1.5%
- −$206 /mo · $2,472/yr
- Insurance
- −$69
- HOA
- −$630
- Vacancy / Maint / Mgmt
- −$434
- Net cashflow
- $-136
Break-even live
Sensitivity live
| Price | -10% $-22 | -5% $-79 | +0% $-136 | +5% $-193 | +10% $-250 |
|---|---|---|---|---|---|
| Rent | -10% $-299 | -5% $-217 | +0% $-136 | +5% $-54 | +10% $28 |
| Rate | -1.0pp $-53 | -0.5pp $-94 | base $-136 | +0.5pp $-179 | +1.0pp $-222 |
UW: 25.0% down · 7.5% · 30yr · 1.5% tax · 5.0% vac · 8.0% maint · 8.0% mgmt
Financing live
Cash to close
- Down payment
- $41,200
- Closing costs
- $4,944
- Reserves months
- —
- Total cash needed
- —
Loan-product check · same deal, 3 products live
Conventional
25% down · 7.5% · 30yr
- Down + closing
- —
- Monthly P&I
- —
- Monthly cashflow
- —
- DSCR
- —
- Eligible?
- —
Personal DTI + credit; lowest rate.
DSCR
20% down · 8.5% · 30yr
- Down + closing
- —
- Monthly P&I
- —
- Monthly cashflow
- —
- DSCR
- —
- Eligible?
- —
No personal income docs; deal must DSCR.
Hard money
10% down · 12.0% · 12mo
- Down + closing
- —
- Monthly P&I
- —
- Monthly cashflow
- —
- DSCR
- —
- Eligible?
- —
Short-term bridge; refi at stabilization.
Rent comps 40 comps
| Address | Beds | Baths | Sqft | Rent | $/sqft | DOM | Units | Dist |
|---|---|---|---|---|---|---|---|---|
| 1551 SW 135th Ter Pembroke Pines, FL | 1.0–2.0 | 1.5 | 752 | $1,650 | $2.19 | 15d | 2 | 0.12mi |
| 13701 SW 12th St Apt 103A Pembroke Pines, FL | 2.0 | 2.0 | 1207 | $2,500 | $2.07 | 4d | 1 | 0.15mi |
| 13455 SW 16th Ct Unit 306-F Pembroke Pines, FL | 2.0 | 1.5 | 936 | $2,000 | $2.14 | 20d | 1 | 0.17mi |
| 1401 SW 134th Way Unit C314 Pembroke Pines, FL | 2.0 | 2.0 | 1044 | $2,700 | $2.59 | 26d | 1 | 0.18mi |
| 1351 SW 141st Ave Unit 213G Pembroke Pines, FL | 2.0 | 2.0 | 1207 | $1,800 | $1.49 | 19d | 1 | 0.18mi |
| 1501 SW 134th Way Unit D304 Pembroke Pines, FL | 2.0 | 2.0 | 1192 | $2,395 | $2.01 | 26d | 1 | 0.20mi |
| 1001 SW 141st Ave Unit 311K Pembroke Pines, FL | 1.0 | 1.5 | 1056 | $1,900 | $1.80 | 6d | 1 | 0.28mi |
| 900 SW 142nd Ave Pembroke Pines, FL | 2.0 | 2.0 | 1207 | $2,200 | $1.82 | 3d | 2 | 0.33mi |
| 900 SW 142nd Ave Unit 202L Pembroke Pines, FL | 2.0 | 2.0 | 1207 | $2,300 | $1.91 | 9d | 1 | 0.33mi |
| 13455 SW 9th Ct Pembroke Pines, FL | 1.0 | 1.5 | 811 | $1,685 | $2.08 | 24d | 2 | 0.38mi |
| 850 SW 138th Ave Pembroke Pines, FL | 1.0–2.0 | 1.5–2.0 | 1120 | $2,200 | $1.96 | 24d | 2 | 0.41mi |
| 13355 SW 9th Ct Unit 317H Pembroke Pines, FL | 2.0 | 2.0 | 1044 | $1,975 | $1.89 | 7d | 1 | 0.43mi |
| 850 SW 133rd Ter Pembroke Pines, FL | 2.0 | 1.5 | 953 | $1,938 | $2.03 | 3d | 2 | 0.45mi |
| 850 SW 133rd Ter Pembroke Pines, FL | 2.0 | 1.5 | 953 | $1,938 | $2.03 | 22d | 2 | 0.45mi |
| 850 SW 133rd Ter Unit 106B Pembroke Pines, FL | 2.0 | 1.5 | 953 | $1,975 | $2.07 | 24d | 1 | 0.45mi |
| 850 SW 133rd Ter Unit B406 Pembroke Pines, FL | 2.0 | 1.5 | 953 | $1,900 | $1.99 | 26d | 1 | 0.45mi |
| 801 SW 133rd Ter Unit 401K Pembroke Pines, FL | 1.0 | 1.0 | 960 | $1,850 | $1.93 | 26d | 1 | 0.46mi |
| 701 SW 141st Ave Unit 110R Pembroke Pines, FL | 2.0 | 1.5 | 1032 | $2,200 | $2.13 | 26d | 1 | 0.47mi |
| 701 SW 141st Ave Unit 405R Pembroke Pines, FL | 2.0 | 1.5 | 1032 | $2,000 | $1.94 | 26d | 1 | 0.47mi |
| 701 SW 141st Ave Unit 110R Pembroke Pines, FL | 2.0 | 1.5 | 1032 | $2,200 | $2.13 | 9d | 1 | 0.47mi |
| 915 SW 143rd Ave #2008 Pembroke Pines, FL | 2.0 | 2.5 | 1100 | $2,400 | $2.18 | 4d | 1 | 0.48mi |
| 13255 SW 9th Ct Unit 402G Pembroke Pines, FL | 2.0 | 2.0 | 1044 | $1,800 | $1.72 | 26d | 1 | 0.49mi |
| 301 SW 135th Ave Unit 415C Pembroke Pines, FL | 1.0 | 1.5 | 811 | $1,650 | $2.03 | 0d | 1 | 0.50mi |
| 301 SW 135th Ave Unit 415C Pembroke Pines, FL | 1.0 | 1.5 | 811 | $1,650 | $2.03 | 24d | 1 | 0.50mi |
| 13255 SW 9th Ct Unit 202G Pembroke Pines, FL | 2.0 | 2.0 | 1044 | $1,790 | $1.71 | 19d | 1 | 0.50mi |
| 13055 SW 15th Ct Pembroke Pines, FL | 1.0–2.0 | 1.5–2.0 | 1011 | $1,750 | $1.73 | 7d | 2 | 0.51mi |
| 13055 SW 15th Ct Pembroke Pines, FL | 1.0–2.0 | 1.5–2.0 | 1011 | $1,750 | $1.73 | 26d | 2 | 0.51mi |
| 13250 SW 7th Ct Unit 402L Pembroke Pines, FL | 2.0 | 2.0 | 1044 | $1,750 | $1.68 | 16d | 1 | 0.52mi |
| 13250 SW 7th Ct Unit 402L Pembroke Pines, FL | 2.0 | 2.0 | 1044 | $1,750 | $1.68 | 4d | 1 | 0.52mi |
| 800 SW 131st Ave Unit 311F Pembroke Pines, FL | 1.0 | 1.5 | 811 | $1,800 | $2.22 | 26d | 1 | 0.56mi |
| 551 SW 135th Ave Unit 405B Pembroke Pines, FL | 2.0 | 1.5 | 953 | $1,700 | $1.78 | 26d | 1 | 0.57mi |
| 13255 SW 7th Ct Unit 406D Pembroke Pines, FL | 2.0 | 1.5 | 953 | $1,850 | $1.94 | 9d | 1 | 0.57mi |
| 13255 SW 7th Ct Unit 305D Pembroke Pines, FL | 2.0 | 1.5 | 953 | $1,850 | $1.94 | 26d | 1 | 0.57mi |
| 13255 SW 7th Ct Pembroke Pines, FL | 2.0 | 1.5 | 953 | $1,825 | $1.92 | 0d | 2 | 0.58mi |
| 550 SW 138th Ave Unit 206K Pembroke Pines, FL | 2.0 | 2.0 | 1207 | $2,400 | $1.99 | 16d | 1 | 0.59mi |
| 13155 SW 7th Ct Unit 402E Pembroke Pines, FL | 2.0 | 2.0 | 1044 | $2,000 | $1.92 | 26d | 1 | 0.61mi |
| 1300 SW 130th Ave Pembroke Pines, FL | 1.0–2.0 | 1.0–2.0 | 885 | $1,700 | $1.92 | 26d | 2 | 0.65mi |
| 500 SW 145th Ave Pembroke Pines, FL | 1.0–3.0 | 1.0–2.0 | 1044 | $2,341 | $2.24 | 0d | 20 | 0.65mi |
| 400 SW 134th Way Pembroke Pines, FL | 1.0–2.0 | 1.5–2.0 | 927 | $1,700 | $1.83 | 12d | 2 | 0.70mi |
| 400 SW 134th Way Pembroke Pines, FL | 1.0–2.0 | 1.5–2.0 | 927 | $1,475 | $1.59 | 26d | 3 | 0.70mi |
HOA detail condo
- Monthly dues
- $630 · $7,560/yr
- Likely covers
- gym
- Assessments
- None detected in remarks — confirm with the listing agent.
Listing history 22 events
-
2026-06-21days on market $164,800 Active 102 DOM
-
2026-06-18days on market $164,800 Active 99 DOM
-
2026-06-17days on market $164,800 Active 98 DOM
-
2026-06-16days on market $164,800 Active 97 DOM
-
2026-06-15days on market $164,800 Active 96 DOM
-
2026-06-13days on market $164,800 Active 94 DOM
-
2026-06-09days on market $164,800 Active 90 DOM
-
2026-06-08days on market $164,800 Active 89 DOM
-
2026-06-07days on market $164,800 Active 88 DOM
-
2026-06-04days on market $164,800 Active 85 DOM
-
2026-06-03days on market $164,800 Active 84 DOM
-
2026-06-02days on market $164,800 Active 83 DOM
-
2026-06-01days on market $164,800 Active 82 DOM
-
2026-05-31days on market $164,800 Active 81 DOM
-
2026-04-07price $164,800
-
2026-02-17$167,500 Active
-
2026-01-31historical
-
2025-07-04price $200,000
-
2025-05-13historical
-
2025-04-21$219,900 Active
-
2024-09-21price $229,327
-
2024-08-14$253,327 Active
ⓘ Source: listings_history table (triggers on properties + properties_extension) + one-shot
backfill from property_details.listing_events for pre-trigger history.
Climate risk First Street
- Flood 6/10 Major FEMA zone X (shaded) · 75% chance over 30 yrs
- Wildfire 1/10 Low
- Heat 10/10 Extreme 7 d/yr ≥106°F today · 28 d/yr by 30 yrs out
- Wind 10/10 Extreme 99% chance of damaging wind over 30 yrs
- Air quality 2/10 Low 2 unhealthy d/yr today · 2 by 30 yrs out
Nearby sold comps map
Loading sold comps map…
Walkable amenities ~0.75 mi
Loading nearby amenities…
Taxation est. · year 1
- Rental income
- $24,806
- − Mortgage interest
- −$9,231
- − Property taxes
- −$2,472
- − Insurance
- −$824
- − Repairs & maintenance
- −$1,985
- − Management
- −$1,985
- − HOA
- −$7,560
- − Depreciation
- −$4,794
- Taxable loss
- −$4,044
- Est. tax savings @ 24.0%
- +$971
- After-tax cash flow
- $-659/yr
For passive investors: Depreciation is non-cash, so a rental often shows a tax loss while cash-flowing — sheltering income. Rental losses are passive: they offset passive income freely, and up to $25,000/yr can offset ordinary (W-2) income if you actively participate and your MAGI is under $100k (phasing out to $0 by $150k); unused losses carry forward. On sale, claimed depreciation is recaptured at up to 25%, and gains may owe capital-gains tax (a 1031 exchange can defer both). Figures are a year-1 estimate at your 24.0% rate — not tax advice; consult a CPA.
Schools (NCES district)
- District
- Broward
- NCES district ID
- 1200180
- Math proficiency
- 42% ▼ -18.00%
- Reading proficiency
- 53% ▼ -5.00%
- Median HH income
- $52,139
- Composite
- 40.88/100
- National rank
- #3621
- State rank
- #46 of 73 in FL
Livability — Pembroke Pines
- Score
- 83/100
- State rank
- #54
- US rank
- #933
Category grades
Schools grade is shown separately in the Schools card above.
Census & demographics
- Census place
- Pembroke Pines, FL
- County
- Broward County · 1,963,430 people
- City population
- 180,224
- Metro
- Miami-Fort Lauderdale-Pompano Beach, FL
- Population (ZIP)
- 65,116
- Household income
- $76,561
- Rent vs Own
- Severe rent burden
- 1728.0
Population outlook (Broward County) Hauer SSP2
- Today (2025)
- 2,207,033 people
- By 2030
- 2,360,704 · +7.0%
- By 2040
- 2,661,208 · +20.6%
- By 2050
- 2,946,698 · +33.5%
- By 2075
- 3,602,273 · +63.2%
- By 2100
- 3,970,984 · +79.9%
Race, ethnicity, and origin ACS 2023
- Neighborhood character
- Diverse neighborhood (Simpson 0.65)
- Race & ethnicity
- Hispanic / Latino 52% Two or more races 23% Black 22% White 16% Asian 6%
- Hispanic origin (detail)
- Puerto Rican 6% Cuban 19% Dominican 3%
- Common ancestry
- Hispanic 6% Romanian 1% Scotch-Irish 1%
- Foreign-born
- 47% · Canada, Jamaica, Vietnam
- Languages at home
- 40% English-only · Spanish 47% French/Haitian/Cajun 5% Other Indo-European 2%
Political lean MEDSL · Broward
- 2024 margin
- D (+17.0) · D 58.0% · R 41.0%
- 2008→2024 swing
- -17.8pp toward R · 2008: 34.7pp · 2024: 17.0pp
- All cycles
- 2024: D+17.0 2020: D+29.8 2016: D+35.0 2012: D+34.9 2008: D+34.7
Not yet ingested
- Civics
- —
Market trends
- HPI YoY
- ▼ -2.01%
- Current HPI
- 359.5973
- Rent YoY
- ▼ -0.20%
- Metro
- Miami-Fort Lauderdale-Pompano Beach, FL
- State GDP YoY
- ▲ 3.28%
- F500 in state
- 36
Industry mix (Fortune 500 HQ in FL)
| Industry | F500 HQs | Revenue |
|---|---|---|
| Industrial Technology | 2 | $29B |
|
||
| Insurance | 2 | $17B |
|
||
| Retail | 1 | $60B |
|
||
| Technology Distribution | 1 | $58B |
|
||
| Homebuilding | 1 | $35B |
|
||
| Technology Manufacturing | 1 | $35B |
|
||
Price history
-34.9% since first listed8 events — show timeline
- 2026-04-07 Price Changed $164,800 Beaches MLS
- 2026-02-17 Listed $167,500 Beaches MLS
- 2026-01-31 Listing Removed — MARMLS
- 2025-07-04 Price Changed $200,000 MARMLS
- 2025-05-13 Listing Removed — MARMLS
- 2025-04-21 Listed $219,900 MARMLS
- 2024-09-21 Price Changed $229,327 MARMLS
- 2024-08-14 Listed $253,327 MARMLS
Cash-flow waterfall
monthlySold comps — $/sqft
last 12 mo · ≤1 miLoading sold comps…