 Multi-family
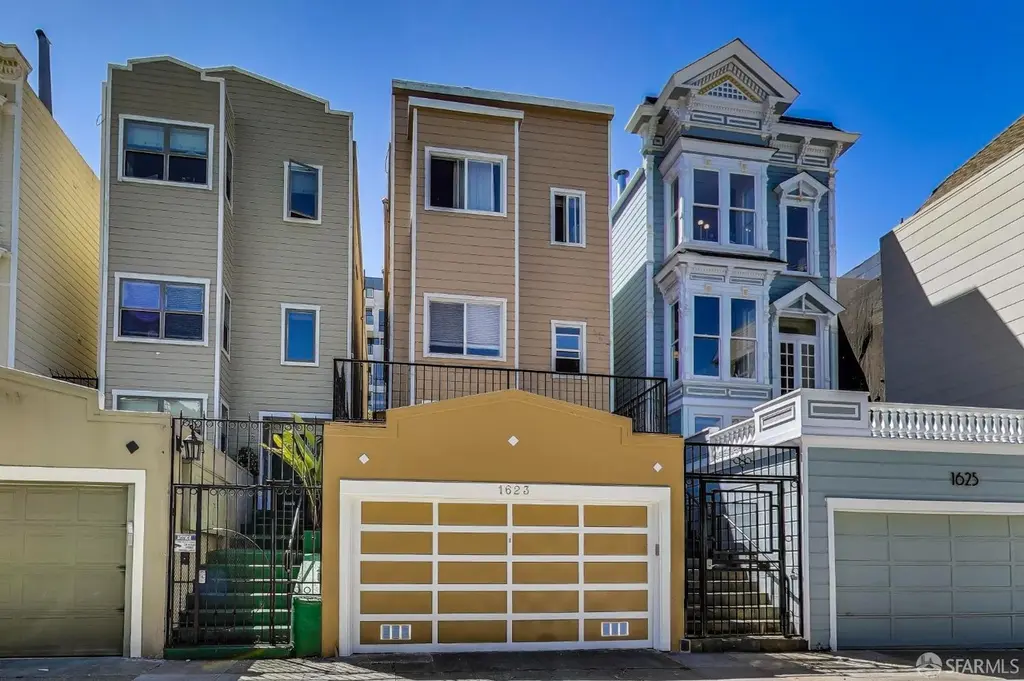
1623 Vallejo St · San Francisco, CA
Flood risk 1/10 · Minimal
- FEMA flood zone
- X (unshaded)
- Chance of flooding over 30 yrs
- 0.0%
- Est. flood insurance / yr
- $507 – $1,088
Fire risk 1/10 · Minimal
- Est. fire insurance / yr
- $659 – $1,223
Heat risk 2/10 · Minimal
- Hot days now (above 79°F)
- 8 days/yr
- Hot days in 30 yrs
- 17 days/yr
Wind risk 1/10 · Minimal
- Chance of severe wind over 30 yrs
- —
Air-quality risk 8/10 · Major
- Unhealthy air days now
- 15 days/yr
- Unhealthy air days in 30 yrs
- 15 days/yr
Risk factors via First Street. Map © Google.
Why this score? — see what drove the D+ grade
The composite is a weighted blend of 9 inputs, each scored 0–100. Each bar is that input's sub-score; the figure is the points it added to the 100-point composite (weight × sub-score).
- Cash flow +14.8/30.0
- Appreciation +9.1/10.0
- Rent growth +5.0/5.0
- Schools +5.0/10.0
- DSCR +4.5/10.0
- Livability +3.8/5.0
- 1% rule +3.4/10.0
- Condition / age +2.5/5.0
- ARV discount +0.0/15.0
$2,799,000
🖨 Deal sheet 📄 Offer letter ✓ Due diligence
Multi-family units
County records classify this as Multi-Family (5+ Unit). Listing-text estimate: 1 unit. estimate disagrees with records
5+ unit building — per-unit beds/baths from public records are typically unavailable; the breakdown below (if shown) is an estimate from the listing text.
Listing remarks
1623 Vallejo Street, a prime property located in the heart of San Francisco's prestigious Pacific Heights neighborhood. This property features four distinct units, offering great investment potential. One unit features 2 bedrooms, 2.5 baths, and an updated kitchen with modern appliances. Fireplace & hardwood floors. Enjoy direct access to a private backyard with a BBQ area, perfect for entertaining. 3-1BR/1Ba Units: Ideal for tenants, these units provide a cozy living environment in a vibrant and desirable area. Additional space in the basement is perfect for storage and can be used as a private office/Gym, offering flexibility for various needs. Large patio in the front. This propert
Key facts
- Private backyard
- Modern appliances
- Distinct units
Tags
Property features AI
Finance
- Financial info: Four-unit building with all 4 units currently leased; Unit mix includes three 1-bedroom units and one 2-bedroom unit
- HOA & community: No association fee
Exterior
- Parking: Attached side-by-side garage for 2 cars; Total 2 parking spaces (covered)
- Utilities: City utilities; Electricity available with separate meters; Natural gas connected; Public water; Public sewer
- Home design: Residential income property (Quadruplex); Three or more levels; Built in 1900
- Construction: Wood construction; Asphalt roof; Concrete foundation
- Exterior features: Balcony/Deck; Landscaped lot
Interior
- Kitchen: Dishwasher; Free-standing gas range; Free-standing refrigerator; Gas water heater
- Bedrooms: Five bedrooms
- Flooring: Wood floors
- Bathrooms: Five bathrooms (4 full, 1 partial)
- Heating & cooling: Gas heating; Fireplace(s)
- Interior features: Fireplace(s); Gas heating (natural gas)
- Laundry & utility: Common area laundry
Neighborhood map
What this means for you Summary
Snapshot
- This is a 5-bed/4.0-bath multifamily listed at $2.80M.
Deal economics
- At list price, monthly cash flow is $777 ($9k/yr) — positive.
- The deal already cash-flows at list — no discount required.
- To meet the 1% rule (rent ≥ 1% of price), the offer needs to be $2.34M (16.5% below list).
- Recommended offer: $2.34M (16.5% below list) — sets the bar for 1% rule.
- Cap rate 6.6% vs local median 2.1% in San Francisco — top-decile yield for the area; either an underpriced asset or a hidden risk that comps aren't pricing in. Stress-test before assuming the spread holds.
Location & tenants
- Location reads 76/100 on livability (#90 in CA, #3,143 nationally) — a middle-class / working-renter tenant base. Strengths: amenities A+, commute A+, employment A+; Watch: crime F, cost of living F.
- San Francisco Unified (urban): math 50% / reading 56% proficiency, ranked #322 of 1,400 in CA (top 23%) — acceptable for families but not a draw, mixed tenant base, ~2y average lease.
- Market conditions: Rents rising fast (+19.2%/yr); 59 active listings in the ZIP; 2 comparable units currently listed for rent nearby; high-income renter base; 750 units permitted in San Francisco County in 2024 (688 in 5+ unit buildings).
- At $23,373/mo this rent would consume 128% of the median local household income ($219k/yr) (locally 883% of renters already pay >50% of income on rent) — very limited rent-growth headroom before tenants either downsize or default.
Forward outlook
- In year one you build about $248k of equity ($19k loan paydown + $229k appreciation (8.2% local appreciation)).
- San Francisco County population projected at +39% by 2050 — long-run rental-demand tailwind backs the buy-and-hold thesis.
- At projected returns (8.2% appreciation + 8.0% rent growth), your $784k cash investment doubles in ~3 years — after that, you're playing with house money.
- By year 2, paydown + projected appreciation supports a ~$398k cash-out refi (75% LTV) — recoverable capital for the next deal without selling this one.
Negotiation context
- It's been on market 301 days — a 12% lower offer ($2.46M) is reasonable based on typical stale-listing flexibility.
- 2 sale attempts; this cycle's ask is 87% above the opening price — seller raised mid-cycle; expect resistance to lowballs.
- Current owner paid $1.18M; list at $2.80M implies a 137% gain — meaningful room to come down on a strong offer.
Risks & watch-outs
- Watch-outs: built in 1900 — expect roof / HVAC / electrical / plumbing capex.
Questions for the listing agent
- It's been on market 301 days. Have you received any prior offers? Is the seller open to a 16% concession, seller financing, or rate buy-down credit?
- Built in 1900 — when were the roof, HVAC, electrical panel, plumbing, and water heater last replaced?
- Why hasn't it sold? Are there any deal-killer items the seller is aware of (foundation, flood, title, zoning, code violations)?
- Is there a deadline driving the sale (1031 exchange, divorce, estate, relocation)? That informs how much negotiation room exists.
- Schools are B-rated — typically a magnet for longer-tenancy family renters. What's the average tenant stay here, and is there a school-zone premium baked into asking?
- Crime grade is F in this area — have there been break-ins, vandalism, or insurance claims at this property in the last 3 years? What carrier currently insures it and at what premium?
- The area grade is low — what's the realistic commute time and amenity access for the typical tenant pool here? Any planned neighborhood developments (good or bad) we should know about?
- What's the average days-on-market for RENTAL listings here right now (not sales)? A rising rental-DOM trend means longer vacancies and softer asking-rent achievability than the comps imply.
- What's the recent tenant-quality profile in this submarket — average credit score on applications, eviction rate, late-payment / NSF rate, and stable-employment percentage? A property-management company in the area should have these aggregated.
- How much new apartment / multifamily construction is in the pipeline within 1–3 miles? Heavy new supply (>2% of stock underway) typically softens rents 12–24 months out; light construction supports rent growth.
Investment metrics
- 1% rule
- 0.84% ✗
- Cap rate
- 6.63%
- Cash-on-cash
- 1.19%
- DSCR
- 1.05
- GRM
- 10.0
CMA / ARV
- ARV (on-the-fly)
- $2,279,805
- Comps found
- 12
Show comp detail 12 sales within ~0.75 mi
| Address | Dist | Beds/Ba | Sqft | Sold | Price | $/sf | Match |
|---|---|---|---|---|---|---|---|
| 1531 Filbert St | 0.20mi | 4/4.0 (-1) | 3,680 (-1%) | 1mo | $2,025,000 | $550 | 84 |
| 1325-1327 Vallejo St | 0.31mi | 5/3.0 | 3,660 (-1%) | 15mo | $2,699,000 | $737 | 67 |
| 2209 Gough St | 0.20mi | 5/— | 3,489 (-6%) | 18mo | $2,950,000 | $846 | 66 |
| 1358-1360 Union St | 0.25mi | 5/— | 3,333 (-10%) | 9mo | $3,550,000 | $1,065 | 64 |
| 2512-2516 Sacramento St | 0.69mi | 4/— (-1) | 3,700 (-0%) | 1mo | $3,275,000 | $885 | 61 |
| 2749 Gough St | 0.23mi | 6/4.0 (+1) | 3,514 (-5%) | 18mo | $1,870,000 | $532 | 60 |
| 1272-1276 Sacramento St | 0.65mi | 6/3.0 (+1) | 3,765 (+2%) | 3mo | $2,200,000 | $584 | 56 |
| 3130 Octavia St | 0.43mi | 6/4.0 (+1) | 4,210 (+14%) | 1mo | $2,375,000 | $564 | 52 |
| 1230 Broadway St | 0.40mi | 6/— (+1) | 3,980 (+7%) | 16mo | $1,625,000 | $408 | 51 |
| 1341-1343 Green St | 0.22mi | 4/3.0 (-1) | 4,222 (+14%) | 13mo | $2,595,000 | $615 | 47 |
| 837-839 Filbert St | 0.69mi | 6/2.0 (+1) | 3,666 (-1%) | 10mo | $2,090,000 | $570 | 45 |
| 1015 Francisco St | 0.51mi | 5/4.0 | 4,258 (+15%) | 19mo | $3,850,000 | $904 | 35 |
Match score weights: distance 35% · size 25% · config 20% · recency 20%. Top-matched comps best support the ARV.
Projected returns pro-forma
8.18% appreciation · 8.0% rent growth · sell at horizon
- IRR
- 23.1%
- Equity multiple
- 2.73×
- Total profit
- $1,357,073
- Equity at exit
- $2,160,204
- IRR
- 22.5%
- Equity multiple
- 6.37×
- Total profit
- $4,212,167
- Equity at exit
- $4,320,556
Cash invested: $783,720 (down + closing). Projections, not guarantees.
Landlord ↔ Tenant lean methodology
- Overall (CITY)
- 0 Strongly Tenant-Friendly
- State California
- 18 Strongly Tenant-Friendly · D+13
- County
- — inherits STATE
- City San Francisco
- 0 Strongly Tenant-Friendly · D+57
ZIP-level market 94123
- Home prices YoY
- 4.0%
- Rents YoY
- 19.2%
- Active inventory
- 59
- Price-to-rent
- 37.9×
Monthly cashflow live
- Estimated rent
- $23,373 high interval (Pro) →
- Mortgage (P&I)
- −$14,678
- Tax from tax record
- −$1,843 /mo · $22,119/yr
- Insurance
- −$1,166
- HOA
- −$0
- Vacancy / Maint / Mgmt
- −$4,908
- Net cashflow
- $777
Break-even live
4-unit breakdown (identical units grouped — click to expand)
| Units | Beds | Baths | Est. rent |
|---|---|---|---|
| 1× unit | 2 | 2.5 | $6,151 |
| 3× units | 1 | 1 | $17,223 |
| #2 | 1 | 1 | $5,741 |
| #3 | 1 | 1 | $5,741 |
| #4 | 1 | 1 | $5,741 |
| Total (4 units) | $23,373 | ||
UW: 25.0% down · 7.5% · 30yr · 1.5% tax · 5.0% vac · 8.0% maint · 8.0% mgmt
Financing live
Cash to close
- Down payment
- $699,750
- Closing costs
- $83,970
- Reserves months
- —
- Total cash needed
- —
Loan-product check · same deal, 3 products live
Conventional
25% down · 7.5% · 30yr
- Down + closing
- —
- Monthly P&I
- —
- Monthly cashflow
- —
- DSCR
- —
- Eligible?
- —
Personal DTI + credit; lowest rate.
DSCR
20% down · 8.5% · 30yr
- Down + closing
- —
- Monthly P&I
- —
- Monthly cashflow
- —
- DSCR
- —
- Eligible?
- —
No personal income docs; deal must DSCR.
Hard money
10% down · 12.0% · 12mo
- Down + closing
- —
- Monthly P&I
- —
- Monthly cashflow
- —
- DSCR
- —
- Eligible?
- —
Short-term bridge; refi at stabilization.
Rent comps 2 comps
| Address | Beds | Baths | Sqft | Rent | $/sqft | DOM | Units | Dist |
|---|---|---|---|---|---|---|---|---|
| — San Francisco, CA | 5.0 | 4.5 | 3100 | $29,990 | $9.67 | 7d | 1 | 0.59mi |
| 2577 Post St San Francisco, CA | 4.0 | 3.0 | 2754 | $15,000 | $5.45 | 3d | 1 | 1.35mi |
Listing history 19 events
-
2026-06-18days on market $2,799,000 Active 301 DOM
-
2026-06-17days on market $2,799,000 Active 300 DOM
-
2026-06-16days on market $2,799,000 Active 299 DOM
-
2026-06-15days on market $2,799,000 Active 298 DOM
-
2026-06-13days on market $2,799,000 Active 296 DOM
-
2026-06-13days on market $2,799,000 Active 295 DOM
-
2026-06-09days on market $2,799,000 Active 292 DOM
-
2026-06-08days on market $2,799,000 Active 291 DOM
-
2026-06-07days on market $2,799,000 Active 290 DOM
-
2026-06-04days on market $2,799,000 Active 287 DOM
-
2026-06-03days on market $2,799,000 Active 286 DOM
-
2026-06-02days on market $2,799,000 Active 285 DOM
-
2026-06-01days on market $2,799,000 Active 284 DOM
-
2026-05-31days on market $2,799,000 Active 283 DOM
-
2025-12-06price $2,799,000
-
2025-11-23$1,495,000 Active
-
2025-10-08price $2,950,000
-
2025-08-21$3,680,000 Active
-
2003-08-11soldstatus $1,180,000
ⓘ Source: listings_history table (triggers on properties + properties_extension) + one-shot
backfill from property_details.listing_events for pre-trigger history.
Tax reassessment forecast CA · Resets to sale price
- Current annual tax
- $22,119 · $1,843/mo
- Projected year-2 tax
- $22,119 · $1,843/mo
- Expected delta
- $0/yr ($0/mo · -0.0%)
ⓘ Screening estimate from a state-policy table — verify with the county assessor before closing.
Climate risk First Street
- Flood 1/10 Low FEMA zone X (unshaded) · 0% chance over 30 yrs
- Wildfire 1/10 Low
- Heat 2/10 Low 8 d/yr ≥79°F today · 17 d/yr by 30 yrs out
- Wind 1/10 Low
- Air quality 8/10 Severe 15 unhealthy d/yr today · 15 by 30 yrs out
Nearby sold comps map
Loading sold comps map…
Walkable amenities ~0.75 mi
Loading nearby amenities…
Taxation est. · year 1
- Rental income
- $280,476
- − Mortgage interest
- −$156,788
- − Property taxes
- −$22,119
- − Insurance
- −$13,995
- − Repairs & maintenance
- −$22,438
- − Management
- −$22,438
- − Depreciation
- −$81,425
- Taxable loss
- −$38,727
- Est. tax savings @ 24.0%
- +$9,294
- After-tax cash flow
- $18,618/yr
For passive investors: Depreciation is non-cash, so a rental often shows a tax loss while cash-flowing — sheltering income. Rental losses are passive: they offset passive income freely, and up to $25,000/yr can offset ordinary (W-2) income if you actively participate and your MAGI is under $100k (phasing out to $0 by $150k); unused losses carry forward. On sale, claimed depreciation is recaptured at up to 25%, and gains may owe capital-gains tax (a 1031 exchange can defer both). Figures are a year-1 estimate at your 24.0% rate — not tax advice; consult a CPA.
Schools (NCES district)
- District
- San Francisco Unified
- NCES district ID
- 0634410
- Math proficiency
- 50% ▬ 0.00%
- Reading proficiency
- 56% ▲ 1.00%
- Median HH income
- $81,249
- Composite
- 50.14/100
- National rank
- #4088
- State rank
- #322 of 1400 in CA
Livability — San Francisco
- Score
- 76/100
- State rank
- #90
- US rank
- #3143
Category grades
Schools grade is shown separately in the Schools card above.
Census & demographics
- Census place
- San Francisco, CA
- County
- San Francisco County · 827,552 people
- City population
- 827,552
- Metro
- San Francisco-Oakland-Berkeley, CA
- Population (ZIP)
- 24,054
- Household income
- $218,603
- Rent vs Own
- Severe rent burden
- 883.0
Population outlook (San Francisco County) Hauer SSP2
- Today (2025)
- 1,030,936 people
- By 2030
- 1,110,409 · +7.7%
- By 2040
- 1,270,010 · +23.2%
- By 2050
- 1,435,001 · +39.2%
- By 2075
- 1,779,074 · +72.6%
- By 2100
- 1,966,767 · +90.8%
Race, ethnicity, and origin ACS 2023
- Neighborhood character
- Predominantly White (73%)
- Race & ethnicity
- White 73% Asian 11% Two or more races 11% Hispanic / Latino 9%
- Hispanic origin (detail)
- Mexican 3% Salvadoran 1%
- Common ancestry
- Scotch-Irish 4% Italian 4% Lithuanian 3%
- Foreign-born
- 17% · Canada, China, Dominican Republic
- Languages at home
- 83% English-only · Spanish 5% Other Indo-European 3% Chinese 3%
Political lean MEDSL · San Francisco
- 2024 margin
- Solid D (+64.8) · D 80.3% · R 15.5% · Other 4.1%
- 2008→2024 swing
- -5.7pp toward R · 2008: 70.5pp · 2024: 64.8pp
- All cycles
- 2024: D+64.8 2020: D+72.5 2016: D+76.1 2012: D+70.2 2008: D+70.5
Not yet ingested
- Civics
- —
Market trends
- HPI YoY
- ▲ 8.18%
- Current HPI
- 212.9289
- Rent YoY
- ▲ 19.17%
- Metro
- San Francisco-Oakland-Berkeley, CA
- State GDP YoY
- ▲ 3.21%
- F500 in state
- 116
Industry mix (Fortune 500 HQ in CA)
| Industry | F500 HQs | Revenue |
|---|---|---|
| Technology | 27 | $1,492B |
|
||
| Financial Services | 3 | $174B |
|
||
| Retail | 3 | $44B |
|
||
| Insurance | 3 | $26B |
|
||
| Media / Entertainment | 2 | $115B |
|
||
| Pharmaceuticals / Biotech | 2 | $62B |
|
||
Price history
+137.2% since first listed5 events — show timeline
- 2025-12-06 Price Changed $2,799,000 San Francisco MLS
- 2025-11-23 Listed $1,495,000 San Francisco MLS
- 2025-10-08 Price Changed $2,950,000 San Francisco MLS
- 2025-08-21 Listed $3,680,000 San Francisco MLS
- 2003-08-11 Sold (Public Records) $1,180,000 Public Records
Property tax history
+1.9%/yrLatest (2025): $22,119 · +3.0% YoY. Source: county tax records.
Cash-flow waterfall
monthlySold comps — $/sqft
last 12 mo · ≤1 miLoading sold comps…