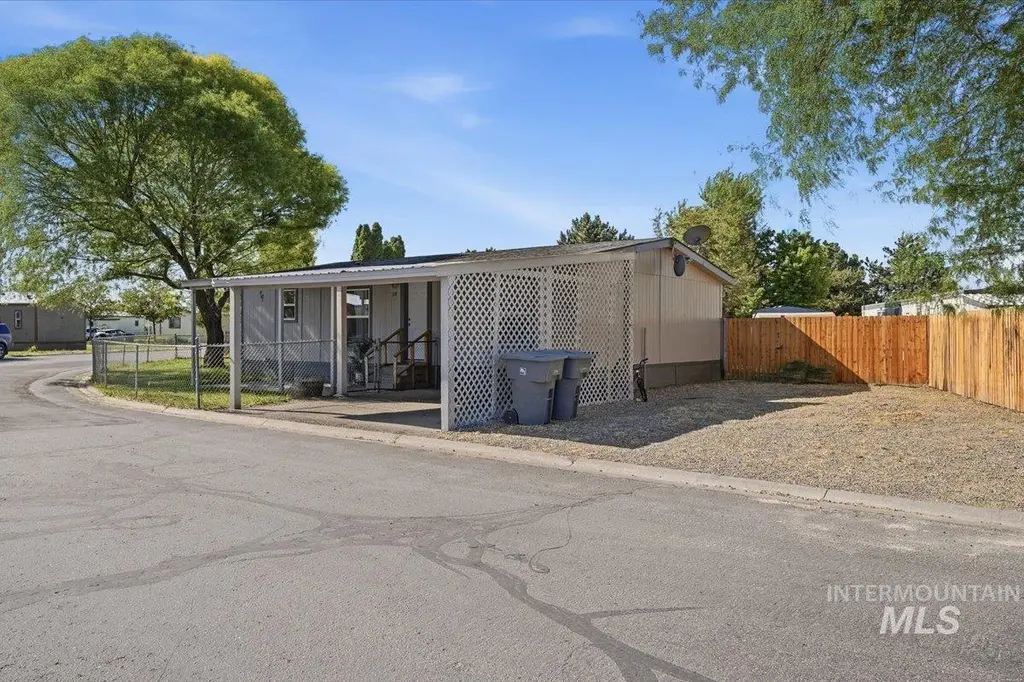
5015 E Ustick Rd 118 #118 · Caldwell, ID
Flood risk No data
- FEMA flood zone
- —
- Chance of flooding over 30 yrs
- —
- Est. flood insurance / yr
- —
Fire risk No data
- Est. fire insurance / yr
- —
Heat risk No data
- Hot days now (above threshold)
- —
- Hot days in 30 yrs
- —
Wind risk No data
- Chance of severe wind over 30 yrs
- —
Air-quality risk No data
- Unhealthy air days now
- —
- Unhealthy air days in 30 yrs
- —
Risk factors via First Street. Map © Google.
Why this score? — see what drove the C+ grade
The composite is a weighted blend of 9 inputs, each scored 0–100. Each bar is that input's sub-score; the figure is the points it added to the 100-point composite (weight × sub-score).
- Cash flow +30.0/30.0
- 1% rule +10.0/10.0
- DSCR +10.0/10.0
- Livability +3.4/5.0
- Rent growth +3.2/5.0
- Condition / age +2.5/5.0
- Schools +2.0/10.0
- ARV discount +0.0/15.0
- Appreciation +0.0/10.0
$120,000
🖨 Deal sheet 📄 Offer letter ✓ Due diligence
Listing remarks
Welcome to this 3 bed, 2 bath double wide manufactured home located in a quiet and well-maintained community. This home has been completely remodeled including both bathrooms, newer flooring, fresh paint, updated fixtures, and a clean inviting feel throughout. Enjoy the attached carport and extra parking spaces to the right of carport. Home is on a corner lot. Washer, Dryer and Fridge are included. Recent updates include the Central Air system and Furnace that were both installed in 2023. The water heater was installed in 2026. New roof was installed in 2024. Enjoy the fully fenced private yard for pets or simply relaxing. Affordable lot rent of $495 per month, this is a great opportunity f
Key facts
- Attached carport
- Completely remodeled
- Extra parking spaces
Tags
Property features AI
Finance
- Other: Homeowner tax exemption in place
- Financial info: Property is on a rented lot (mobile/manufactured home rented lot)
- HOA & community: Located in the Indian Creek Estates community
Exterior
- Parking: Two covered carport spaces
- Utilities: City water service; Sewer connected
- Home design: Mobile/Manu (manufactured) home on a rented lot; Built in 1992
- Construction: Manufactured home construction
- Exterior features: Corner lot; Located in a mobile home park
Interior
- Bedrooms: Three bedrooms, all on the main level
- Bathrooms: Two bathrooms
- Heating & cooling: No central heating; Central air conditioning
- Interior features: Central air conditioning
Neighborhood map
What this means for you Summary
Snapshot
- This is a 3-bed/2.0-bath manufactured listed at $120k.
Deal economics
- At list price, monthly cash flow is $755 ($9k/yr) — positive.
- The deal already cash-flows at list — no discount required.
- Meets the 1% rule at list price ($2k rent vs $120k).
- Recommended offer: $118k (1.5% below list) — sets the bar for market timing.
- Cap rate 13.8% vs local median 3.1% in Caldwell — top-decile yield for the area; either an underpriced asset or a hidden risk that comps aren't pricing in. Stress-test before assuming the spread holds.
Location & tenants
- Location reads 67/100 on livability (#88 in ID) — a middle-class / working-renter tenant base. Strengths: cost of living A+, housing A+; Watch: crime C-, employment D+, amenities F.
- Caldwell District (suburban): math 17% / reading 31% proficiency, ranked #90 of 92 in ID (top 98%) — low school quality limits family demand, transient renter base, plan for 1-2y turnover; 72% free/reduced lunch — lower-income household profile, screen leases tightly.
- Zoned schools: Washington Elementary School (math 12% / reading 16%, grade F, #355 of 357 statewide, top 99%, 508 students, 91% FRL); Caldwell Senior High School (math 16% / reading 38%, grade F, #131 of 169 statewide, top 77%, 1,474 students, 76% FRL).
- Market conditions: Rents rising (+2.7%/yr); 341 active listings in the ZIP; 19 comparable units currently listed for rent nearby; rentals at typical pace (median 15d on market — plan ~3-4 weeks tenant-placement turnaround); 3,620 units permitted in Canyon County in 2024 (196 in 5+ unit buildings).
- This rent runs 32% of the median local income ($68k/yr) — at the standard rent-burdened threshold; future hikes will face affordability resistance.
Forward outlook
- Local home prices are declining (-3.0%/yr); year-one equity from $830 of loan paydown is wiped out by about $4k of value loss. Plan a longer hold.
- Canyon County population projected at +41% by 2050 — long-run rental-demand tailwind backs the buy-and-hold thesis.
- At projected returns (-3.0% appreciation + 2.7% rent growth), your $34k cash investment doubles in ~5 years — after that, you're playing with house money.
Negotiation context
- It's been on market 18 days — a 2% lower offer ($118k) is reasonable based on typical stale-listing flexibility.
Questions for the listing agent
- Is there a deadline driving the sale (1031 exchange, divorce, estate, relocation)? That informs how much negotiation room exists.
- Schools are D-rated, which usually means shorter tenancies and higher turnover. Who's the typical renter profile here, and what's been the actual vacancy rate?
- What's the average days-on-market for RENTAL listings here right now (not sales)? A rising rental-DOM trend means longer vacancies and softer asking-rent achievability than the comps imply.
- What's the recent tenant-quality profile in this submarket — average credit score on applications, eviction rate, late-payment / NSF rate, and stable-employment percentage? A property-management company in the area should have these aggregated.
- How much new for-sale + rental construction is in the pipeline within 1–3 miles? Heavy new supply typically softens prices + rents 12–24 months out; constrained supply supports both.
Investment metrics
- 1% rule
- 1.54% ✓
- Cap rate
- 13.84%
- Cash-on-cash
- 26.96%
- DSCR
- 2.20
- GRM
- 5.4
CMA / ARV
- ARV (on-the-fly)
- $99,360
- Comps found
- 12
Show comp detail 12 sales within ~0.75 mi
| Address | Dist | Beds/Ba | Sqft | Sold | Price | $/sf | Match |
|---|---|---|---|---|---|---|---|
| 5015 E Ustick Rd #88 | 0.00mi | 3/1.5 | 1,077 (-0%) | 11mo | $75,000 | $70 | 88 |
| 5016 E Ustick Rd Trlr 25 | 0.32mi | 3/1.5 | 1,076 (-0%) | 6mo | $54,900 | $51 | 77 |
| 5015 E Ustick Rd #181 | 0.00mi | 2/2.0 (-1) | 924 (-14%) | 0mo | $85,000 | $92 | 70 |
| 5015 E Ustick Rd #111 | 0.00mi | 3/1.0 | 924 (-14%) | 14mo | $104,000 | $113 | 60 |
| 5015 E Ustick #164 | 0.00mi | 2/2.0 (-1) | 924 (-14%) | 14mo | $96,500 | $104 | 59 |
| 107 Lancelot Ct | 0.23mi | 2/1.0 (-1) | 937 (-13%) | 2mo | $80,000 | $85 | 57 |
| 107 Round Table Ct | 0.24mi | 3/2.0 | 1,188 (+10%) | 20mo | $115,000 | $97 | 56 |
| 5016 E Ustick Rd #11 | 0.32mi | 2/2.0 (-1) | 1,188 (+10%) | 10mo | $85,000 | $72 | 55 |
| 5015 E Ustick Rd #143 | 0.00mi | 2/1.0 (-1) | 924 (-14%) | 17mo | $94,000 | $102 | 53 |
| 200 Friar Dr | 0.23mi | 2/1.0 (-1) | 924 (-14%) | 5mo | $85,000 | $92 | 52 |
| 5016 E Ustick Rd #16 | 0.32mi | 2/1.0 (-1) | 918 (-15%) | 7mo | $85,000 | $93 | 45 |
| 3114 Arrowhead Dr | 0.72mi | 3/2.0 | 1,188 (+10%) | 6mo | $84,900 | $71 | 45 |
Match score weights: distance 35% · size 25% · config 20% · recency 20%. Top-matched comps best support the ARV.
Projected returns pro-forma
-3.0% appreciation · 2.69% rent growth · sell at horizon
- IRR
- 20.5%
- Equity multiple
- 1.83×
- Total profit
- $28,002
- Equity at exit
- $17,892
- IRR
- 28.5%
- Equity multiple
- 3.49×
- Total profit
- $83,740
- Equity at exit
- $10,375
Cash invested: $33,600 (down + closing). Projections, not guarantees.
Landlord ↔ Tenant lean methodology
- Overall (STATE)
- 91 Strongly Landlord-Friendly
- State Idaho
- 91 Strongly Landlord-Friendly · R+18
- County
- — inherits STATE
- City
- — inherits STATE
ZIP-level market 83605
- Home prices YoY
- -27.0%
- Rents YoY
- 2.7%
- Active inventory
- 341
- Price-to-rent
- 5.4×
Monthly cashflow live
- Estimated rent
- $1,845 high interval (Pro) →
- Mortgage (P&I)
- −$629
- Tax from tax record
- −$23 /mo · $279/yr
- Insurance
- −$50
- HOA
- −$0
- Vacancy / Maint / Mgmt
- −$387
- Net cashflow
- $755
Break-even live
UW: 25.0% down · 7.5% · 30yr · 1.5% tax · 5.0% vac · 8.0% maint · 8.0% mgmt
Financing live
Cash to close
- Down payment
- $30,000
- Closing costs
- $3,600
- Reserves months
- —
- Total cash needed
- —
Loan-product check · same deal, 3 products live
Conventional
25% down · 7.5% · 30yr
- Down + closing
- —
- Monthly P&I
- —
- Monthly cashflow
- —
- DSCR
- —
- Eligible?
- —
Personal DTI + credit; lowest rate.
DSCR
20% down · 8.5% · 30yr
- Down + closing
- —
- Monthly P&I
- —
- Monthly cashflow
- —
- DSCR
- —
- Eligible?
- —
No personal income docs; deal must DSCR.
Hard money
10% down · 12.0% · 12mo
- Down + closing
- —
- Monthly P&I
- —
- Monthly cashflow
- —
- DSCR
- —
- Eligible?
- —
Short-term bridge; refi at stabilization.
Rent comps 19 comps
| Address | Beds | Baths | Sqft | Rent | $/sqft | DOM | Units | Dist |
|---|---|---|---|---|---|---|---|---|
| 4209 Saylor Ln Caldwell, ID | 2.0 | 2.0 | 1040 | $1,925 | $1.85 | 21d | 1 | 0.84mi |
| 4901 Maid Jessica St Caldwell, ID | 2.0 | 1.5 | 900 | $1,450 | $1.61 | 14d | 1 | 0.85mi |
| 4203 Saylor Ln Caldwell, ID | 3.0 | 2.0 | 1249 | $2,575 | $2.06 | 11d | 1 | 0.85mi |
| 4203 Saylor Ln Unit B Caldwell, ID | 3.0 | 2.0 | 1249 | $2,199 | $1.76 | 21d | 1 | 0.85mi |
| 5218 Guitar Ln Caldwell, ID | 2.0 | 2.0 | 920 | $1,422 | $1.55 | 2d | 6 | 1.01mi |
| 3203 Village Green St Caldwell, ID | 3.0 | 2.0 | 1200 | $1,895 | $1.58 | 23d | 1 | 1.01mi |
| 3123 Village Green St Caldwell, ID | 3.0 | 2.0 | 1216 | $1,995 | $1.64 | 3d | 1 | 1.02mi |
| 3721 Pierre Ave Caldwell, ID | 3.0 | 2.0 | 1167 | $1,900 | $1.63 | 14d | 1 | 1.07mi |
| 3916 Kirby Cir Caldwell, ID | 3.0 | 2.0 | 1231 | $2,150 | $1.75 | 14d | 1 | 1.19mi |
| 3304 S Florida Ave Caldwell, ID | 3.0 | 1.0 | 1000 | $1,395 | $1.40 | 23d | 1 | 1.24mi |
| 6903 Noah Ct Caldwell, ID | 2.0 | 2.0 | 990 | $1,550 | $1.57 | 14d | 1 | 1.25mi |
| 6921 Noah Ct Caldwell, ID | 2.0 | 2.0 | 990 | $1,450 | $1.46 | 21d | 1 | 1.30mi |
| 401 Canyon Village Ln Caldwell, ID | 1.0–3.0 | 1.0–3.0 | 1161 | $2,758 | $2.38 | 3d | 31 | 1.30mi |
| 11357 Shadow Glen Dr Caldwell, ID | 3.0 | 2.0 | 1408 | $2,300 | $1.63 | 23d | 1 | 1.33mi |
| 209 Abraham Way Caldwell, ID | 2.0 | 1.0 | 840 | $1,350 | $1.61 | 23d | 1 | 1.35mi |
| 7012 Noah Dr Caldwell, ID | 2.0 | 2.0 | 940 | $1,550 | $1.65 | 21d | 1 | 1.37mi |
| 10890 Blue River Ln Nampa, ID | 1.0–2.0 | 1.0–2.5 | 832 | $1,696 | $2.04 | 3d | 8 | 1.41mi |
| 4612 Lexington Sky Ln Caldwell, ID | 2.0 | 2.0 | 985 | $1,445 | $1.47 | 2d | 1 | 1.42mi |
| 5012 Hamlet Ln Caldwell, ID | 1.0–2.0 | 1.0–1.5 | 998 | $1,550 | $1.55 | 2d | 2 | 1.49mi |
Listing history 14 events
-
2026-06-18days on market $120,000 Active 18 DOM
-
2026-06-17days on market $120,000 Active 17 DOM
-
2026-06-16days on market $120,000 Active 16 DOM
-
2026-06-15days on market $120,000 Active 15 DOM
-
2026-06-13days on market $120,000 Active 13 DOM
-
2026-06-13days on market $120,000 Active 12 DOM
-
2026-06-10days on market $120,000 Active 10 DOM
-
2026-06-09days on market $120,000 Active 9 DOM
-
2026-06-08days on market $120,000 Active 8 DOM
-
2026-06-07days on market $120,000 Active 7 DOM
-
2026-06-03days on market $120,000 Active 3 DOM
-
2026-06-03days on market $120,000 Active 2 DOM
-
2026-06-01remarks 699-char remark
-
2026-06-01$120,000 Active 1 DOM
ⓘ Source: listings_history table (triggers on properties + properties_extension) + one-shot
backfill from property_details.listing_events for pre-trigger history.
Tax reassessment forecast ID · Resets to sale price
- Current annual tax
- $279 · $23/mo
- Projected year-2 tax
- $828 · $69/mo
- Expected delta
- +$549/yr (+$46/mo · 196.9%)
ⓘ Screening estimate from a state-policy table — verify with the county assessor before closing.
Nearby sold comps map
Loading sold comps map…
Walkable amenities ~0.75 mi
Loading nearby amenities…
Taxation est. · year 1
- Rental income
- $22,136
- − Mortgage interest
- −$6,722
- − Property taxes
- −$279
- − Insurance
- −$600
- − Repairs & maintenance
- −$1,771
- − Management
- −$1,771
- − Depreciation
- −$3,491
- Taxable income
- $7,503
- Est. tax owed @ 24.0%
- −$1,801
- After-tax cash flow
- $7,256/yr
For passive investors: Depreciation is non-cash, so a rental often shows a tax loss while cash-flowing — sheltering income. Rental losses are passive: they offset passive income freely, and up to $25,000/yr can offset ordinary (W-2) income if you actively participate and your MAGI is under $100k (phasing out to $0 by $150k); unused losses carry forward. On sale, claimed depreciation is recaptured at up to 25%, and gains may owe capital-gains tax (a 1031 exchange can defer both). Figures are a year-1 estimate at your 24.0% rate — not tax advice; consult a CPA.
Schools (NCES district)
- District
- Caldwell District
- NCES district ID
- 1600510
- Math proficiency
- 17% ▼ -11.00%
- Reading proficiency
- 31% ▼ -4.00%
- Median HH income
- $36,116
- Composite
- 19.85/100
- National rank
- #8694
- State rank
- #90 of 92 in ID
Livability — Caldwell
- Score
- 67/100
- State rank
- #88
- US rank
- #10145
Category grades
Schools grade is shown separately in the Schools card above.
Census & demographics
- Census place
- Caldwell, ID
- County
- Canyon County · 235,358 people
- City population
- 76,816
- Metro
- Boise City, ID
- Population (ZIP)
- 41,325
- Household income
- $68,427
- Rent vs Own
- Severe rent burden
- 719.0
Population outlook (Canyon County) Hauer SSP2
- Today (2025)
- 248,853 people
- By 2030
- 269,596 · +8.3%
- By 2040
- 311,081 · +25.0%
- By 2050
- 350,809 · +41.0%
- By 2075
- 441,884 · +77.6%
- By 2100
- 505,641 · +103.2%
Race, ethnicity, and origin ACS 2023
- Neighborhood character
- Diverse neighborhood (Simpson 0.56)
- Race & ethnicity
- White 51% Hispanic / Latino 42% Two or more races 15% Native American 1%
- Hispanic origin (detail)
- Mexican 36%
- Common ancestry
- Lithuanian 3% Slovak 2% Italian 2%
- Foreign-born
- 13% · Canada
- Languages at home
- 71% English-only · Spanish 27% Russian/Polish/Slavic 1%
Political lean MEDSL · Canyon
- 2024 margin
- Solid R (+46.6) · D 25.4% · R 72.0% · Other 2.5%
- 2008→2024 swing
- -11.4pp toward R · 2008: -35.2pp · 2024: -46.6pp
- All cycles
- 2024: R+46.6 2020: R+39.7 2016: R+41.8 2012: R+37.1 2008: R+35.2
Not yet ingested
- Civics
- —
Market trends
- HPI YoY
- ▼ -135.47%
- Current HPI
- 366.7896
- Rent YoY
- ▲ 2.69%
- Metro
- Boise City, ID
- State GDP YoY
- ▲ 4.51%
- F500 in state
- 6
Industry mix (Fortune 500 HQ in ID)
| Industry | F500 HQs | Revenue |
|---|---|---|
| Retail | 1 | $79B |
|
||
| Technology | 1 | $25B |
|
||
| Food / Agriculture | 1 | $6B |
|
||
Price history
1 event — show timeline
- 2026-05-31 Listed $120,000 IMLS
Property tax history
-6.9%/yrLatest (2025): $279 · +4.6% YoY. Source: county tax records.
Cash-flow waterfall
monthlySold comps — $/sqft
last 12 mo · ≤1 miLoading sold comps…