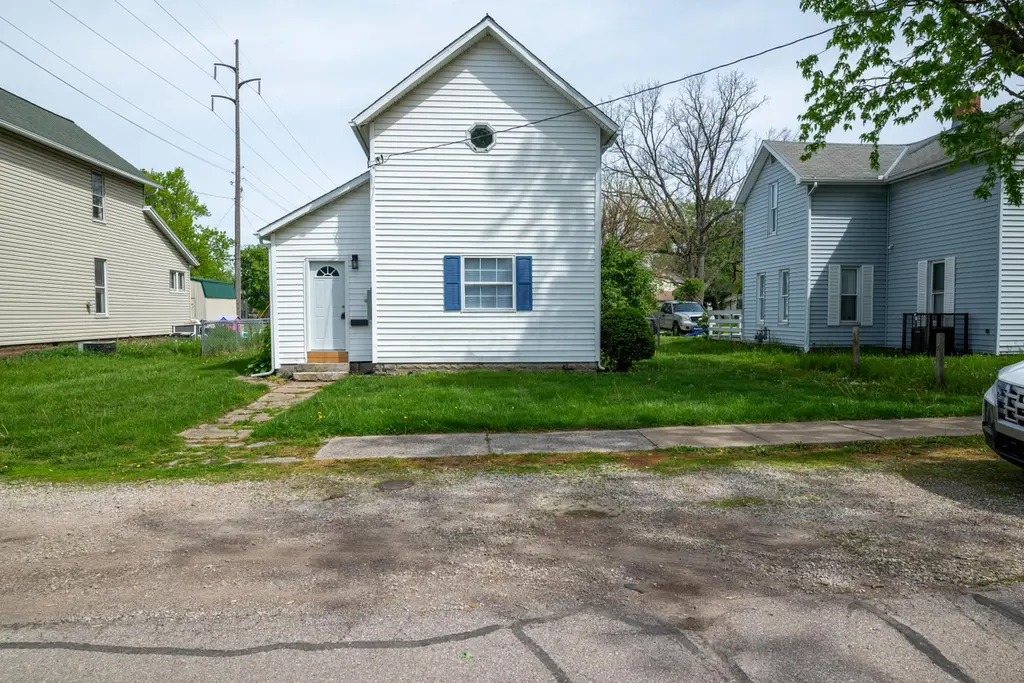
716 Herman St · Marion, OH
Flood risk 1/10 · Minimal
- FEMA flood zone
- X (unshaded)
- Chance of flooding over 30 yrs
- 0.0%
- Est. flood insurance / yr
- $507 – $1,088
Fire risk 1/10 · Minimal
- Est. fire insurance / yr
- $713 – $1,323
Heat risk 3/10 · Minor
- Hot days now (above 99°F)
- 7 days/yr
- Hot days in 30 yrs
- 18 days/yr
Wind risk 2/10 · Minimal
- Chance of severe wind over 30 yrs
- —
Air-quality risk 2/10 · Minimal
- Unhealthy air days now
- 1 days/yr
- Unhealthy air days in 30 yrs
- 1 days/yr
Risk factors via First Street. Map © Google.
Why this score? — see what drove the C+ grade
The composite is a weighted blend of 9 inputs, each scored 0–100. Each bar is that input's sub-score; the figure is the points it added to the 100-point composite (weight × sub-score).
- Cash flow +27.9/30.0
- DSCR +9.9/10.0
- ARV discount +8.0/15.0
- 1% rule +6.8/10.0
- Livability +3.2/5.0
- Rent growth +2.5/5.0
- Condition / age +2.5/5.0
- Schools +2.2/10.0
- Appreciation +0.0/10.0
$109,900
🖨 Deal sheet (PDF) 📄 Offer letter ✓ Due diligence
Listing remarks
All this two bedroom home needs is a new owner. Remodeled kitchen and bath/ utility room. Freshly painted with all new flooring. New roof, furnace, and hot water tank. Fenced backyard with small storage shed.
Key facts
- New furnace
- New hot water tank
- Remodeled kitchen
Tags
Property features AI
Exterior
- Parking: On-street parking
- Utilities: Public water; Public sewer
- Home design: Single family residence; Two stories; Built in 1900; No shared/common walls
- Construction: Other foundation
- Exterior features: Fenced yard; Shed(s)
Interior
- Flooring: Laminate flooring; Carpet
- Bathrooms: 1 full bathroom
- Heating & cooling: Forced air heating; Has heating
- Interior features: Insulated windows throughout; Cellar / basement
Neighborhood map
What this means for you Summary
Snapshot
- This is a 2-bed/1.0-bath single-family listed at $110k.
Deal economics
- At list price, monthly cash flow is $340 ($4k/yr) — positive.
- The deal already cash-flows at list — no discount required.
- Meets the 1% rule at list price ($1k rent vs $110k).
- Recommended offer: $107k (3.0% below list) — sets the bar for market timing.
- Cap rate 10.0% vs local median 6.8% in Marion — top-decile yield for the area; either an underpriced asset or a hidden risk that comps aren't pricing in. Stress-test before assuming the spread holds.
Location & tenants
- Location reads 65/100 on livability (#704 in OH) — a middle-class / working-renter tenant base. Strengths: cost of living A+, housing A+; Watch: crime D+, amenities F, commute F.
- Marion City (town): math 22% / reading 31% proficiency, ranked #600 of 656 in OH (top 92%) — low school quality limits family demand, transient renter base, plan for 1-2y turnover; 67% free/reduced lunch — lower-income household profile, screen leases tightly.
- Zoned schools: William Mckinley Elementary School (math 12% / reading 27%, grade F, #1,293 of 1,584 statewide, top 83%, 348 students, 0% FRL); Ulysses S. Grant Middle School (math 22% / reading 25%, grade F, #597 of 654 statewide, top 92%, 998 students, 0% FRL); Harding High School (math 16% / reading 36%, grade F, #636 of 781 statewide, top 82%, 1,050 students, 0% FRL) — zoned schools average 0% FRL vs 67% district-wide (67 pts lower); this property's tenant base skews higher-income than the district average.
- Market conditions: 208 active listings in the ZIP; 53 units permitted in Marion County in 2024 (0 in 5+ unit buildings).
Forward outlook
- Local home prices are declining (-3.0%/yr); year-one equity from $760 of loan paydown is wiped out by about $3k of value loss. Plan a longer hold.
- Marion County population projected at -18% by 2050 — secular population decline; favor cash flow + early exit over multi-decade hold.
- At projected returns (-3.0% appreciation + 3.0% rent growth), your $31k cash investment doubles in ~9 years — after that, you're playing with house money.
Negotiation context
- It's been on market 52 days — a 3% lower offer ($107k) is reasonable based on typical stale-listing flexibility.
- 4 sale attempts since 21y ago; this cycle's ask has dropped $20k (15%) from the opening price — seller is motivated, your offer sets the floor, not the list.
- Current owner paid $36k; list at $110k implies a 207% gain — meaningful room to come down on a strong offer.
Risks & watch-outs
- Watch-outs: built in 1900 — expect roof / HVAC / electrical / plumbing capex.
Questions for the listing agent
- It's been on market 52 days. Have you received any prior offers? Is the seller open to a 3% concession, seller financing, or rate buy-down credit?
- Built in 1900 — when were the roof, HVAC, electrical panel, plumbing, and water heater last replaced?
- Is there a deadline driving the sale (1031 exchange, divorce, estate, relocation)? That informs how much negotiation room exists.
- Schools are D-rated, which usually means shorter tenancies and higher turnover. Who's the typical renter profile here, and what's been the actual vacancy rate?
- Crime grade is D in this area — have there been break-ins, vandalism, or insurance claims at this property in the last 3 years? What carrier currently insures it and at what premium?
- What's the average days-on-market for RENTAL listings here right now (not sales)? A rising rental-DOM trend means longer vacancies and softer asking-rent achievability than the comps imply.
- What's the recent tenant-quality profile in this submarket — average credit score on applications, eviction rate, late-payment / NSF rate, and stable-employment percentage? A property-management company in the area should have these aggregated.
- How much new for-sale + rental construction is in the pipeline within 1–3 miles? Heavy new supply typically softens prices + rents 12–24 months out; constrained supply supports both.
Investment metrics
- 1% rule
- 1.18% ✓
- Cap rate
- 10.00%
- Cash-on-cash
- 13.24%
- DSCR
- 1.59
- GRM
- 7.1
CMA / ARV
- ARV (median comp)
- $111,172
- List price
- $109,900
- Delta
- -1.14%
- Verdict
- FAIR
- Comps
- 20 within 1.0 mi
Show comp detail 12 sales within ~0.75 mi
| Address | Dist | Beds/Ba | Sqft | Sold | Price | $/sf | Match |
|---|---|---|---|---|---|---|---|
| 602 Uncapher Ave | 0.22mi | 2/1.5 | 1,340 (+1%) | 3mo | $145,000 | $108 | 83 |
| 564 Uncapher Ave | 0.17mi | 3/1.0 (+1) | 1,358 (+3%) | 0mo | $155,000 | $114 | 82 |
| 579 Henry St | 0.19mi | 3/1.0 (+1) | 1,236 (-7%) | 1mo | $181,000 | $146 | 74 |
| 245 Park Blvd | 0.39mi | 2/1.0 | 1,232 (-7%) | 3mo | $20,000 | $16 | 68 |
| 589 Uncapher Ave | 0.21mi | 2/1.0 | 1,144 (-14%) | 2mo | $70,000 | $61 | 66 |
| 696 Florence St | 0.24mi | 3/1.0 (+1) | 1,176 (-11%) | 2mo | $34,000 | $29 | 64 |
| 373 W Church St | 0.60mi | 3/1.5 (+1) | 1,354 (+2%) | 1mo | $84,000 | $62 | 60 |
| 618 Blaine Ave | 0.56mi | 3/1.0 (+1) | 1,376 (+4%) | 3mo | $101,000 | $73 | 60 |
| 780 Sheridan Rd | 0.61mi | 3/1.0 (+1) | 1,388 (+5%) | 2mo | $90,000 | $65 | 57 |
| 358 Nye St | 0.40mi | 3/1.5 (+1) | 1,138 (-14%) | 1mo | $199,000 | $175 | 50 |
| 764 Merkle Ave | 0.54mi | 3/1.5 (+1) | 1,174 (-11%) | 3mo | $175,000 | $149 | 47 |
| 589 Girard Ave | 0.68mi | 3/1.0 (+1) | 1,155 (-13%) | 2mo | $77,000 | $67 | 40 |
Match score weights: distance 35% · size 25% · config 20% · recency 20%. Top-matched comps best support the ARV.
Projected returns pro-forma
-3.0% appreciation · 3.0% rent growth · sell at horizon
- IRR
- 3.2%
- Equity multiple
- 1.12×
- Total profit
- $3,790
- Equity at exit
- $16,386
- IRR
- 12.7%
- Equity multiple
- 2.01×
- Total profit
- $31,038
- Equity at exit
- $9,502
Cash invested: $30,772 (down + closing). Projections, not guarantees.
Landlord ↔ Tenant lean methodology
- Overall (STATE)
- 73 Landlord-Friendly
- State Ohio
- 73 Landlord-Friendly · R+6
- County
- — inherits STATE
- City
- — inherits STATE
ZIP-level market 43302
- Home prices YoY
- -33.9%
- Active inventory
- 208
- Price-to-rent
- 7.1×
Monthly cashflow live
- Estimated rent
- $1,296 medium interval (Pro) →
- Mortgage (P&I)
- −$576
- Tax from tax record
- −$62 /mo · $748/yr
- Insurance
- −$46
- HOA
- −$0
- Vacancy / Maint / Mgmt
- −$272
- Net cashflow
- $340
Break-even live
Sensitivity live
| Price | -10% $402 | -5% $371 | +0% $340 | +5% $308 | +10% $277 |
|---|---|---|---|---|---|
| Rent | -10% $237 | -5% $288 | +0% $340 | +5% $391 | +10% $442 |
| Rate | -1.0pp $395 | -0.5pp $367 | base $340 | +0.5pp $311 | +1.0pp $282 |
UW: 25.0% down · 7.5% · 30yr · 1.5% tax · 5.0% vac · 8.0% maint · 8.0% mgmt
Financing live
Cash to close
- Down payment
- $27,475
- Closing costs
- $3,297
- Reserves months
- —
- Total cash needed
- —
Loan-product check · same deal, 3 products live
Conventional
25% down · 7.5% · 30yr
- Down + closing
- —
- Monthly P&I
- —
- Monthly cashflow
- —
- DSCR
- —
- Eligible?
- —
Personal DTI + credit; lowest rate.
DSCR
20% down · 8.5% · 30yr
- Down + closing
- —
- Monthly P&I
- —
- Monthly cashflow
- —
- DSCR
- —
- Eligible?
- —
No personal income docs; deal must DSCR.
Hard money
10% down · 12.0% · 12mo
- Down + closing
- —
- Monthly P&I
- —
- Monthly cashflow
- —
- DSCR
- —
- Eligible?
- —
Short-term bridge; refi at stabilization.
Listing history 26 events
-
2026-06-21days on market $109,900 Active 52 DOM
-
2026-06-19days on market $109,900 Active 50 DOM
-
2026-06-18days on market $109,900 Active 49 DOM
-
2026-06-17days on market $109,900 Active 48 DOM
-
2026-06-17price $109,900 Active 47 DOM
-
2026-06-16days on market $119,900 Active 47 DOM
-
2026-06-15days on market $119,900 Active 46 DOM
-
2026-06-14days on market $119,900 Active 44 DOM
-
2026-06-12days on market $119,900 Active 43 DOM
-
2026-06-09days on market $119,900 Active 40 DOM
-
2026-06-08days on market $119,900 Active 39 DOM
-
2026-06-07days on market $119,900 Active 38 DOM
-
2026-06-05days on market $119,900 Active 35 DOM
-
2026-06-03days on market $119,900 Active 34 DOM
-
2026-06-02days on market $119,900 Active 33 DOM
-
2026-06-01days on market $119,900 Active 32 DOM
-
2026-05-31days on market $119,900 Active 31 DOM
-
2026-05-30days on market $119,900 Active 30 DOM
-
2026-05-13price $119,900 208-char remark
-
2026-04-30$129,900 Active 208-char remark
-
2021-06-02historical
-
2021-06-02historical
-
2009-04-29$39,900
-
2005-10-14soldstatus $35,750
-
2005-08-30$37,900
-
2005-08-30$37,900
ⓘ Source: listings_history table (triggers on properties + properties_extension) + one-shot
backfill from property_details.listing_events for pre-trigger history.
Tax reassessment forecast OH · Partial reset (capped growth)
- Current annual tax
- $748 · $62/mo
- Projected year-2 tax
- $1,231 · $103/mo
- Expected delta
- +$483/yr (+$40/mo · 64.6%)
ⓘ Screening estimate from a state-policy table — verify with the county assessor before closing.
Climate risk First Street
- Flood 1/10 Low FEMA zone X (unshaded) · 0% chance over 30 yrs
- Wildfire 1/10 Low
- Heat 3/10 Moderate 7 d/yr ≥99°F today · 18 d/yr by 30 yrs out
- Wind 2/10 Low
- Air quality 2/10 Low 1 unhealthy d/yr today · 1 by 30 yrs out
Nearby sold comps map
Loading sold comps map…
Walkable amenities ~0.75 mi
Loading nearby amenities…
Taxation est. · year 1
- Rental income
- $15,554
- − Mortgage interest
- −$6,156
- − Property taxes
- −$748
- − Insurance
- −$550
- − Repairs & maintenance
- −$1,244
- − Management
- −$1,244
- − Depreciation
- −$3,197
- Taxable income
- $2,415
- Est. tax owed @ 24.0%
- −$580
- After-tax cash flow
- $3,495/yr
For passive investors: Depreciation is non-cash, so a rental often shows a tax loss while cash-flowing — sheltering income. Rental losses are passive: they offset passive income freely, and up to $25,000/yr can offset ordinary (W-2) income if you actively participate and your MAGI is under $100k (phasing out to $0 by $150k); unused losses carry forward. On sale, claimed depreciation is recaptured at up to 25%, and gains may owe capital-gains tax (a 1031 exchange can defer both). Figures are a year-1 estimate at your 24.0% rate — not tax advice; consult a CPA.
Schools (NCES district)
- District
- Marion City
- NCES district ID
- 3904433
- Math proficiency
- 22% ▼ -17.00%
- Reading proficiency
- 31% ▼ -8.00%
- Median HH income
- $32,327
- Composite
- 21.58/100
- National rank
- #8306
- State rank
- #600 of 656 in OH
Livability — Marion
- Score
- 65/100
- State rank
- #704
- US rank
- #12605
Category grades
Schools grade is shown separately in the Schools card above.
Census & demographics
- Census place
- Marion, OH
- County
- Marion County · 53,702 people
- City population
- 53,702
- Metro
- Marion, OH
- Population (ZIP)
- 53,702
- Household income
- $55,057
- Rent vs Own
- Severe rent burden
- 1554.0
Population outlook (Marion County) Hauer SSP2
- Today (2025)
- 62,078 people
- By 2030
- 60,049 · -3.3%
- By 2040
- 55,413 · -10.7%
- By 2050
- 50,604 · -18.5%
- By 2075
- 40,162 · -35.3%
- By 2100
- 29,105 · -53.1%
Race, ethnicity, and origin ACS 2023
- Neighborhood character
- Predominantly White (85%)
- Race & ethnicity
- White 85% Black 6% Two or more races 6% Hispanic / Latino 3%
- Common ancestry
- Slovak 2% Romanian 2% Lithuanian 2%
- Foreign-born
- 2% · Canada
- Languages at home
- 96% English-only · Spanish 2% Arabic 1%
Political lean MEDSL · Marion
- 2024 margin
- Solid R (+41.4) · D 28.9% · R 70.3%
- 2008→2024 swing
- -32.5pp toward R · 2008: -8.9pp · 2024: -41.4pp
- All cycles
- 2024: R+41.4 2020: R+38.6 2016: R+34.4 2012: R+7.6 2008: R+8.9
Not yet ingested
- Civics
- —
Market trends
- HPI YoY
- ▼ -114.52%
- Current HPI
- 223.5344
- Rent YoY
- —
- Metro
- Marion, OH
- State GDP YoY
- ▲ 1.98%
- F500 in state
- 48
Industry mix (Fortune 500 HQ in OH)
| Industry | F500 HQs | Revenue |
|---|---|---|
| Insurance | 3 | $145B |
|
||
| Industrial Machinery | 3 | $49B |
|
||
| Financial Services | 3 | $24B |
|
||
| Consumer Goods | 2 | $93B |
|
||
| Aerospace / Defense | 2 | $47B |
|
||
| Utilities | 2 | $33B |
|
||
Price history
+190.0% since first listed9 events — show timeline
- 2026-06-16 Price Changed $109,900 CBRMLS
- 2026-05-13 Price Changed $119,900 CBRMLS
- 2026-04-30 Listed $129,900 CBRMLS
- 2021-06-02 Listing Removed — CBRMLS
- 2021-06-02 Listing Removed — CBRMLS
- 2009-04-29 Listed $39,900 CBRMLS
- 2005-10-14 Sold (MLS) $35,750 CBRMLS
- 2005-08-30 Listed $37,900 CBRMLS
- 2005-08-30 Listed $37,900 CBRMLS
Property tax history
+1.6%/yrLatest (2025): $748 · +0.0% YoY. Source: county tax records.
Cash-flow waterfall
monthlySold comps — $/sqft
last 12 mo · ≤1 miLoading sold comps…