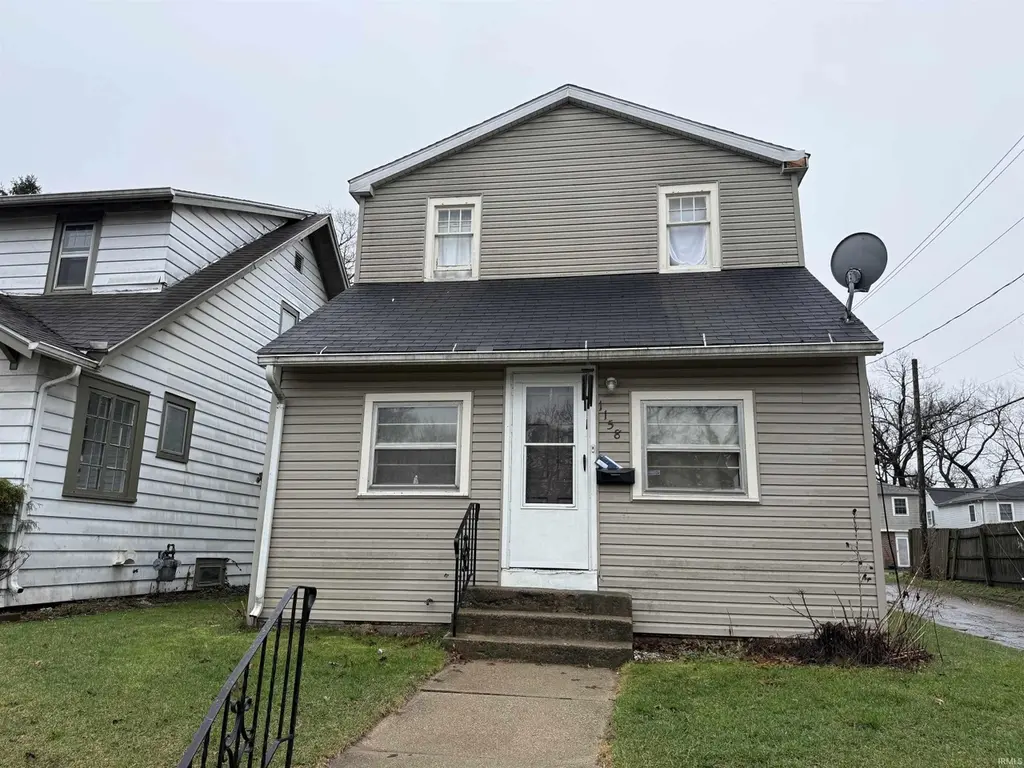
1158 E Indiana Ave · South Bend, IN
Flood risk 1/10 · Minimal
- FEMA flood zone
- X (unshaded)
- Chance of flooding over 30 yrs
- 0.0%
- Est. flood insurance / yr
- $473 – $860
Fire risk 1/10 · Minimal
- Est. fire insurance / yr
- $717 – $1,331
Heat risk 2/10 · Minimal
- Hot days now (above 99°F)
- 7 days/yr
- Hot days in 30 yrs
- 16 days/yr
Wind risk 2/10 · Minimal
- Chance of severe wind over 30 yrs
- —
Air-quality risk 3/10 · Minor
- Unhealthy air days now
- 2 days/yr
- Unhealthy air days in 30 yrs
- 3 days/yr
Risk factors via First Street. Map © Google.
Why this score? — see what drove the B grade
The composite is a weighted blend of 9 inputs, each scored 0–100. Each bar is that input's sub-score; the figure is the points it added to the 100-point composite (weight × sub-score).
- Cash flow +30.0/30.0
- ARV discount +12.4/15.0
- 1% rule +10.0/10.0
- DSCR +10.0/10.0
- Rent growth +3.5/5.0
- Livability +3.2/5.0
- Condition / age +2.5/5.0
- Schools +1.4/10.0
- Appreciation +0.0/10.0
$85,000
🖨 Deal sheet 📄 Offer letter ✓ Due diligence
Listing remarks MLS
BUYER FINANCING FELL THROUGH! Solid two-story investment property with a proven rental history and immediate income potential. This well-maintained home features four bedrooms and a full bath on the upper level, while the main floor offers a spacious living room, formal dining area, kitchen, and a welcoming enclosed front porch. The basement includes a convenient laundry area, adding to tenant appeal. A detached one-car garage is accessible from the alley. Schedule your showing today—opportunities like this don’t last long!
Key facts
- Well maintained home
- Formal dining area
- Spacious living room
Tags
Neighborhood map
What this means for you Summary
Snapshot
- This is a 4-bed/1.0-bath single-family listed at $85k.
Deal economics
- At list price, monthly cash flow is $591 ($7k/yr) — positive.
- The deal already cash-flows at list — no discount required.
- Meets the 1% rule at list price ($1k rent vs $85k).
- Recommended offer: $82k (3.0% below list) — sets the bar for market timing.
- Cap rate 14.6% vs local median 4.4% in South Bend — top-decile yield for the area; either an underpriced asset or a hidden risk that comps aren't pricing in. Stress-test before assuming the spread holds.
Location & tenants
- Location reads 64/100 on livability (#365 in IN) — a middle-class / working-renter tenant base. Strengths: cost of living A+, housing A+, health & safety A+; Watch: amenities D, employment D, schools F.
- South Bend Community School Corporation (urban): math 12% / reading 21% proficiency, ranked #284 of 301 in IN (top 94%) — low school quality limits family demand, transient renter base, plan for 1-2y turnover; 66% free/reduced lunch — lower-income household profile, screen leases tightly.
- Market conditions: Rents rising fast (+4.1%/yr); 77 active listings in the ZIP; 19 comparable units currently listed for rent nearby; rentals lingering (median 44d on market — plan ~5-8 weeks vacancy on turnover, expect pricing pressure); 58% of comp listings sitting > 30 days — soft ceiling on asking rent; lower-income renter base — watch delinquency; 754 units permitted in St. Joseph County in 2024 (460 in 5+ unit buildings).
- This rent runs 41% of the median local income ($43k/yr) — at the standard rent-burdened threshold; future hikes will face affordability resistance.
Forward outlook
- Local home prices are declining (-3.0%/yr); year-one equity from $588 of loan paydown is wiped out by about $3k of value loss. Plan a longer hold.
- At projected returns (-3.0% appreciation + 4.1% rent growth), your $24k cash investment doubles in ~4 years — after that, you're playing with house money.
Negotiation context
- It's been on market 56 days — a 3% lower offer ($82k) is reasonable based on typical stale-listing flexibility.
- 2 sale attempts with the ask held roughly flat each time — persistent listings suggest the price (not the market) is what's stuck; bring a comps-based counter.
- Current owner paid $42k; list at $85k implies a 101% gain — meaningful room to come down on a strong offer.
Risks & watch-outs
- Watch-outs: built in 1916 — expect roof / HVAC / electrical / plumbing capex.
Questions for the listing agent
- It's been on market 56 days. Have you received any prior offers? Is the seller open to a 3% concession, seller financing, or rate buy-down credit?
- Built in 1916 — when were the roof, HVAC, electrical panel, plumbing, and water heater last replaced?
- Is there a deadline driving the sale (1031 exchange, divorce, estate, relocation)? That informs how much negotiation room exists.
- Schools are F-rated, which usually means shorter tenancies and higher turnover. Who's the typical renter profile here, and what's been the actual vacancy rate?
- Crime grade is F in this area — have there been break-ins, vandalism, or insurance claims at this property in the last 3 years? What carrier currently insures it and at what premium?
- What's the average days-on-market for RENTAL listings here right now (not sales)? A rising rental-DOM trend means longer vacancies and softer asking-rent achievability than the comps imply.
- What's the recent tenant-quality profile in this submarket — average credit score on applications, eviction rate, late-payment / NSF rate, and stable-employment percentage? A property-management company in the area should have these aggregated.
- How much new for-sale + rental construction is in the pipeline within 1–3 miles? Heavy new supply typically softens prices + rents 12–24 months out; constrained supply supports both.
Investment metrics
- 1% rule
- 1.69% ✓
- Cap rate
- 14.63%
- Cash-on-cash
- 29.79%
- DSCR
- 2.33
- GRM
- 4.9
CMA / ARV
- ARV (median comp)
- $95,339
- List price
- $85,000
- Delta
- -10.84%
- Verdict
- UNDERPRICED
- Comps
- 20 within 1.0 mi
Show comp detail 12 sales within ~0.75 mi
| Address | Dist | Beds/Ba | Sqft | Sold | Price | $/sf | Match |
|---|---|---|---|---|---|---|---|
| 1530 Virginia St | 0.18mi | 4/1.5 | 1,208 (+2%) | 4mo | $130,000 | $108 | 83 |
| 1149 E Indiana Ave | 0.03mi | 4/1.5 | 1,344 (+13%) | 1mo | $90,000 | $67 | 74 |
| 918 E Bowman St | 0.41mi | 3/1.0 (-1) | 1,248 (+5%) | 1mo | $77,000 | $62 | 66 |
| 1133 Milton St | 0.20mi | 3/1.0 (-1) | 1,344 (+13%) | 0mo | $85,000 | $63 | 63 |
| 1122 Milton St | 0.23mi | 3/1.0 (-1) | 1,328 (+12%) | 4mo | $135,000 | $102 | 61 |
| 316 E Dayton St | 0.69mi | 3/1.0 (-1) | 1,176 (-1%) | 2mo | $77,000 | $65 | 59 |
| 1405 Randolph St | 0.31mi | 3/1.0 (-1) | 1,332 (+12%) | 4mo | $168,000 | $126 | 57 |
| 1112 E Fox St | 0.45mi | 3/1.0 (-1) | 1,300 (+10%) | 2mo | $148,500 | $114 | 56 |
| 922 Milton St | 0.33mi | 3/1.5 (-1) | 1,344 (+13%) | 3mo | $60,000 | $45 | 53 |
| 1508 Carroll St | 0.69mi | 3/1.0 (-1) | 1,144 (-4%) | 4mo | $105,000 | $92 | 53 |
| 1804 E Calvert St | 0.69mi | 3/1.0 (-1) | 1,104 (-7%) | 2mo | $185,000 | $168 | 50 |
| 809 E Ewing Ave | 0.59mi | 3/1.5 (-1) | 1,350 (+14%) | 5mo | $179,000 | $133 | 38 |
Match score weights: distance 35% · size 25% · config 20% · recency 20%. Top-matched comps best support the ARV.
Projected returns pro-forma
-3.0% appreciation · 4.08% rent growth · sell at horizon
- IRR
- 25.5%
- Equity multiple
- 2.07×
- Total profit
- $25,431
- Equity at exit
- $12,674
- IRR
- 33.8%
- Equity multiple
- 4.24×
- Total profit
- $77,204
- Equity at exit
- $7,349
Cash invested: $23,800 (down + closing). Projections, not guarantees.
Landlord ↔ Tenant lean methodology
- Overall (STATE)
- 90 Strongly Landlord-Friendly
- State Indiana
- 90 Strongly Landlord-Friendly · R+11
- County
- — inherits STATE
- City
- — inherits STATE
ZIP-level market 46613
- Home prices YoY
- -7.2%
- Rents YoY
- 4.1%
- Active inventory
- 77
- Price-to-rent
- 4.9×
Monthly cashflow live
- Estimated rent
- $1,438 high interval (Pro) →
- Mortgage (P&I)
- −$446
- Tax from tax record
- −$64 /mo · $765/yr
- Insurance
- −$35
- HOA
- −$0
- Vacancy / Maint / Mgmt
- −$302
- Net cashflow
- $591
Break-even live
UW: 25.0% down · 7.5% · 30yr · 1.5% tax · 5.0% vac · 8.0% maint · 8.0% mgmt
Financing live
Cash to close
- Down payment
- $21,250
- Closing costs
- $2,550
- Reserves months
- —
- Total cash needed
- —
Loan-product check · same deal, 3 products live
Conventional
25% down · 7.5% · 30yr
- Down + closing
- —
- Monthly P&I
- —
- Monthly cashflow
- —
- DSCR
- —
- Eligible?
- —
Personal DTI + credit; lowest rate.
DSCR
20% down · 8.5% · 30yr
- Down + closing
- —
- Monthly P&I
- —
- Monthly cashflow
- —
- DSCR
- —
- Eligible?
- —
No personal income docs; deal must DSCR.
Hard money
10% down · 12.0% · 12mo
- Down + closing
- —
- Monthly P&I
- —
- Monthly cashflow
- —
- DSCR
- —
- Eligible?
- —
Short-term bridge; refi at stabilization.
Rent comps 19 comps
| Address | Beds | Baths | Sqft | Rent | $/sqft | DOM | Units | Dist |
|---|---|---|---|---|---|---|---|---|
| 1149 E Indiana Ave South Bend, IN | 4.0 | 2.0 | 1344 | $1,200 | $0.89 | 13d | 1 | 0.05mi |
| 1126 E Broadway St South Bend, IN | 4.0 | 2.0 | 1492 | $1,365 | $0.91 | 21d | 1 | 0.15mi |
| 1912 Miami St Unit 1912 South Bend, IN | 3.0 | 1.5 | 1300 | $1,400 | $1.08 | 44d | 1 | 0.27mi |
| 2114 High St South Bend, IN | 3.0 | 1.0 | 949 | $1,300 | $1.37 | 44d | 1 | 0.51mi |
| 317 E Indiana Ave South Bend, IN | 3.0 | 1.0 | 1344 | $1,200 | $0.89 | 21d | 1 | 0.64mi |
| 1729 E Calvert St South Bend, IN | 3.0 | 1.0 | 900 | $1,300 | $1.44 | 44d | 1 | 0.65mi |
| 909 E Fairview Ave South Bend, IN | 3.0 | 1.0 | 1128 | $1,450 | $1.29 | 44d | 1 | 0.70mi |
| 821 E Fairview Ave South Bend, IN | 3.0 | 1.0 | 1248 | $1,399 | $1.12 | 44d | 1 | 0.72mi |
| 1106 S 20th St South Bend, IN | 1.0–3.0 | 1.0–2.0 | 885 | $1,200 | $1.36 | 13d | 1 | 0.88mi |
| 237 E Victoria St South Bend, IN | 3.0 | 1.0 | 840 | $995 | $1.18 | 44d | 1 | 0.92mi |
| 525 E Eckman St South Bend, IN | 3.0 | 1.0 | 1400 | $1,500 | $1.07 | 44d | 1 | 0.95mi |
| 405 E Woodside St South Bend, IN | 3.0 | 1.0 | 1440 | $1,425 | $0.99 | 21d | 1 | 1.10mi |
| 754 S 23rd St South Bend, IN | 3.0 | 1.0 | 884 | $1,300 | $1.47 | 44d | 1 | 1.20mi |
| 819 S 24th St South Bend, IN | 3.0 | 2.0 | 1480 | $1,795 | $1.21 | 44d | 1 | 1.20mi |
| 1218 S 26th St South Bend, IN | 3.0 | 1.0 | 856 | $1,400 | $1.64 | 13d | 1 | 1.22mi |
| 913 E Washington St South Bend, IN | 4.0 | 1.5 | 1312 | $1,295 | $0.99 | 21d | 1 | 1.31mi |
| 911 E Washington St South Bend, IN | 3.0 | 1.0 | 886 | $1,195 | $1.35 | 13d | 1 | 1.32mi |
| 2102 S Scott St South Bend, IN | 3.0 | 1.0 | 768 | $1,250 | $1.63 | 44d | 1 | 1.38mi |
| 1007 E Chippewa Ave South Bend, IN | 3.0 | 1.0 | 1344 | $1,399 | $1.04 | 44d | 1 | 1.39mi |
Listing history 21 events
-
2026-06-18days on market $85,000 Active 56 DOM
-
2026-06-17remarks 552-char remark
-
2026-06-17days on market $85,000 Active 55 DOM
-
2026-06-16days on market $85,000 Active 54 DOM
-
2026-06-15days on market $85,000 Active 53 DOM
-
2026-06-14days on market $85,000 Active 51 DOM
-
2026-06-13days on market $85,000 Active 50 DOM
-
2026-06-10days on market $85,000 Active 48 DOM
-
2026-06-09days on market $85,000 Active 47 DOM
-
2026-06-08days on market $85,000 Active 46 DOM
-
2026-06-07days on market $85,000 Active 45 DOM
-
2026-06-03days on market $85,000 Active 41 DOM
-
2026-06-02days on market $85,000 Active 40 DOM
-
2026-06-01days on market $85,000 Active 39 DOM
-
2026-05-31days on market $85,000 Active 38 DOM
-
2026-05-30days on market $85,000 Active 37 DOM
-
2026-05-11status Pending 541-char remark
Show marketing remark (541 chars)
BUYER FINANCING FELL THROUGH! Solid two-story investment property with a proven rental history and immediate income potential. This well-maintained home features four bedrooms and a full bath on the upper level, while the main floor offers a spacious living room, formal dining area, kitchen, and a welcoming enclosed front porch. The basement includes a convenient laundry area, adding to tenant appeal. A detached one-car garage is accessible from the alley. Schedule your showing today—opportunities like this don’t last long!
-
2026-04-28status Active 541-char remark
Show marketing remark (541 chars)
BUYER FINANCING FELL THROUGH! Solid two-story investment property with a proven rental history and immediate income potential. This well-maintained home features four bedrooms and a full bath on the upper level, while the main floor offers a spacious living room, formal dining area, kitchen, and a welcoming enclosed front porch. The basement includes a convenient laundry area, adding to tenant appeal. A detached one-car garage is accessible from the alley. Schedule your showing today—opportunities like this don’t last long!
-
2026-04-10status Pending 541-char remark
Show marketing remark (541 chars)
BUYER FINANCING FELL THROUGH! Solid two-story investment property with a proven rental history and immediate income potential. This well-maintained home features four bedrooms and a full bath on the upper level, while the main floor offers a spacious living room, formal dining area, kitchen, and a welcoming enclosed front porch. The basement includes a convenient laundry area, adding to tenant appeal. A detached one-car garage is accessible from the alley. Schedule your showing today—opportunities like this don’t last long!
-
2026-03-25$85,000 Active 541-char remark
Show marketing remark (541 chars)
BUYER FINANCING FELL THROUGH! Solid two-story investment property with a proven rental history and immediate income potential. This well-maintained home features four bedrooms and a full bath on the upper level, while the main floor offers a spacious living room, formal dining area, kitchen, and a welcoming enclosed front porch. The basement includes a convenient laundry area, adding to tenant appeal. A detached one-car garage is accessible from the alley. Schedule your showing today—opportunities like this don’t last long!
-
2007-04-17soldstatus $42,194
ⓘ Source: listings_history table (triggers on properties + properties_extension) + one-shot
backfill from property_details.listing_events for pre-trigger history.
Tax reassessment forecast IN · Partial reset (capped growth)
- Current annual tax
- $765 · $64/mo
- Projected year-2 tax
- $765 · $64/mo
- Expected delta
- $0/yr ($0/mo · 0.0%)
ⓘ Screening estimate from a state-policy table — verify with the county assessor before closing.
Climate risk First Street
- Flood 1/10 Low FEMA zone X (unshaded) · 0% chance over 30 yrs
- Wildfire 1/10 Low
- Heat 2/10 Low 7 d/yr ≥99°F today · 16 d/yr by 30 yrs out
- Wind 2/10 Low
- Air quality 3/10 Moderate 2 unhealthy d/yr today · 3 by 30 yrs out
Nearby sold comps map
Loading sold comps map…
Walkable amenities ~0.75 mi
Loading nearby amenities…
Taxation est. · year 1
- Rental income
- $17,252
- − Mortgage interest
- −$4,761
- − Property taxes
- −$765
- − Insurance
- −$425
- − Repairs & maintenance
- −$1,380
- − Management
- −$1,380
- − Depreciation
- −$2,473
- Taxable income
- $6,067
- Est. tax owed @ 24.0%
- −$1,456
- After-tax cash flow
- $5,634/yr
For passive investors: Depreciation is non-cash, so a rental often shows a tax loss while cash-flowing — sheltering income. Rental losses are passive: they offset passive income freely, and up to $25,000/yr can offset ordinary (W-2) income if you actively participate and your MAGI is under $100k (phasing out to $0 by $150k); unused losses carry forward. On sale, claimed depreciation is recaptured at up to 25%, and gains may owe capital-gains tax (a 1031 exchange can defer both). Figures are a year-1 estimate at your 24.0% rate — not tax advice; consult a CPA.
Schools (NCES district)
- District
- South Bend Community School Corporation
- NCES district ID
- 1810290
- Math proficiency
- 12% ▼ -10.00%
- Reading proficiency
- 21% ▼ -6.00%
- Median HH income
- $41,935
- Composite
- 14.21/100
- National rank
- #9452
- State rank
- #284 of 301 in IN
Livability — South Bend
- Score
- 64/100
- State rank
- #365
- US rank
- #13730
Category grades
Schools grade is shown separately in the Schools card above.
Census & demographics
- Census place
- South Bend, IN
- County
- Saint Joseph County · 189,048 people
- City population
- 99,767
- Metro
- South Bend-Mishawaka, IN-MI
- Population (ZIP)
- 12,279
- Household income
- $42,537
- Rent vs Own
- Severe rent burden
- 545.0
Population outlook (St. Joseph County) Hauer SSP2
- Today (2025)
- 273,186 people
- By 2030
- 273,594 · +0.1%
- By 2040
- 271,641 · -0.6%
- By 2050
- 269,187 · -1.5%
- By 2075
- 263,136 · -3.7%
- By 2100
- 245,659 · -10.1%
Race, ethnicity, and origin ACS 2023
- Neighborhood character
- Highly diverse neighborhood (Simpson 0.72)
- Race & ethnicity
- White 41% Hispanic / Latino 24% Black 23% Two or more races 22% Asian 2% Native American 1%
- Hispanic origin (detail)
- Mexican 22%
- Common ancestry
- Romanian 4% Italian 1% Slovak 1%
- Foreign-born
- 9% · Canada, Philippines
- Languages at home
- 81% English-only · Spanish 17% Other Asian/Pacific 1%
Political lean MEDSL · St. Joseph
- 2024 margin
- Toss-up / Even · D 50.0% · R 48.5% · Other 1.5%
- 2008→2024 swing
- -15.6pp toward R · 2008: 17.1pp · 2024: 1.5pp
- All cycles
- 2024: D+1.5 2020: D+5.8 2016: D+0.2 2012: D+3.5 2008: D+17.1
Not yet ingested
- Civics
- —
Market trends
- HPI YoY
- ▼ -20.88%
- Current HPI
- 270.0303
- Rent YoY
- ▲ 4.08%
- Metro
- South Bend-Mishawaka, IN-MI
- State GDP YoY
- ▲ 2.90%
- F500 in state
- 18
Industry mix (Fortune 500 HQ in IN)
| Industry | F500 HQs | Revenue |
|---|---|---|
| Industrial Machinery | 2 | $37B |
|
||
| Healthcare | 1 | $177B |
|
||
| Pharmaceuticals | 1 | $45B |
|
||
| Metals / Steel | 1 | $18B |
|
||
| Agriculture | 1 | $17B |
|
||
| Packaging | 1 | $12B |
|
||
Price history
+101.5% since first listed5 events — show timeline
- 2026-05-11 Pending — IRMLS
- 2026-04-28 Relisted — IRMLS
- 2026-04-10 Pending — IRMLS
- 2026-03-25 Listed $85,000 IRMLS
- 2007-04-17 Sold (Public Records) $42,194 Public Records
Property tax history
-9.7%/yrLatest (2023): $765 · -0.7% YoY. Source: county tax records.
Cash-flow waterfall
monthlySold comps — $/sqft
last 12 mo · ≤1 miLoading sold comps…