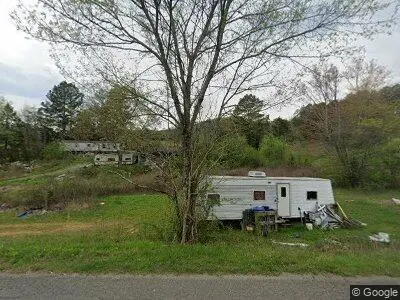
121 King Ln · Kahite, TN
Flood risk 4/10 · Minor
- FEMA flood zone
- X (unshaded)
- Chance of flooding over 30 yrs
- 0.24%
- Est. flood insurance / yr
- $507 – $1,088
Fire risk 7/10 · Major
- Est. fire insurance / yr
- $949 – $1,763
Heat risk 6/10 · Moderate
- Hot days now (above 102°F)
- 7 days/yr
- Hot days in 30 yrs
- 22 days/yr
Wind risk 2/10 · Minimal
- Chance of severe wind over 30 yrs
- —
Air-quality risk 3/10 · Minor
- Unhealthy air days now
- 2 days/yr
- Unhealthy air days in 30 yrs
- 3 days/yr
Risk factors via First Street. Map © Google.
Why this score? — see what drove the B- grade
The composite is a weighted blend of 9 inputs, each scored 0–100. Each bar is that input's sub-score; the figure is the points it added to the 100-point composite (weight × sub-score).
- Cash flow +30.0/30.0
- 1% rule +10.0/10.0
- DSCR +10.0/10.0
- ARV discount +7.5/15.0
- Rent growth +2.5/5.0
- Livability +2.5/5.0
- Condition / age +2.5/5.0
- Schools +1.8/10.0
- Appreciation +0.0/10.0
$70,000
🖨 Deal sheet 📄 Offer letter ✓ Due diligence
Listing remarks
House and manufactured home in need of repairs on 1 acre of non-restricted land. Repair and have a family compound or tear down and build. Selling as is. Wet weather creek runs through property, great neighborhood. Lease purchase is possible. Close to Tellico Lake and Cherohala Parkway, fishing, hiking, and camping.
Key facts
- Wet weather creek
- Non-restricted land
- Fishing
Tags
Neighborhood map
What this means for you Summary
Snapshot
- This is a 3-bed/1.0-bath single-family listed at $70k.
Deal economics
- At list price, monthly cash flow is $1k ($13k/yr) — positive.
- The deal already cash-flows at list — no discount required.
- Meets the 1% rule at list price ($2k rent vs $70k).
- Cap rate 24.9% vs local median 1.2% in Kahite — top-decile yield for the area; either an underpriced asset or a hidden risk that comps aren't pricing in. Stress-test before assuming the spread holds.
Location & tenants
- Location reads: area grade B — affects rentability + tenant quality, not the cash-flow math above.
- Monroe County (rural): math 20% / reading 24% proficiency, ranked #106 of 139 in TN (top 76%) — low school quality limits family demand, transient renter base, plan for 1-2y turnover.
- Market conditions: 200 active listings in the ZIP; 157 units permitted in Monroe County in 2024 (0 in 5+ unit buildings).
Forward outlook
- Local home prices are declining (-3.0%/yr); year-one equity from $484 of loan paydown is wiped out by about $2k of value loss. Plan a longer hold.
- At projected returns (-3.0% appreciation + 3.0% rent growth), your $20k cash investment doubles in ~2 years — after that, you're playing with house money.
Negotiation context
- Only 2 days on market — expect competitive offers; lowballing is unlikely to land.
Risks & watch-outs
- Climate carrying-cost: major wildfire risk; extreme-heat days projected 7→22/yr by 2055 (HVAC capex compounding) — expect insurance premiums to compound above CPI over the hold.
Questions for the listing agent
- Built in 1975 — when were the roof, HVAC, electrical panel, plumbing, and water heater last replaced?
- Is there a deadline driving the sale (1031 exchange, divorce, estate, relocation)? That informs how much negotiation room exists.
- What's the average days-on-market for RENTAL listings here right now (not sales)? A rising rental-DOM trend means longer vacancies and softer asking-rent achievability than the comps imply.
- What's the recent tenant-quality profile in this submarket — average credit score on applications, eviction rate, late-payment / NSF rate, and stable-employment percentage? A property-management company in the area should have these aggregated.
- How much new for-sale + rental construction is in the pipeline within 1–3 miles? Heavy new supply typically softens prices + rents 12–24 months out; constrained supply supports both.
Investment metrics
- 1% rule
- 2.72% ✓
- Cap rate
- 24.92%
- Cash-on-cash
- 66.53%
- DSCR
- 3.96
- GRM
- 3.1
CMA / ARV
No comps found within radius.
Projected returns pro-forma
-3.0% appreciation · 3.0% rent growth · sell at horizon
- IRR
- 65.8%
- Equity multiple
- 3.95×
- Total profit
- $57,850
- Equity at exit
- $10,437
- IRR
- 70.1%
- Equity multiple
- 8.11×
- Total profit
- $139,436
- Equity at exit
- $6,052
Cash invested: $19,600 (down + closing). Projections, not guarantees.
Landlord ↔ Tenant lean methodology
- Overall (STATE)
- 87 Strongly Landlord-Friendly
- State Tennessee
- 87 Strongly Landlord-Friendly · R+13
- County
- — inherits STATE
- City
- — inherits STATE
ZIP-level market 37885
- Home prices YoY
- -7.8%
- Active inventory
- 200
- Price-to-rent
- 3.1×
Monthly cashflow live
- Estimated rent
- $1,902 medium interval (Pro) →
- Mortgage (P&I)
- −$367
- Tax from tax record
- −$20 /mo · $240/yr
- Insurance
- −$29
- HOA
- −$0
- Vacancy / Maint / Mgmt
- −$399
- Net cashflow
- $1,087
Break-even live
UW: 25.0% down · 7.5% · 30yr · 1.5% tax · 5.0% vac · 8.0% maint · 8.0% mgmt
Financing live
Cash to close
- Down payment
- $17,500
- Closing costs
- $2,100
- Reserves months
- —
- Total cash needed
- —
Loan-product check · same deal, 3 products live
Conventional
25% down · 7.5% · 30yr
- Down + closing
- —
- Monthly P&I
- —
- Monthly cashflow
- —
- DSCR
- —
- Eligible?
- —
Personal DTI + credit; lowest rate.
DSCR
20% down · 8.5% · 30yr
- Down + closing
- —
- Monthly P&I
- —
- Monthly cashflow
- —
- DSCR
- —
- Eligible?
- —
No personal income docs; deal must DSCR.
Hard money
10% down · 12.0% · 12mo
- Down + closing
- —
- Monthly P&I
- —
- Monthly cashflow
- —
- DSCR
- —
- Eligible?
- —
Short-term bridge; refi at stabilization.
Listing history 5 events
-
2026-06-18days on market $70,000 Active 2 DOM
-
2026-06-17remarks 317-char remark
-
2026-06-17pricestatus $70,000 Active 1 DOM
-
2026-05-13status Under Contract
-
2026-05-12$40,000 Active
ⓘ Source: listings_history table (triggers on properties + properties_extension) + one-shot
backfill from property_details.listing_events for pre-trigger history.
Tax reassessment forecast TN · Resets to sale price
- Current annual tax
- $240 · $20/mo
- Projected year-2 tax
- $497 · $41/mo
- Expected delta
- +$257/yr (+$21/mo · 107.1%)
ⓘ Screening estimate from a state-policy table — verify with the county assessor before closing.
Climate risk First Street
- Flood 4/10 Moderate FEMA zone X (unshaded) · 24% chance over 30 yrs
- Wildfire 7/10 Severe
- Heat 6/10 Major 7 d/yr ≥102°F today · 22 d/yr by 30 yrs out
- Wind 2/10 Low
- Air quality 3/10 Moderate 2 unhealthy d/yr today · 3 by 30 yrs out
Nearby sold comps map
Loading sold comps map…
Walkable amenities ~0.75 mi
Loading nearby amenities…
Taxation est. · year 1
- Rental income
- $22,828
- − Mortgage interest
- −$3,921
- − Property taxes
- −$240
- − Insurance
- −$350
- − Repairs & maintenance
- −$1,826
- − Management
- −$1,826
- − Depreciation
- −$2,036
- Taxable income
- $12,628
- Est. tax owed @ 24.0%
- −$3,031
- After-tax cash flow
- $10,008/yr
For passive investors: Depreciation is non-cash, so a rental often shows a tax loss while cash-flowing — sheltering income. Rental losses are passive: they offset passive income freely, and up to $25,000/yr can offset ordinary (W-2) income if you actively participate and your MAGI is under $100k (phasing out to $0 by $150k); unused losses carry forward. On sale, claimed depreciation is recaptured at up to 25%, and gains may owe capital-gains tax (a 1031 exchange can defer both). Figures are a year-1 estimate at your 24.0% rate — not tax advice; consult a CPA.
Schools (NCES district)
- District
- Monroe County
- NCES district ID
- 4703000
- Math proficiency
- 20% ▼ -8.00%
- Reading proficiency
- 24% ▼ -6.00%
- Median HH income
- $36,701
- Composite
- 18.29/100
- National rank
- #8956
- State rank
- #106 of 139 in TN
Livability — Kahite
No livability data for this city. (Only ~50 U.S. cities are tracked.)
Census & demographics
- Population (ZIP)
- 6,120
Population outlook (Monroe County) Hauer SSP2
- Today (2025)
- 47,571 people
- By 2030
- 48,155 · +1.2%
- By 2040
- 48,772 · +2.5%
- By 2050
- 48,698 · +2.4%
- By 2075
- 48,558 · +2.1%
- By 2100
- 47,543 · -0.1%
Race, ethnicity, and origin ACS 2023
- Neighborhood character
- Predominantly White (93%)
- Race & ethnicity
- White 93% Black 3% Two or more races 2% Hispanic / Latino 1%
- Common ancestry
- Romanian 3% Slovak 3% Lithuanian 2%
- Foreign-born
- 2% · Canada
- Languages at home
- 96% English-only · Spanish 2% Arabic 1%
Political lean MEDSL · Monroe
- 2024 margin
- Solid R (+66.8) · D 16.2% · R 83.0%
- 2008→2024 swing
- -28.5pp toward R · 2008: -38.3pp · 2024: -66.8pp
- All cycles
- 2024: R+66.8 2020: R+62.6 2016: R+59.7 2012: R+45.0 2008: R+38.3
Not yet ingested
- Civics
- —
Market trends
- HPI YoY
- ▼ -18.41%
- Current HPI
- 216.947
- Rent YoY
- —
- Metro
- —
- State GDP YoY
- ▲ 2.78%
- F500 in state
- 22
Industry mix (Fortune 500 HQ in TN)
| Industry | F500 HQs | Revenue |
|---|---|---|
| Healthcare | 3 | $91B |
|
||
| Retail | 3 | $72B |
|
||
| Transportation / Logistics | 1 | $88B |
|
||
| Paper / Packaging | 1 | $19B |
|
||
| Insurance | 1 | $13B |
|
||
| Energy | 1 | $12B |
|
||
Price history
2 events — show timeline
- 2026-05-13 Pending — FSBO.com
- 2026-05-12 Listed $40,000 FSBO.com
Property tax history
-0.6%/yrLatest (2025): $240 · +0.0% YoY. Source: county tax records.
Cash-flow waterfall
monthlySold comps — $/sqft
last 12 mo · ≤1 miLoading sold comps…