4705 Gooseberry Trl · Oak Trail Shores, TX
Flood risk 1/10 · Minimal
- FEMA flood zone
- X (unshaded)
- Chance of flooding over 30 yrs
- 0.0%
- Est. flood insurance / yr
- $507 – $1,088
Fire risk 6/10 · Moderate
- Est. fire insurance / yr
- $1,222 – $2,270
Heat risk 7/10 · Major
- Hot days now (above 108°F)
- 6 days/yr
- Hot days in 30 yrs
- 19 days/yr
Wind risk 4/10 · Minor
- Chance of severe wind over 30 yrs
- 24.0%
Air-quality risk 2/10 · Minimal
- Unhealthy air days now
- 1 days/yr
- Unhealthy air days in 30 yrs
- 2 days/yr
Risk factors via First Street. Map © Google.
Why this score? — see what drove the C grade
The composite is a weighted blend of 9 inputs, each scored 0–100. Each bar is that input's sub-score; the figure is the points it added to the 100-point composite (weight × sub-score).
- Cash flow +21.1/30.0
- ARV discount +12.6/15.0
- DSCR +6.7/10.0
- 1% rule +5.0/10.0
- Schools +4.0/10.0
- Livability +2.9/5.0
- Rent growth +2.8/5.0
- Condition / age +2.5/5.0
- Appreciation +0.0/10.0
$189,900
🖨 Deal sheet (PDF) 📄 Offer letter ✓ Due diligence
Listing remarks
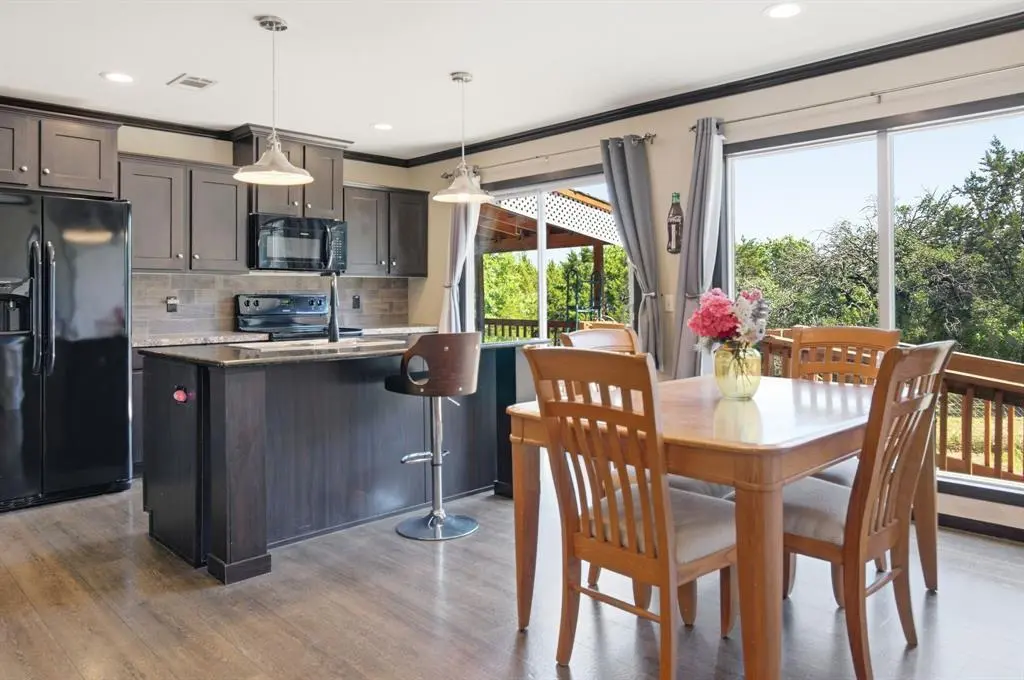
Come check out this inviting 2018 built home near beautiful Lake Granbury! This 3 bedroom, 2 bath home offers the perfect mix of comfort, space, and relaxation. The open-concept layout makes it easy to entertain, while the spacious kitchen island is ready for everything from morning coffee to game nights with friends and family. The private primary suite is the perfect escape with double vanities, a walk-in shower, and a soaking garden tub made for relaxing after a long day. Every bedroom features walk-in closets, plus there’s plenty of extra storage throughout the home. Outside, you’ll love the covered back patio, fenced area, wheelchair ramp, and storage building. And the best
Key facts
- Soaking garden tub
- Walk-in shower
- Double vanities
Tags
Property features AI
Finance
- Financial info: Acceptable financing: Cash, Conventional, FHA, VA
- HOA & community: Mandatory association with Oak Trail Shores; Annual association fee of $96; Association fee covers full use of facilities and management fees
Exterior
- Parking: Detached carport; 2 covered carport spaces; Additional parking on asphalt and gravel
- Security: No specific security systems listed
- Utilities: City water; Septic
- Home design: Manufactured home (residential); One-story; Accessible approach with ramp; Preowned (built in 2018); Property is attached
- Construction: Composition roof; Aluminum siding and board & batten siding; Concrete perimeter foundation; Year built 2018
- Exterior features: Covered porch and covered deck; Gutters; Storage; Chain link fence around back yard
Interior
- Kitchen: Electric cooktop and electric oven; Microwave; Dishwasher; Disposal; Refrigerator; Farm sink; Butler's pantry
- Bedrooms: 3 bedrooms (all on main level); Primary bedroom with walk-in closet; Secondary bedrooms with custom closet systems
- Flooring: Combination of hardwood, carpet, laminate, and luxury vinyl plank
- Bathrooms: 2 full bathrooms; Primary bathroom with dual sinks, separate shower, garden tub, separate vanities, built-in cabinets, and solid-surface counters; Hall bathroom with built-in cabinets, linen closet, and solid-surface counters
- Heating & cooling: Central heating (electric); Central air conditioning (electric); Ceiling fans
- Interior features: Open floorplan with built-in features and paneling; Granite counters and kitchen island; Eat-in kitchen and breakfast bar; Pantry and walk-in pantry; Flat screen wiring and cable TV available; High-speed internet available; Double vanity in primary bath; Built-in cabinets; Linen closet; Window coverings
- Laundry & utility: Laundry room on main level with built-in cabinets and utility closet; Washer and dryer included
Neighborhood map
What this means for you Summary
Snapshot
- This is a 3-bed/2.0-bath manufactured listed at $190k.
Deal economics
- At list price, monthly cash flow is $270 ($3k/yr) — positive.
- The deal already cash-flows at list — no discount required.
- To meet the 1% rule (rent ≥ 1% of price), the offer needs to be $189k (0.5% below list).
- Recommended offer: $189k (0.5% below list) — sets the bar for 1% rule.
- Cap rate 8.0% vs local median 5.9% in Oak Trail Shores — top-decile yield for the area; either an underpriced asset or a hidden risk that comps aren't pricing in. Stress-test before assuming the spread holds.
Location & tenants
- Location reads 58/100 on livability (#1,187 in TX) — a working-class tenant base; expect higher turnover. Strengths: cost of living A+, housing A+, crime B+; Watch: health & safety D+, amenities F, commute F.
- Granbury ISD (town): math 46% / reading 46% proficiency, ranked #237 of 826 in TX (top 29%) — families likely to look elsewhere, expect single-tenant / working-renter base with shorter leases.
- Zoned schools: Nettie Baccus El (math 39% / reading 36%, grade F, #1,744 of 4,322 statewide, top 41%, 466 students, 81% FRL) — zoned schools average 81% FRL vs 43% district-wide (38 pts higher); higher-poverty schools than district average — tighter screening recommended.
- Market conditions: Rents rising (+1.1%/yr); 929 active listings in the ZIP; 3 comparable units currently listed for rent nearby; rentals leasing fast (median 2d on market — plan ~1-2 weeks tenant-placement turnaround); 125 units permitted in Hood County in 2024 (0 in 5+ unit buildings).
- This rent runs 32% of the median local income ($70k/yr) — at the standard rent-burdened threshold; future hikes will face affordability resistance.
Forward outlook
- Local home prices are declining (-3.0%/yr); year-one equity from $1k of loan paydown is wiped out by about $6k of value loss. Plan a longer hold.
- Hood County population projected at +29% by 2050 — long-run rental-demand tailwind backs the buy-and-hold thesis.
Negotiation context
- Only 9 days on market — expect competitive offers; lowballing is unlikely to land.
- 5 sale attempts since 8y ago with the ask held roughly flat each time — persistent listings suggest the price (not the market) is what's stuck; bring a comps-based counter.
Risks & watch-outs
- Climate carrying-cost: major wildfire risk; extreme-heat days projected 6→19/yr by 2055 (HVAC capex compounding) — expect insurance premiums to compound above CPI over the hold.
Questions for the listing agent
- What does the HOA fee cover, when was the last increase, and are there any pending special assessments or reserve-fund shortfalls?
- Is there a deadline driving the sale (1031 exchange, divorce, estate, relocation)? That informs how much negotiation room exists.
- Schools are F-rated, which usually means shorter tenancies and higher turnover. Who's the typical renter profile here, and what's been the actual vacancy rate?
- What's the average days-on-market for RENTAL listings here right now (not sales)? A rising rental-DOM trend means longer vacancies and softer asking-rent achievability than the comps imply.
- What's the recent tenant-quality profile in this submarket — average credit score on applications, eviction rate, late-payment / NSF rate, and stable-employment percentage? A property-management company in the area should have these aggregated.
- How much new for-sale + rental construction is in the pipeline within 1–3 miles? Heavy new supply typically softens prices + rents 12–24 months out; constrained supply supports both.
Investment metrics
- 1% rule
- 1.00% ✗
- Cap rate
- 8.00%
- Cash-on-cash
- 6.10%
- DSCR
- 1.27
- GRM
- 8.4
CMA / ARV
- ARV (on-the-fly)
- $214,368
- Comps found
- 8
Show comp detail 8 sales within ~0.75 mi
| Address | Dist | Beds/Ba | Sqft | Sold | Price | $/sf | Match |
|---|---|---|---|---|---|---|---|
| 3211 Evergreen Dr | 0.18mi | 3/2.0 | 1,706 (+5%) | 7mo | $179,900 | $105 | 77 |
| 4505 Appletree Ct | 0.40mi | 3/2.0 | 1,736 (+7%) | 0mo | $249,900 | $144 | 70 |
| 3101 Hilltop Rd | 0.30mi | 4/2.0 (+1) | 1,768 (+9%) | 0mo | $199,000 | $113 | 66 |
| 4813 Peachtree St | 0.31mi | 4/2.0 (+1) | 1,768 (+9%) | 2mo | $335,000 | $189 | 64 |
| 4424 Poplar Dr | 0.38mi | 3/2.0 | 1,475 (-9%) | 6mo | $189,000 | $128 | 62 |
| 3207 Evergreen Dr | 0.18mi | 3/2.0 | 1,475 (-9%) | 21mo | $194,900 | $132 | 59 |
| 2606 Hilltop Rd | 0.34mi | 3/2.0 | 1,536 (-5%) | 23mo | $165,000 | $107 | 56 |
| 4321 Terri Lee Ln | 0.50mi | 4/2.0 (+1) | 1,387 (-15%) | 20mo | $189,000 | $136 | 31 |
Match score weights: distance 35% · size 25% · config 20% · recency 20%. Top-matched comps best support the ARV.
Projected returns pro-forma
-3.0% appreciation · 1.1% rent growth · sell at horizon
- IRR
- -8.9%
- Equity multiple
- 0.68×
- Total profit
- $-17,128
- Equity at exit
- $28,315
- IRR
- -2.1%
- Equity multiple
- 0.87×
- Total profit
- $-6,859
- Equity at exit
- $16,419
Cash invested: $53,172 (down + closing). Projections, not guarantees.
Landlord ↔ Tenant lean methodology
- Overall (STATE)
- 87 Strongly Landlord-Friendly
- State Texas
- 87 Strongly Landlord-Friendly · R+5
- County
- — inherits STATE
- City
- — inherits STATE
ZIP-level market 76048
- Home prices YoY
- -23.4%
- Rents YoY
- 1.1%
- Active inventory
- 929
- Price-to-rent
- 8.4×
Monthly cashflow live
- Estimated rent
- $1,890 medium interval (Pro) →
- Mortgage (P&I)
- −$996
- Tax from tax record
- −$140 /mo · $1,677/yr
- Insurance
- −$79
- HOA
- −$8
- Vacancy / Maint / Mgmt
- −$397
- Net cashflow
- $270
Break-even live
Sensitivity live
| Price | -10% $378 | -5% $324 | +0% $270 | +5% $217 | +10% $163 |
|---|---|---|---|---|---|
| Rent | -10% $121 | -5% $196 | +0% $270 | +5% $345 | +10% $420 |
| Rate | -1.0pp $366 | -0.5pp $319 | base $270 | +0.5pp $221 | +1.0pp $171 |
UW: 25.0% down · 7.5% · 30yr · 1.5% tax · 5.0% vac · 8.0% maint · 8.0% mgmt
Financing live
Cash to close
- Down payment
- $47,475
- Closing costs
- $5,697
- Reserves months
- —
- Total cash needed
- —
Loan-product check · same deal, 3 products live
Conventional
25% down · 7.5% · 30yr
- Down + closing
- —
- Monthly P&I
- —
- Monthly cashflow
- —
- DSCR
- —
- Eligible?
- —
Personal DTI + credit; lowest rate.
DSCR
20% down · 8.5% · 30yr
- Down + closing
- —
- Monthly P&I
- —
- Monthly cashflow
- —
- DSCR
- —
- Eligible?
- —
No personal income docs; deal must DSCR.
Hard money
10% down · 12.0% · 12mo
- Down + closing
- —
- Monthly P&I
- —
- Monthly cashflow
- —
- DSCR
- —
- Eligible?
- —
Short-term bridge; refi at stabilization.
Rent comps 3 comps
| Address | Beds | Baths | Sqft | Rent | $/sqft | DOM | Units | Dist |
|---|---|---|---|---|---|---|---|---|
| 4321 Terri Lee Ln Granbury, TX | 4.0 | 2.0 | 1387 | $2,075 | $1.50 | 2d | 1 | 0.51mi |
| 5418 Lake View Dr Granbury, TX | 3.0 | 2.0 | 1284 | $1,300 | $1.01 | 44d | 1 | 0.81mi |
| 5609 Arkansas Trl Granbury, TX | 3.0 | 2.0 | 1920 | $1,950 | $1.02 | 2d | 1 | 1.13mi |
HOA detail
- Monthly dues
- $8 · $96/yr
Listing history 21 events
-
2026-05-22historical Active Option Contract
-
2026-05-19$189,900 Active
-
2026-04-27historical
-
2026-04-15price $190,000
-
2026-04-08price $191,000
-
2026-01-14price $198,000
-
2025-10-01price $200,000
-
2025-09-16status Active
-
2025-08-13historical Active Kick-Out
-
2025-07-24price $208,000
-
2025-07-16$205,000 Active
-
2025-06-23historical
-
2025-04-16price $207,000
-
2025-03-07$210,000 Active
-
2018-09-19soldstatus
-
2018-09-18soldstatus Sold
-
2018-08-27status Pending
-
2018-08-15historical Active Option Contract
-
2018-07-08$21,500 Active
-
2002-06-10soldstatus
-
1997-09-22soldstatus
ⓘ Source: listings_history table (triggers on properties + properties_extension) + one-shot
backfill from property_details.listing_events for pre-trigger history.
Tax reassessment forecast TX · Resets to sale price
- Current annual tax
- $1,677 · $140/mo
- Projected year-2 tax
- $3,475 · $290/mo
- Expected delta
- +$1,798/yr (+$150/mo · 107.3%)
ⓘ Screening estimate from a state-policy table — verify with the county assessor before closing.
Climate risk First Street
- Flood 1/10 Low FEMA zone X (unshaded) · 0% chance over 30 yrs
- Wildfire 6/10 Major
- Heat 7/10 Severe 6 d/yr ≥108°F today · 19 d/yr by 30 yrs out
- Wind 4/10 Moderate 24% chance of damaging wind over 30 yrs
- Air quality 2/10 Low 1 unhealthy d/yr today · 2 by 30 yrs out
Nearby sold comps map
Loading sold comps map…
Walkable amenities ~0.75 mi
Loading nearby amenities…
Taxation est. · year 1
- Rental income
- $22,679
- − Mortgage interest
- −$10,637
- − Property taxes
- −$1,677
- − Insurance
- −$950
- − Repairs & maintenance
- −$1,814
- − Management
- −$1,814
- − HOA
- −$96
- − Depreciation
- −$5,524
- Taxable income
- $166
- Est. tax owed @ 24.0%
- −$40
- After-tax cash flow
- $3,204/yr
For passive investors: Depreciation is non-cash, so a rental often shows a tax loss while cash-flowing — sheltering income. Rental losses are passive: they offset passive income freely, and up to $25,000/yr can offset ordinary (W-2) income if you actively participate and your MAGI is under $100k (phasing out to $0 by $150k); unused losses carry forward. On sale, claimed depreciation is recaptured at up to 25%, and gains may owe capital-gains tax (a 1031 exchange can defer both). Figures are a year-1 estimate at your 24.0% rate — not tax advice; consult a CPA.
Schools (NCES district)
- District
- Granbury ISD
- NCES district ID
- 4821390
- Math proficiency
- 46% ▬ 0.00%
- Reading proficiency
- 46% ▲ 4.00%
- Median HH income
- $55,856
- Composite
- 40.04/100
- National rank
- #3820
- State rank
- #237 of 826 in TX
Livability — Oak Trail Shores
- Score
- 58/100
- State rank
- #1187
- US rank
- #20758
Category grades
Schools grade is shown separately in the Schools card above.
Census & demographics
- Census place
- Oak Trail Shores, TX
- County
- Hood County · 58,506 people
- Metro
- Granbury, TX
- Population (ZIP)
- 27,000
- Household income
- $70,346
- Rent vs Own
- Severe rent burden
- 612.0
Population outlook (Hood County) Hauer SSP2
- Today (2025)
- 63,502 people
- By 2030
- 67,459 · +6.2%
- By 2040
- 74,958 · +18.0%
- By 2050
- 81,922 · +29.0%
- By 2075
- 98,872 · +55.7%
- By 2100
- 107,796 · +69.8%
Race, ethnicity, and origin ACS 2023
- Neighborhood character
- Predominantly White (80%)
- Race & ethnicity
- White 80% Hispanic / Latino 14% Two or more races 11% Black 1%
- Hispanic origin (detail)
- Mexican 13%
- Common ancestry
- Italian 2% Slovak 2% Portuguese 1%
- Foreign-born
- 4% · Canada
- Languages at home
- 89% English-only · Spanish 10%
Political lean MEDSL · Hood
- 2024 margin
- Solid R (+66.0) · D 16.6% · R 82.6%
- 2008→2024 swing
- -11.9pp toward R · 2008: -54.0pp · 2024: -66.0pp
- All cycles
- 2024: R+66.0 2020: R+64.1 2016: R+66.5 2012: R+64.7 2008: R+54.0
Not yet ingested
- Civics
- —
Market trends
- HPI YoY
- ▼ -83.25%
- Current HPI
- 272.2126
- Rent YoY
- ▲ 1.10%
- Metro
- Granbury, TX
- State GDP YoY
- ▲ 3.95%
- F500 in state
- 110
Industry mix (Fortune 500 HQ in TX)
| Industry | F500 HQs | Revenue |
|---|---|---|
| Energy | 16 | $1,198B |
|
||
| Technology | 5 | $198B |
|
||
| Engineering / Construction | 4 | $72B |
|
||
| Energy Services | 3 | $60B |
|
||
| Utilities | 3 | $41B |
|
||
| Healthcare | 2 | $330B |
|
||
Price history
+783.3% since first listed21 events — show timeline
- 2026-05-22 Contingent — NTREIS
- 2026-05-19 Listed $189,900 NTREIS
- 2026-04-27 Listing Removed — NTREIS
- 2026-04-15 Price Changed $190,000 NTREIS
- 2026-04-08 Price Changed $191,000 NTREIS
- 2026-01-14 Price Changed $198,000 NTREIS
- 2025-10-01 Price Changed $200,000 NTREIS
- 2025-09-16 Relisted — NTREIS
- 2025-08-13 Contingent — NTREIS
- 2025-07-24 Price Changed $208,000 NTREIS
- 2025-07-16 Listed $205,000 NTREIS
- 2025-06-23 Listing Removed — NTREIS
- 2025-04-16 Price Changed $207,000 NTREIS
- 2025-03-07 Listed $210,000 NTREIS
- 2018-09-19 Sold (Public Records) — Public Records
- 2018-09-18 Sold (MLS) — NTREIS
- 2018-08-27 Pending — NTREIS
- 2018-08-15 Contingent — NTREIS
- 2018-07-08 Listed $21,500 NTREIS
- 2002-06-10 Sold (Public Records) — Public Records
- 1997-09-22 Sold (Public Records) — Public Records
Property tax history
+14.2%/yrLatest (2025): $1,677 · +10.9% YoY. Source: county tax records.
Cash-flow waterfall
monthlySold comps — $/sqft
last 12 mo · ≤1 miLoading sold comps…