 Fourplex
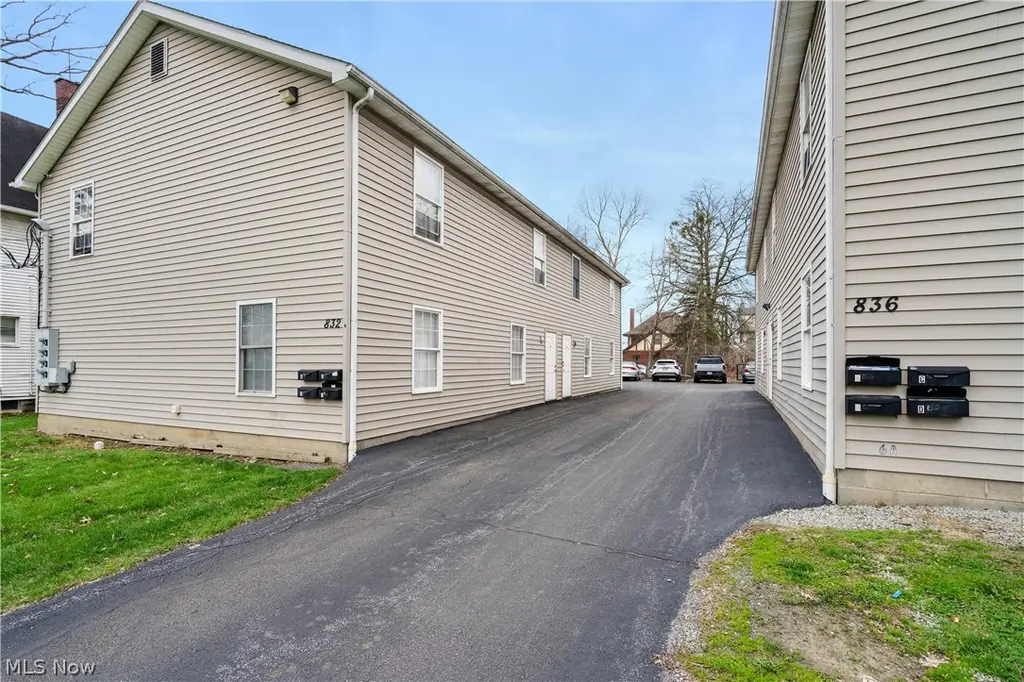
836 Michigan Ave · Youngstown, OH
Flood risk 1/10 · Minimal
- FEMA flood zone
- X (unshaded)
- Chance of flooding over 30 yrs
- 0.0%
- Est. flood insurance / yr
- $507 – $1,088
Fire risk 1/10 · Minimal
- Est. fire insurance / yr
- $713 – $1,323
Heat risk 3/10 · Minor
- Hot days now (above 97°F)
- 7 days/yr
- Hot days in 30 yrs
- 17 days/yr
Wind risk 1/10 · Minimal
- Chance of severe wind over 30 yrs
- —
Air-quality risk 2/10 · Minimal
- Unhealthy air days now
- 1 days/yr
- Unhealthy air days in 30 yrs
- 2 days/yr
Risk factors via First Street. Map © Google.
Why this score? — see what drove the C grade
The composite is a weighted blend of 9 inputs, each scored 0–100. Each bar is that input's sub-score; the figure is the points it added to the 100-point composite (weight × sub-score).
- Cash flow +21.0/30.0
- Appreciation +8.4/10.0
- ARV discount +7.5/15.0
- DSCR +6.7/10.0
- 1% rule +5.3/10.0
- Livability +4.0/5.0
- Rent growth +2.5/5.0
- Condition / age +2.5/5.0
- Schools +0.9/10.0
$334,500
🖨 Deal sheet (PDF) 📄 Offer letter ✓ Due diligence
Multi-family units
County records classify this as Multi-Family (5+ Unit). Listing-text estimate: 4 units. estimate disagrees with records
5+ unit building — per-unit beds/baths from public records are typically unavailable; the breakdown below (if shown) is an estimate from the listing text.
Listing remarks
Excellent investment opportunity featuring two well-maintained 4-plex buildings, totaling 8 apartment units. This property is for sale as a package deal with 832 Michigan Ave, they must be purchased together. Each unit offers 2 bedrooms, 1 bathroom, and approximately 900 square feet of living space, with construction dating back to 2006.The property includes 13 parking spaces conveniently located at the rear. Currently, 6 of the units are rented. One unit has been converted into a shared laundry facility for tenants but can easily be reverted back into an additional apartment to maximize rental income. This property is ideally situated within walking distance to Youngstown State University,
Key facts
- Security system
- View of the stadium
- Storage shed
Tags
Property features AI
Finance
- Financial info: Owner pays all utilities; Units generate rent (example: one unit listed at $1,150/month and noted leased through July 31, 2026); Property contains one building with four two-bedroom units
Exterior
- Parking: Parking lot
- Utilities: Public water; Public sewer; Electric service
- Home design: Two-story building; Above-grade finished area approximately 3,600
- Construction: Vinyl siding; Asphalt roof; Built (year source: public records)
- Exterior features: Parking lot
Interior
- Kitchen: Range; Refrigerator
- Bedrooms: Four two-bedroom units (each unit has 2 bedrooms); Each bedroom in some units includes its own vanity and sink
- Bathrooms: Four full bathrooms (one per unit)
- Heating & cooling: Baseboard electric heating
- Interior features: Eat-in kitchen; Common-area laundry
- Laundry & utility: Common-area laundry; Owner pays all utilities
Neighborhood map
What this means for you Summary
Snapshot
- This is a 4 × 2-bed/1.0-bath units multifamily listed at $334k.
Deal economics
- At list price, monthly cash flow is $470 ($6k/yr) — positive. Per door: $118/mo.
- The deal already cash-flows at list — no discount required.
- Meets the 1% rule at list price ($3k rent vs $334k).
- Recommended offer: $314k (6.0% below list) — sets the bar for market timing.
Location & tenants
- Location reads 81/100 on livability (#99 in OH, #1,506 nationally) — a professional / high-income tenant draw. Strengths: amenities A+, commute A+, cost of living A+; Watch: crime F, employment F.
- Youngstown City (urban): math 8% / reading 17% proficiency, ranked #649 of 656 in OH (top 99%) — low school quality limits family demand, transient renter base, plan for 1-2y turnover; 88% free/reduced lunch — lower-income household profile, screen leases tightly.
- Market conditions: 28 active listings in the ZIP; lower-income renter base — watch delinquency; 147 units permitted in Mahoning County in 2024 (0 in 5+ unit buildings).
- At $3,444/mo this rent would consume 103% of the median local household income ($40k/yr) (locally 16% of renters already pay >50% of income on rent) — very limited rent-growth headroom before tenants either downsize or default.
Forward outlook
- In year one you build about $25k of equity ($2k loan paydown + $22k appreciation (6.7% local appreciation)).
- Mahoning County population projected at -14% by 2050 — secular population decline; favor cash flow + early exit over multi-decade hold.
- At projected returns (6.7% appreciation + 3.0% rent growth), your $94k cash investment doubles in ~3 years — after that, you're playing with house money.
- By year 2, paydown + projected appreciation supports a ~$40k cash-out refi (75% LTV) — recoverable capital for the next deal without selling this one.
Negotiation context
- It's been on market 76 days — a 6% lower offer ($314k) is reasonable based on typical stale-listing flexibility.
- 3 sale attempts since 25y ago with the ask held roughly flat each time — persistent listings suggest the price (not the market) is what's stuck; bring a comps-based counter.
- Current owner paid $10k; list at $334k implies a 3245% gain — meaningful room to come down on a strong offer.
Questions for the listing agent
- It's been on market 76 days. Have you received any prior offers? Is the seller open to a 6% concession, seller financing, or rate buy-down credit?
- Can we see the unit-by-unit rent roll, current vacancy, and any below-market leases? What's the average tenancy length?
- What capital expenditures (roof, boiler, parking lot, exteriors) have been made in the last 5 years, and what's planned in the next 2?
- Why hasn't it sold? Are there any deal-killer items the seller is aware of (foundation, flood, title, zoning, code violations)?
- Is there a deadline driving the sale (1031 exchange, divorce, estate, relocation)? That informs how much negotiation room exists.
- Crime grade is F in this area — have there been break-ins, vandalism, or insurance claims at this property in the last 3 years? What carrier currently insures it and at what premium?
- What's the average days-on-market for RENTAL listings here right now (not sales)? A rising rental-DOM trend means longer vacancies and softer asking-rent achievability than the comps imply.
- What's the recent tenant-quality profile in this submarket — average credit score on applications, eviction rate, late-payment / NSF rate, and stable-employment percentage? A property-management company in the area should have these aggregated.
- How much new apartment / multifamily construction is in the pipeline within 1–3 miles? Heavy new supply (>2% of stock underway) typically softens rents 12–24 months out; light construction supports rent growth.
Investment metrics
- 1% rule
- 1.03% ✓
- Cap rate
- 7.98%
- Cash-on-cash
- 6.03%
- DSCR
- 1.27
- GRM
- 8.1
CMA / ARV
No comps found within radius.
Projected returns pro-forma
6.72% appreciation · 3.0% rent growth · sell at horizon
- IRR
- 21.9%
- Equity multiple
- 2.51×
- Total profit
- $141,073
- Equity at exit
- $225,732
- IRR
- 20.6%
- Equity multiple
- 5.15×
- Total profit
- $388,344
- Equity at exit
- $423,404
Cash invested: $93,660 (down + closing). Projections, not guarantees.
Landlord ↔ Tenant lean methodology
- Overall (STATE)
- 73 Landlord-Friendly
- State Ohio
- 73 Landlord-Friendly · R+6
- County
- — inherits STATE
- City
- — inherits STATE
ZIP-level market 44504
- Home prices YoY
- 4.0%
- Active inventory
- 28
- Price-to-rent
- 32.4×
Monthly cashflow live
- Estimated rent
- $3,444 medium interval (Pro) →
- Mortgage (P&I)
- −$1,754
- Tax from tax record
- −$357 /mo · $4,283/yr
- Insurance
- −$139
- HOA
- −$0
- Vacancy / Maint / Mgmt
- −$723
- Net cashflow
- $470
Break-even live
Sensitivity live
| Price | -10% $660 | -5% $565 | +0% $470 | +5% $376 | +10% $281 |
|---|---|---|---|---|---|
| Rent | -10% $198 | -5% $334 | +0% $470 | +5% $606 | +10% $742 |
| Rate | -1.0pp $639 | -0.5pp $555 | base $470 | +0.5pp $384 | +1.0pp $295 |
4-unit breakdown (identical units grouped — click to expand)
| Units | Beds | Baths | Est. rent |
|---|---|---|---|
| 4× units | 2 | 1 | $3,444 |
| #1 | 2 | 1 | $861 |
| #2 | 2 | 1 | $861 |
| #3 | 2 | 1 | $861 |
| #4 | 2 | 1 | $861 |
| Total (4 units) | $3,444 | ||
UW: 25.0% down · 7.5% · 30yr · 1.5% tax · 5.0% vac · 8.0% maint · 8.0% mgmt
Financing live
Cash to close
- Down payment
- $83,625
- Closing costs
- $10,035
- Reserves months
- —
- Total cash needed
- —
Loan-product check · same deal, 3 products live
Conventional
25% down · 7.5% · 30yr
- Down + closing
- —
- Monthly P&I
- —
- Monthly cashflow
- —
- DSCR
- —
- Eligible?
- —
Personal DTI + credit; lowest rate.
DSCR
20% down · 8.5% · 30yr
- Down + closing
- —
- Monthly P&I
- —
- Monthly cashflow
- —
- DSCR
- —
- Eligible?
- —
No personal income docs; deal must DSCR.
Hard money
10% down · 12.0% · 12mo
- Down + closing
- —
- Monthly P&I
- —
- Monthly cashflow
- —
- DSCR
- —
- Eligible?
- —
Short-term bridge; refi at stabilization.
Listing history 43 events
-
2026-06-19days on market $334,500 Active 76 DOM
-
2026-06-18pricestatus $334,500 Active 75 DOM
-
2026-06-18days on market $337,450 Contingent 75 DOM
-
2026-06-17days on market $337,450 Contingent 74 DOM
-
2026-06-16days on market $337,450 Contingent 73 DOM
-
2026-06-15days on market $337,450 Contingent 72 DOM
-
2026-06-14days on market $337,450 Contingent 70 DOM
-
2026-06-13statusdays on market $337,450 Contingent 69 DOM
-
2026-06-10days on market $337,450 Active 67 DOM
-
2026-06-09days on market $337,450 Active 66 DOM
-
2026-06-08days on market $337,450 Active 65 DOM
-
2026-06-07days on market $337,450 Active 64 DOM
-
2026-06-03days on market $337,450 Active 60 DOM
-
2026-06-02days on market $337,450 Active 59 DOM
-
2026-06-01days on market $337,450 Active 58 DOM
-
2026-05-31days on market $337,450 Active 57 DOM
-
2026-05-30days on market $337,450 Active 56 DOM
-
2026-05-14price $337,450
-
2026-04-03$350,000 Active
-
2025-11-14price $11,000
-
2023-03-30price $11,000
-
2023-03-30price $11,000
-
2023-03-30price $11,000
-
2023-03-30price $11,000
-
2020-08-25price $11,000
-
2020-06-16price $11,000
-
2014-02-12price $11,000
-
2014-02-12price $11,000
-
2014-02-12price $11,000
-
2014-02-12price $489,900
-
2002-08-20soldstatus $10,000
-
2001-12-31historical
-
2001-12-21historical
-
2001-06-21$489,900
-
2001-02-08$19,500
-
2000-06-26price $489,900
-
2000-06-26price $489,900
-
2000-06-26price $489,900
-
2000-06-26price $489,900
-
2000-06-26price $489,900
-
2000-06-26price $489,900
-
2000-06-26price $489,900
-
2000-06-26price $489,900
ⓘ Source: listings_history table (triggers on properties + properties_extension) + one-shot
backfill from property_details.listing_events for pre-trigger history.
Tax reassessment forecast OH · Partial reset (capped growth)
- Current annual tax
- $4,283 · $357/mo
- Projected year-2 tax
- $4,750 · $396/mo
- Expected delta
- +$468/yr (+$39/mo · 10.9%)
ⓘ Screening estimate from a state-policy table — verify with the county assessor before closing.
Climate risk First Street
- Flood 1/10 Low FEMA zone X (unshaded) · 0% chance over 30 yrs
- Wildfire 1/10 Low
- Heat 3/10 Moderate 7 d/yr ≥97°F today · 17 d/yr by 30 yrs out
- Wind 1/10 Low
- Air quality 2/10 Low 1 unhealthy d/yr today · 2 by 30 yrs out
Nearby sold comps map
Loading sold comps map…
Walkable amenities ~0.75 mi
Loading nearby amenities…
Taxation est. · year 1
- Rental income
- $41,328
- − Mortgage interest
- −$18,737
- − Property taxes
- −$4,283
- − Insurance
- −$1,672
- − Repairs & maintenance
- −$3,306
- − Management
- −$3,306
- − Depreciation
- −$9,731
- Taxable income
- $292
- Est. tax owed @ 24.0%
- −$70
- After-tax cash flow
- $5,574/yr
For passive investors: Depreciation is non-cash, so a rental often shows a tax loss while cash-flowing — sheltering income. Rental losses are passive: they offset passive income freely, and up to $25,000/yr can offset ordinary (W-2) income if you actively participate and your MAGI is under $100k (phasing out to $0 by $150k); unused losses carry forward. On sale, claimed depreciation is recaptured at up to 25%, and gains may owe capital-gains tax (a 1031 exchange can defer both). Figures are a year-1 estimate at your 24.0% rate — not tax advice; consult a CPA.
Schools (NCES district)
- District
- Youngstown City
- NCES district ID
- 3904516
- Math proficiency
- 8% ▼ -15.00%
- Reading proficiency
- 17% ▼ -10.00%
- Median HH income
- $25,257
- Composite
- 9.29/100
- National rank
- #9858
- State rank
- #649 of 656 in OH
Livability — Youngstown
- Score
- 81/100
- State rank
- #99
- US rank
- #1506
Category grades
Schools grade is shown separately in the Schools card above.
Census & demographics
- Census place
- Youngstown, OH
- County
- Mahoning · 224,175 people
- City population
- 28,503
- Metro
- Youngstown-Warren, OH
- Population (ZIP)
- 5,185
- Household income
- $40,156
- Rent vs Own
- Severe rent burden
- 15.7
Population outlook (Mahoning County) Hauer SSP2
- Today (2025)
- 223,932 people
- By 2030
- 218,387 · -2.5%
- By 2040
- 205,367 · -8.3%
- By 2050
- 193,606 · -13.5%
- By 2075
- 173,694 · -22.4%
- By 2100
- 151,147 · -32.5%
Race, ethnicity, and origin ACS 2023
- Neighborhood character
- Diverse neighborhood (Simpson 0.65)
- Race & ethnicity
- White 45% Black 38% Two or more races 8% Asian 5% Hispanic / Latino 4%
- Common ancestry
- Italian 4% Serbian 1% Romanian 1%
- Foreign-born
- 7% · Canada, Dominican Republic, South Korea
- Languages at home
- 93% English-only · Other Indo-European 4% Spanish 1%
Political lean MEDSL · Mahoning
- 2024 margin
- Lean R (+9.4) · D 44.9% · R 54.4%
- 2008→2024 swing
- -36.1pp toward R · 2008: 26.6pp · 2024: -9.4pp
- All cycles
- 2024: R+9.4 2020: R+1.9 2016: D+3.0 2012: D+27.7 2008: D+26.6
Not yet ingested
- Civics
- —
Market trends
- HPI YoY
- ▲ 6.72%
- Current HPI
- 174.9495
- Rent YoY
- —
- Metro
- —
- State GDP YoY
- ▲ 1.98%
- F500 in state
- 48
Industry mix (Fortune 500 HQ in OH)
| Industry | F500 HQs | Revenue |
|---|---|---|
| Insurance | 3 | $145B |
|
||
| Industrial Machinery | 3 | $49B |
|
||
| Financial Services | 3 | $24B |
|
||
| Consumer Goods | 2 | $93B |
|
||
| Aerospace / Defense | 2 | $47B |
|
||
| Utilities | 2 | $33B |
|
||
Price history
-31.1% since first listed26 events — show timeline
- 2026-05-14 Price Changed $337,450 MLSNOW
- 2026-04-03 Listed $350,000 MLSNOW
- 2025-11-14 Price Changed $11,000 MLSNOW
- 2023-03-30 Price Changed $11,000 MLSNOW
- 2023-03-30 Price Changed $11,000 MLSNOW
- 2023-03-30 Price Changed $11,000 MLSNOW
- 2023-03-30 Price Changed $11,000 MLSNOW
- 2020-08-25 Price Changed $11,000 MLSNOW
- 2020-06-16 Price Changed $11,000 MLSNOW
- 2014-02-12 Price Changed $489,900 MLSNOW
- 2014-02-12 Price Changed $11,000 MLSNOW
- 2014-02-12 Price Changed $11,000 MLSNOW
- 2014-02-12 Price Changed $11,000 MLSNOW
- 2002-08-20 Sold (Public Records) $10,000 Public Records
- 2001-12-31 Listing Removed — MLSNOW
- 2001-12-21 Listing Removed — MLSNOW
- 2001-06-21 Listed $489,900 MLSNOW
- 2001-02-08 Listed $19,500 MLSNOW
- 2000-06-26 Price Changed $489,900 MLSNOW
- 2000-06-26 Price Changed $489,900 MLSNOW
- 2000-06-26 Price Changed $489,900 MLSNOW
- 2000-06-26 Price Changed $489,900 MLSNOW
- 2000-06-26 Price Changed $489,900 MLSNOW
- 2000-06-26 Price Changed $489,900 MLSNOW
- 2000-06-26 Price Changed $489,900 MLSNOW
- 2000-06-26 Price Changed $489,900 MLSNOW
Property tax history
+10.6%/yrLatest (2025): $4,283 · -9.1% YoY. Source: county tax records.
Cash-flow waterfall
monthlySold comps — $/sqft
last 12 mo · ≤1 miLoading sold comps…