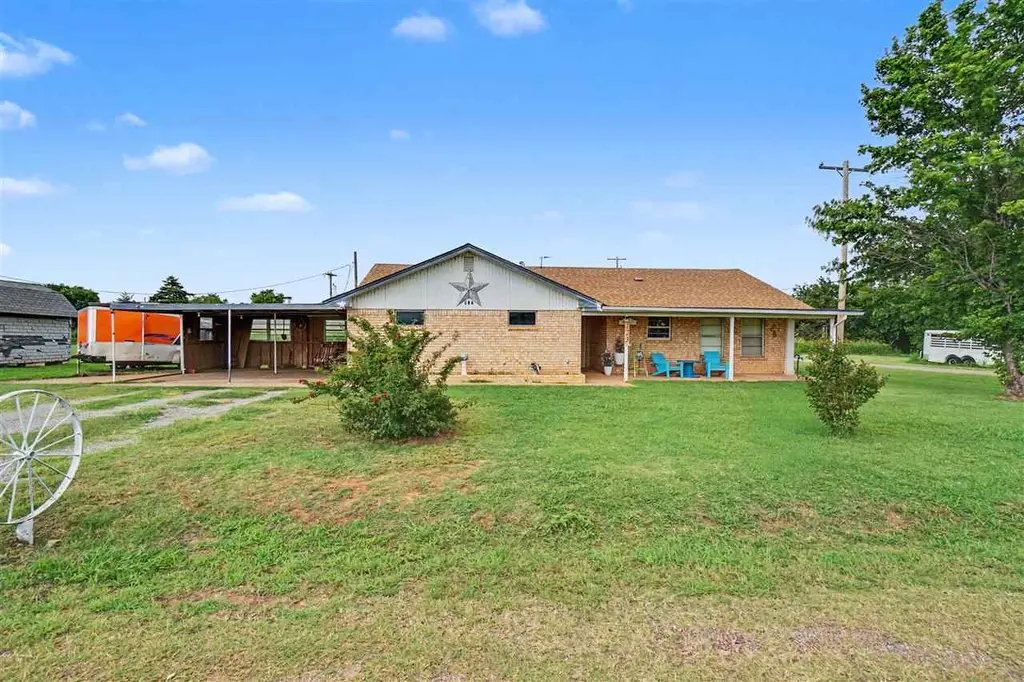
123 2nd St · Manitou, OK
Flood risk 1/10 · Minimal
- FEMA flood zone
- X
- Chance of flooding over 30 yrs
- 0.0%
- Est. flood insurance / yr
- $507 – $1,088
Fire risk 4/10 · Minor
- Est. fire insurance / yr
- $2,463 – $4,575
Heat risk 6/10 · Moderate
- Hot days now (above 108°F)
- 7 days/yr
- Hot days in 30 yrs
- 19 days/yr
Wind risk 3/10 · Minor
- Chance of severe wind over 30 yrs
- 6.0%
Air-quality risk 1/10 · Minimal
- Unhealthy air days now
- 0 days/yr
- Unhealthy air days in 30 yrs
- 0 days/yr
Risk factors via First Street. Map © Google.
Why this score? — see what drove the C grade
The composite is a weighted blend of 9 inputs, each scored 0–100. Each bar is that input's sub-score; the figure is the points it added to the 100-point composite (weight × sub-score).
- Cash flow +24.3/30.0
- DSCR +7.8/10.0
- ARV discount +7.5/15.0
- 1% rule +5.4/10.0
- Appreciation +5.0/10.0
- Livability +2.6/5.0
- Rent growth +2.5/5.0
- Condition / age +2.5/5.0
- Schools +1.6/10.0
$115,900
🖨 Deal sheet 📄 Offer letter ✓ Due diligence
Listing remarks
Small town living at its best! This is a wonderful three bedroom, 1 3/4 bath brick home. The home has some fresh paint, newer carpet in the bedrooms and nearly 1650 SF of space. The kitchen has been updated with newer black appliances, and good looking counter tops and fixtures. The full bath has a whirlpool tub and the bedrooms are spacious. The roof is only 3 1/2 years old and the home sits on 4 lots with a carport, storm cellar and a Florida room. It's right off US HWY 183 and centrally located between Lawton/Ft. Sill and Altus AFB.
Key facts
- Carport
- Florida room
- Brick home
Tags
Property features AI
Exterior
- Parking: No garage; Has carport (1 covered space); Total 1 parking space
- Security: Smoke detector(s)
- Utilities: Public water; Public sewer; Natural gas available
- Home design: Single family residence; One level
- Construction: Brick veneer construction; Slab foundation; Built with composition roof
- Exterior features: Covered patio and porch; Composition roof; Public maintained road access; City street frontage; Lot approximately 100 x 125 (12,500 sq ft / 0.287 acres); R-1 single family zoning
Interior
- Kitchen: Cooktop; Range hood; Gas water heater
- Flooring: Vinyl flooring; Carpet
- Bathrooms: One full bathroom; One three-quarter bathroom
- Heating & cooling: Central heating (natural gas); Central electric air conditioning
- Interior features: Storm windows and window coverings; Smoke detector(s); Therapeutic whirlpool; Shed on property
- Laundry & utility: Washer hookup
Neighborhood map
What this means for you Summary
Snapshot
- This is a 3-bed/2.0-bath single-family listed at $116k.
Deal economics
- At list price, monthly cash flow is $233 ($3k/yr) — positive.
- The deal already cash-flows at list — no discount required.
- Meets the 1% rule at list price ($1k rent vs $116k).
Location & tenants
- Location reads 51/100 on livability (#648 in OK) — a working-class tenant base; expect higher turnover. Strengths: cost of living A+, crime A; Watch: schools D+, amenities F, commute F.
- Tipton (rural): math 15% / reading 15% proficiency, ranked #471 of 513 in OK (top 92%) — low school quality limits family demand, transient renter base, plan for 1-2y turnover; 68% free/reduced lunch — lower-income household profile, screen leases tightly.
- Market conditions: 2 active listings in the ZIP.
Forward outlook
- In year one you build about $4k of equity ($801 loan paydown + $3k appreciation (3.0% local appreciation)).
- Tillman County population projected to shrink 8% by 2050 — rents likely to lag national; underwrite the cash flow, not the appreciation.
- At projected returns (3.0% appreciation + 3.0% rent growth), your $32k cash investment doubles in ~5 years — after that, you're playing with house money.
- By year 8, paydown + projected appreciation supports a ~$32k cash-out refi (75% LTV) — recoverable capital for the next deal without selling this one.
Negotiation context
- Only 2 days on market — expect competitive offers; lowballing is unlikely to land.
- 2 sale attempts with the ask held roughly flat each time — persistent listings suggest the price (not the market) is what's stuck; bring a comps-based counter.
Risks & watch-outs
- Climate carrying-cost: extreme-heat days projected 7→19/yr by 2055 (HVAC capex compounding) — expect insurance premiums to compound above CPI over the hold.
Questions for the listing agent
- Is there a deadline driving the sale (1031 exchange, divorce, estate, relocation)? That informs how much negotiation room exists.
- Schools are D-rated, which usually means shorter tenancies and higher turnover. Who's the typical renter profile here, and what's been the actual vacancy rate?
- What's the average days-on-market for RENTAL listings here right now (not sales)? A rising rental-DOM trend means longer vacancies and softer asking-rent achievability than the comps imply.
- What's the recent tenant-quality profile in this submarket — average credit score on applications, eviction rate, late-payment / NSF rate, and stable-employment percentage? A property-management company in the area should have these aggregated.
- How much new for-sale + rental construction is in the pipeline within 1–3 miles? Heavy new supply typically softens prices + rents 12–24 months out; constrained supply supports both.
Investment metrics
- 1% rule
- 1.04% ✓
- Cap rate
- 8.70%
- Cash-on-cash
- 8.60%
- DSCR
- 1.38
- GRM
- 8.0
CMA / ARV
No comps found within radius.
Projected returns pro-forma
3.0% appreciation · 3.0% rent growth · sell at horizon
- IRR
- 15.5%
- Equity multiple
- 1.89×
- Total profit
- $28,739
- Equity at exit
- $52,114
- IRR
- 17.2%
- Equity multiple
- 3.51×
- Total profit
- $81,523
- Equity at exit
- $80,313
Cash invested: $32,452 (down + closing). Projections, not guarantees.
Landlord ↔ Tenant lean methodology
- Overall (STATE)
- 83 Strongly Landlord-Friendly
- State Oklahoma
- 83 Strongly Landlord-Friendly · R+20
- County
- — inherits STATE
- City
- — inherits STATE
ZIP-level market 73555
- Active inventory
- 2
- Price-to-rent
- 8.0×
Monthly cashflow live
- Estimated rent
- $1,201 medium interval (Pro) →
- Mortgage (P&I)
- −$608
- Tax from tax record
- −$60 /mo · $720/yr
- Insurance
- −$48
- HOA
- −$0
- Vacancy / Maint / Mgmt
- −$252
- Net cashflow
- $233
Break-even live
UW: 25.0% down · 7.5% · 30yr · 1.5% tax · 5.0% vac · 8.0% maint · 8.0% mgmt
Financing live
Cash to close
- Down payment
- $28,975
- Closing costs
- $3,477
- Reserves months
- —
- Total cash needed
- —
Loan-product check · same deal, 3 products live
Conventional
25% down · 7.5% · 30yr
- Down + closing
- —
- Monthly P&I
- —
- Monthly cashflow
- —
- DSCR
- —
- Eligible?
- —
Personal DTI + credit; lowest rate.
DSCR
20% down · 8.5% · 30yr
- Down + closing
- —
- Monthly P&I
- —
- Monthly cashflow
- —
- DSCR
- —
- Eligible?
- —
No personal income docs; deal must DSCR.
Hard money
10% down · 12.0% · 12mo
- Down + closing
- —
- Monthly P&I
- —
- Monthly cashflow
- —
- DSCR
- —
- Eligible?
- —
Short-term bridge; refi at stabilization.
Listing history 3 events
-
2026-06-18days on market $115,900 Active 2 DOM
-
2026-06-17remarks 541-char remark
-
2026-06-17$115,900 Active 1 DOM
ⓘ Source: listings_history table (triggers on properties + properties_extension) + one-shot
backfill from property_details.listing_events for pre-trigger history.
Tax reassessment forecast OK · Resets to sale price
- Current annual tax
- $720 · $60/mo
- Projected year-2 tax
- $1,043 · $87/mo
- Expected delta
- +$323/yr (+$27/mo · 44.9%)
ⓘ Screening estimate from a state-policy table — verify with the county assessor before closing.
Climate risk First Street
- Flood 1/10 Low FEMA zone X · 0% chance over 30 yrs
- Wildfire 4/10 Moderate
- Heat 6/10 Major 7 d/yr ≥108°F today · 19 d/yr by 30 yrs out
- Wind 3/10 Moderate 6% chance of damaging wind over 30 yrs
- Air quality 1/10 Low 0 unhealthy d/yr today · 0 by 30 yrs out
Nearby sold comps map
Loading sold comps map…
Walkable amenities ~0.75 mi
Loading nearby amenities…
Taxation est. · year 1
- Rental income
- $14,410
- − Mortgage interest
- −$6,492
- − Property taxes
- −$720
- − Insurance
- −$580
- − Repairs & maintenance
- −$1,153
- − Management
- −$1,153
- − Depreciation
- −$3,372
- Taxable income
- $941
- Est. tax owed @ 24.0%
- −$226
- After-tax cash flow
- $2,565/yr
For passive investors: Depreciation is non-cash, so a rental often shows a tax loss while cash-flowing — sheltering income. Rental losses are passive: they offset passive income freely, and up to $25,000/yr can offset ordinary (W-2) income if you actively participate and your MAGI is under $100k (phasing out to $0 by $150k); unused losses carry forward. On sale, claimed depreciation is recaptured at up to 25%, and gains may owe capital-gains tax (a 1031 exchange can defer both). Figures are a year-1 estimate at your 24.0% rate — not tax advice; consult a CPA.
Schools (NCES district)
- District
- Tipton
- NCES district ID
- 4030030
- Math proficiency
- 15% ▬ 0.00%
- Reading proficiency
- 15% ▼ -10.00%
- Median HH income
- $38,655
- Composite
- 16.13/100
- National rank
- #14284
- State rank
- #471 of 513 in OK
Livability — Manitou
- Score
- 51/100
- State rank
- #648
- US rank
- #25139
Category grades
Schools grade is shown separately in the Schools card above.
Census & demographics
- Census place
- Manitou, OK
- Population (ZIP)
- 235
Population outlook (Tillman County) Hauer SSP2
- Today (2025)
- 6,949 people
- By 2030
- 6,737 · -3.1%
- By 2040
- 6,402 · -7.9%
- By 2050
- 6,364 · -8.4%
- By 2075
- 7,335 · +5.6%
- By 2100
- 9,166 · +31.9%
Race, ethnicity, and origin ACS 2023
- Neighborhood character
- Diverse neighborhood (Simpson 0.64)
- Race & ethnicity
- White 57% Two or more races 22% Hispanic / Latino 17% Native American 7% Black 7%
- Hispanic origin (detail)
- Mexican 4% Puerto Rican 8%
- Common ancestry
- Slovak 3% Scottish 2% Iranian 1%
- Languages at home
- 97% English-only · Spanish 3%
Political lean MEDSL · Tillman
- 2024 margin
- Solid R (+59.5) · D 19.7% · R 79.2% · Other 1.1%
- 2008→2024 swing
- -23.8pp toward R · 2008: -35.6pp · 2024: -59.5pp
- All cycles
- 2024: R+59.5 2020: R+54.6 2016: R+47.6 2012: R+33.4 2008: R+35.6
Not yet ingested
- Civics
- —
Market trends
- HPI YoY
- —
- Current HPI
- —
- Rent YoY
- —
- Metro
- —
- State GDP YoY
- ▲ 1.55%
- F500 in state
- 6
Industry mix (Fortune 500 HQ in OK)
| Industry | F500 HQs | Revenue |
|---|---|---|
| Energy | 3 | $48B |
|
||
Price history
+0.0% since first listed2 events — show timeline
- 2026-06-12 Listed $115,900 LBRMLS
- 2025-09-23 Listed $115,900 LBRMLS
Property tax history
+3.4%/yrLatest (2025): $720 · +17.1% YoY. Source: county tax records.
Cash-flow waterfall
monthlySold comps — $/sqft
last 12 mo · ≤1 miLoading sold comps…