None · Olmsted Falls, OH
Flood risk No data
- FEMA flood zone
- —
- Chance of flooding over 30 yrs
- —
- Est. flood insurance / yr
- —
Fire risk No data
- Est. fire insurance / yr
- —
Heat risk No data
- Hot days now (above threshold)
- —
- Hot days in 30 yrs
- —
Wind risk No data
- Chance of severe wind over 30 yrs
- —
Air-quality risk No data
- Unhealthy air days now
- —
- Unhealthy air days in 30 yrs
- —
Risk factors via First Street. Map © Google.
Why this score? — see what drove the B grade
The composite is a weighted blend of 9 inputs, each scored 0–100. Each bar is that input's sub-score; the figure is the points it added to the 100-point composite (weight × sub-score).
- Cash flow +30.0/30.0
- 1% rule +10.0/10.0
- DSCR +10.0/10.0
- ARV discount +7.5/15.0
- Schools +6.1/10.0
- Livability +3.7/5.0
- Rent growth +2.5/5.0
- Condition / age +2.5/5.0
- Appreciation +0.0/10.0
$107,000
🖨 Deal sheet 📄 Offer letter ✓ Due diligence
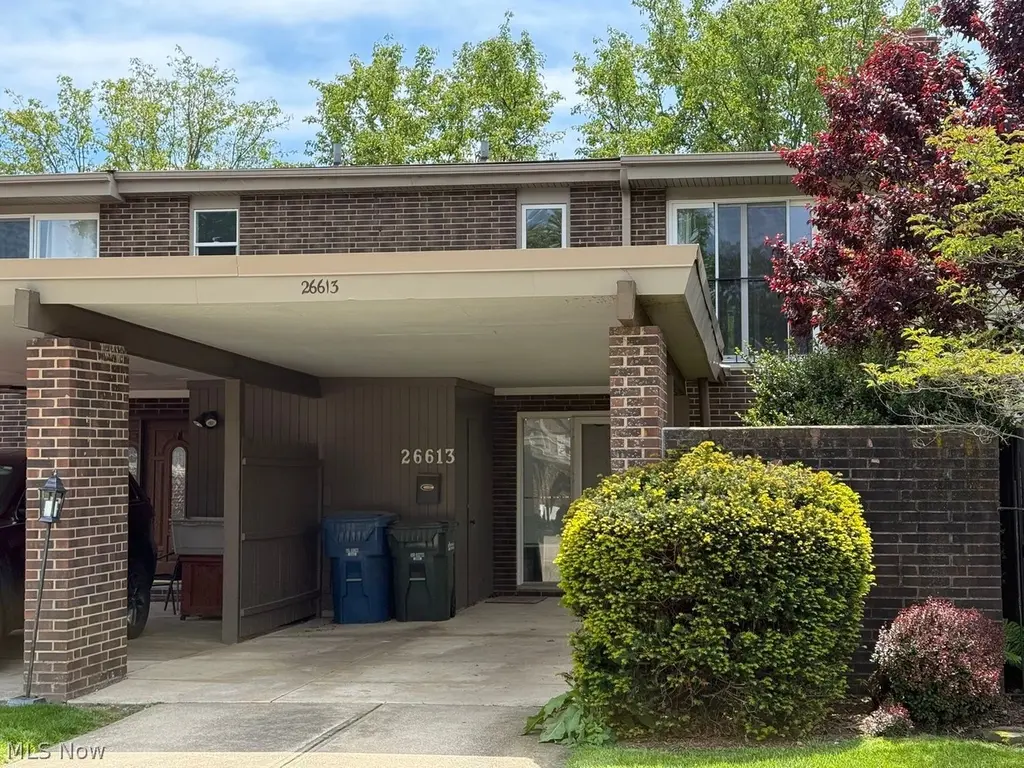
Listing remarks MLS
Lovely Olmsted Townhouse Condo * Open And Airy With Eat-in Kitchen * Slider From Dining Room To Cute Patio * Furnace And Central Air '93 * In-suite Laundry * Swimming Pool In Complex $150 Fee For Summer * Great Neighborhood And Top Notch Schools *
Key facts
- Open-concept
- Community pool
- Gas stove
Tags
Neighborhood map
What this means for you Summary
Snapshot
- This is a 3-bed/1.5-bath condo listed at $107k.
Deal economics
- At list price, monthly cash flow is $402 ($5k/yr) — positive.
- The deal already cash-flows at list — no discount required.
- Meets the 1% rule at list price ($2k rent vs $107k).
- Cap rate 10.8% vs local median 4.2% in Olmsted Falls — top-decile yield for the area; either an underpriced asset or a hidden risk that comps aren't pricing in. Stress-test before assuming the spread holds.
Location & tenants
- Location reads 73/100 on livability (#343 in OH) — a middle-class / working-renter tenant base. Strengths: schools A+, crime A+, employment A+; Watch: amenities F, commute F, health & safety F.
- Olmsted Falls City (suburban): math 70% / reading 70% proficiency, ranked #134 of 656 in OH (top 20%) — strong family-tenant draw, lease renewals of 3-5y typical; only 13% free/reduced lunch — higher-income household profile.
- Market conditions: 183 active listings in the ZIP; 5 comparable units currently listed for rent nearby; rentals leasing fast (median 3d on market — plan ~1-2 weeks tenant-placement turnaround); solid renter incomes; 1,441 units permitted in Cuyahoga County in 2024 (700 in 5+ unit buildings).
Forward outlook
- Local home prices are declining (-3.0%/yr); year-one equity from $740 of loan paydown is wiped out by about $3k of value loss. Plan a longer hold.
- Cuyahoga County population projected to shrink 8% by 2050 — rents likely to lag national; underwrite the cash flow, not the appreciation.
- At projected returns (-3.0% appreciation + 3.0% rent growth), your $30k cash investment doubles in ~8 years — after that, you're playing with house money.
Negotiation context
- Only 4 days on market — expect competitive offers; lowballing is unlikely to land.
- 4 sale attempts since 30y ago with the ask held roughly flat each time — persistent listings suggest the price (not the market) is what's stuck; bring a comps-based counter.
- Current owner paid $90k; 18% above their basis — modest negotiation headroom, anchor on the comps not their cost.
Questions for the listing agent
- Built in 1967 — when were the roof, HVAC, electrical panel, plumbing, and water heater last replaced?
- What does the HOA fee cover, when was the last increase, and are there any pending special assessments or reserve-fund shortfalls?
- Any open or pending special assessments — roof, HVAC, plumbing, elevator, façade? What's the per-unit balance and payoff schedule, and is the seller paying it off at close or rolling it to the buyer?
- Is there a deadline driving the sale (1031 exchange, divorce, estate, relocation)? That informs how much negotiation room exists.
- Schools are A-rated — typically a magnet for longer-tenancy family renters. What's the average tenant stay here, and is there a school-zone premium baked into asking?
- What's the average days-on-market for RENTAL listings here right now (not sales)? A rising rental-DOM trend means longer vacancies and softer asking-rent achievability than the comps imply.
- What's the recent tenant-quality profile in this submarket — average credit score on applications, eviction rate, late-payment / NSF rate, and stable-employment percentage? A property-management company in the area should have these aggregated.
- How much new apartment / multifamily construction is in the pipeline within 1–3 miles? Heavy new supply (>2% of stock underway) typically softens rents 12–24 months out; light construction supports rent growth.
Investment metrics
- 1% rule
- 1.66% ✓
- Cap rate
- 10.80%
- Cash-on-cash
- 16.10%
- DSCR
- 1.72
- GRM
- 5.0
CMA / ARV
No comps found within radius.
Projected returns pro-forma
-3.0% appreciation · 3.0% rent growth · sell at horizon
- IRR
- 7.2%
- Equity multiple
- 1.28×
- Total profit
- $8,442
- Equity at exit
- $15,954
- IRR
- 16.6%
- Equity multiple
- 2.37×
- Total profit
- $41,065
- Equity at exit
- $9,251
Cash invested: $29,960 (down + closing). Projections, not guarantees.
Landlord ↔ Tenant lean methodology
- Overall (STATE)
- 73 Landlord-Friendly
- State Ohio
- 73 Landlord-Friendly · R+6
- County
- — inherits STATE
- City
- — inherits STATE
ZIP-level market 44138
- Home prices YoY
- -30.8%
- Active inventory
- 183
- Price-to-rent
- 5.0×
Monthly cashflow live
- Estimated rent
- $1,774 high interval (Pro) →
- Mortgage (P&I)
- −$561
- Tax est. 1.5%
- −$134 /mo · $1,605/yr
- Insurance
- −$45
- HOA
- −$260
- Vacancy / Maint / Mgmt
- −$372
- Net cashflow
- $402
Break-even live
UW: 25.0% down · 7.5% · 30yr · 1.5% tax · 5.0% vac · 8.0% maint · 8.0% mgmt
Financing live
Cash to close
- Down payment
- $26,750
- Closing costs
- $3,210
- Reserves months
- —
- Total cash needed
- —
Loan-product check · same deal, 3 products live
Conventional
25% down · 7.5% · 30yr
- Down + closing
- —
- Monthly P&I
- —
- Monthly cashflow
- —
- DSCR
- —
- Eligible?
- —
Personal DTI + credit; lowest rate.
DSCR
20% down · 8.5% · 30yr
- Down + closing
- —
- Monthly P&I
- —
- Monthly cashflow
- —
- DSCR
- —
- Eligible?
- —
No personal income docs; deal must DSCR.
Hard money
10% down · 12.0% · 12mo
- Down + closing
- —
- Monthly P&I
- —
- Monthly cashflow
- —
- DSCR
- —
- Eligible?
- —
Short-term bridge; refi at stabilization.
Rent comps 5 comps
| Address | Beds | Baths | Sqft | Rent | $/sqft | DOM | Units | Dist |
|---|---|---|---|---|---|---|---|---|
| 9582 Fernwood Dr Olmsted Falls, OH | 3.0 | 1.5 | 1320 | $1,795 | $1.36 | 23d | 1 | 0.13mi |
| 26747 Sprague Rd Olmsted Falls, OH | 2.0 | 1.5 | 1144 | $1,500 | $1.31 | 43d | 1 | 0.35mi |
| 9299 Columbia Rd Olmsted Falls, OH | 1.0–2.0 | 1.0–1.5 | 782 | $2,120 | $2.71 | 1d | 1 | 0.85mi |
| 26875 Bagley Rd Olmsted Twp, OH | 1.0–3.0 | 1.0–2.0 | 890 | $1,299 | $1.46 | 2d | 1 | 1.09mi |
| 8450 Daylily DR Olmsted Falls, OH | 2.0–3.0 | 2.5 | 1541 | $2,680 | $1.74 | 1d | 10 | 1.35mi |
HOA detail condo
- Monthly dues
- $260 · $3,120/yr
- Likely covers
- pool
- Assessments
- None detected in remarks — confirm with the listing agent.
Listing history 14 events
-
2026-05-21status Pending
-
2026-05-16$107,000 Active
-
2009-02-04historical
-
2008-08-04$108,500
-
2005-03-22soldstatus $90,300 247-char remark
Show marketing remark (247 chars)
Lovely Olmsted Townhouse Condo * Open And Airy With Eat-in Kitchen * Slider From Dining Room To Cute Patio * Furnace And Central Air '93 * In-suite Laundry * Swimming Pool In Complex $150 Fee For Summer * Great Neighborhood And Top Notch Schools *
-
2005-03-22soldstatus $90,300
Show marketing remark (247 chars)
Lovely Olmsted Townhouse Condo * Open And Airy With Eat-in Kitchen * Slider From Dining Room To Cute Patio * Furnace And Central Air '93 * In-suite Laundry * Swimming Pool In Complex $150 Fee For Summer * Great Neighborhood And Top Notch Schools *
-
2004-06-21$89,900 247-char remark
Show marketing remark (247 chars)
Lovely Olmsted Townhouse Condo * Open And Airy With Eat-in Kitchen * Slider From Dining Room To Cute Patio * Furnace And Central Air '93 * In-suite Laundry * Swimming Pool In Complex $150 Fee For Summer * Great Neighborhood And Top Notch Schools *
-
1996-04-09soldstatus $72,000
-
1996-04-08soldstatus $72,000
-
1996-02-17$74,900
-
1989-10-27soldstatus $55,000
-
1982-04-29soldstatus $41,500
-
1979-10-12soldstatus $45,900
-
1978-06-01soldstatus $37,700
ⓘ Source: listings_history table (triggers on properties + properties_extension) + one-shot
backfill from property_details.listing_events for pre-trigger history.
Nearby sold comps map
Loading sold comps map…
Walkable amenities ~0.75 mi
Loading nearby amenities…
Taxation est. · year 1
- Rental income
- $21,286
- − Mortgage interest
- −$5,994
- − Property taxes
- −$1,605
- − Insurance
- −$535
- − Repairs & maintenance
- −$1,703
- − Management
- −$1,703
- − HOA
- −$3,120
- − Depreciation
- −$3,113
- Taxable income
- $3,514
- Est. tax owed @ 24.0%
- −$843
- After-tax cash flow
- $3,979/yr
For passive investors: Depreciation is non-cash, so a rental often shows a tax loss while cash-flowing — sheltering income. Rental losses are passive: they offset passive income freely, and up to $25,000/yr can offset ordinary (W-2) income if you actively participate and your MAGI is under $100k (phasing out to $0 by $150k); unused losses carry forward. On sale, claimed depreciation is recaptured at up to 25%, and gains may owe capital-gains tax (a 1031 exchange can defer both). Figures are a year-1 estimate at your 24.0% rate — not tax advice; consult a CPA.
Schools (NCES district)
- District
- Olmsted Falls City
- NCES district ID
- 3904657
- Math proficiency
- 70% ▼ -14.00%
- Reading proficiency
- 70% ▼ -10.00%
- Median HH income
- $68,307
- Composite
- 61.12/100
- National rank
- #787
- State rank
- #134 of 656 in OH
Livability — Olmsted Falls
- Score
- 73/100
- State rank
- #343
- US rank
- #5595
Category grades
Schools grade is shown separately in the Schools card above.
Census & demographics
- Census place
- Olmsted Falls, OH
- County
- Cuyahoga · 1,045,444 people
- Metro
- Cleveland, OH
- Population (ZIP)
- 23,129
- Household income
- $93,877
- Rent vs Own
- Severe rent burden
- 7.6
Population outlook (Cuyahoga County) Hauer SSP2
- Today (2025)
- 1,244,621 people
- By 2030
- 1,230,093 · -1.2%
- By 2040
- 1,189,108 · -4.5%
- By 2050
- 1,145,706 · -7.9%
- By 2075
- 1,076,557 · -13.5%
- By 2100
- 978,987 · -21.3%
Race, ethnicity, and origin ACS 2023
- Neighborhood character
- Predominantly White (85%)
- Race & ethnicity
- White 85% Hispanic / Latino 9% Two or more races 6% Black 3% Asian 2%
- Hispanic origin (detail)
- Mexican 3% Puerto Rican 3%
- Common ancestry
- Romanian 9% Slovak 2% Lithuanian 1%
- Foreign-born
- 6% · Canada, Jamaica, China
- Languages at home
- 93% English-only · Spanish 4% Other Indo-European 1% Arabic 1%
Political lean MEDSL · Cuyahoga
- 2024 margin
- Solid D (+31.5) · D 65.4% · R 33.9%
- 2008→2024 swing
- -7.4pp toward R · 2008: 38.9pp · 2024: 31.5pp
- All cycles
- 2024: D+31.5 2020: D+34.1 2016: D+35.0 2012: D+38.7 2008: D+38.9
Not yet ingested
- Civics
- —
Market trends
- HPI YoY
- ▼ -89.76%
- Current HPI
- 201.9716
- Rent YoY
- —
- Metro
- —
- State GDP YoY
- ▲ 1.98%
- F500 in state
- 48
Industry mix (Fortune 500 HQ in OH)
| Industry | F500 HQs | Revenue |
|---|---|---|
| Insurance | 3 | $145B |
|
||
| Industrial Machinery | 3 | $49B |
|
||
| Financial Services | 3 | $24B |
|
||
| Consumer Goods | 2 | $93B |
|
||
| Aerospace / Defense | 2 | $47B |
|
||
| Utilities | 2 | $33B |
|
||
Price history
+183.8% since first listed14 events — show timeline
- 2026-05-21 Pending — MLSNOW
- 2026-05-16 Listed $107,000 MLSNOW
- 2009-02-04 Listing Removed — MLSNOW
- 2008-08-04 Listed $108,500 MLSNOW
- 2005-03-22 Sold (Public Records) $90,300 Public Records
- 2005-03-22 Sold (MLS) $90,300 MLSNOW
- 2004-06-21 Listed $89,900 MLSNOW
- 1996-04-09 Sold (Public Records) $72,000 Public Records
- 1996-04-08 Sold (MLS) $72,000 MLSNOW
- 1996-02-17 Listed $74,900 MLSNOW
- 1989-10-27 Sold (Public Records) $55,000 Public Records
- 1982-04-29 Sold (Public Records) $41,500 Public Records
- 1979-10-12 Sold (Public Records) $45,900 Public Records
- 1978-06-01 Sold (Public Records) $37,700 Public Records
Property tax history
+10.2%/yrLatest (2025): $6,213 · +107.5% YoY. Source: county tax records.
Cash-flow waterfall
monthlySold comps — $/sqft
last 12 mo · ≤1 miLoading sold comps…