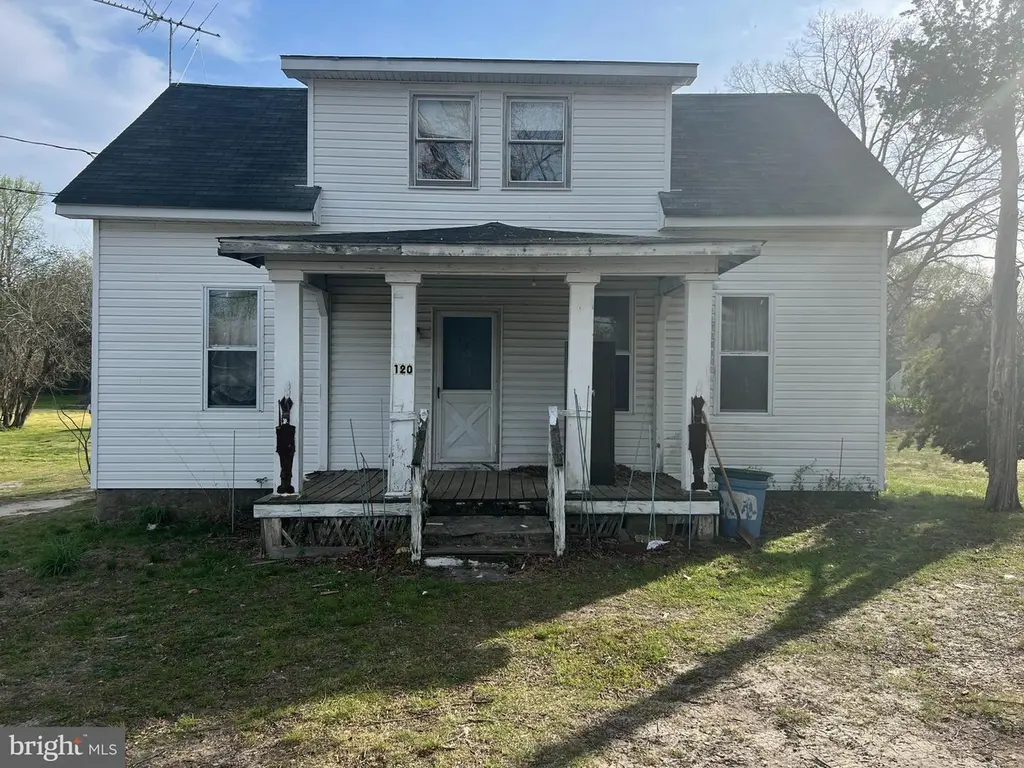
120 High St · Leesburg, NJ
Flood risk 5/10 · Moderate
- FEMA flood zone
- X (unshaded)
- Chance of flooding over 30 yrs
- 0.41%
- Est. flood insurance / yr
- $507 – $1,088
Fire risk 5/10 · Moderate
- Est. fire insurance / yr
- $526 – $976
Heat risk 7/10 · Major
- Hot days now (above 101°F)
- 7 days/yr
- Hot days in 30 yrs
- 16 days/yr
Wind risk 8/10 · Major
- Chance of severe wind over 30 yrs
- 80.0%
Air-quality risk 3/10 · Minor
- Unhealthy air days now
- 3 days/yr
- Unhealthy air days in 30 yrs
- 5 days/yr
Risk factors via First Street. Map © Google.
Why this score? — see what drove the B grade
The composite is a weighted blend of 9 inputs, each scored 0–100. Each bar is that input's sub-score; the figure is the points it added to the 100-point composite (weight × sub-score).
- Cash flow +30.0/30.0
- 1% rule +10.0/10.0
- DSCR +10.0/10.0
- ARV discount +7.5/15.0
- Appreciation +3.9/10.0
- Rent growth +2.5/5.0
- Livability +2.5/5.0
- Condition / age +2.5/5.0
- Schools +2.4/10.0
$110,000
🖨 Deal sheet 📄 Offer letter ✓ Due diligence
Listing remarks
Charming 1928 Cape Cod in Leesburg, located in Maurice River Township, offering a great opportunity for investors or buyers ready to bring a home back to life. This 2-bedroom, 1-bath property features classic character and a traditional layout. Property will require updates and repairs to restore it to its full potential. An unfinished attic provides excellent potential for additional living space, perfect for a bonus room, office, or expanded bedroom area. The property also includes a detached 2-car garage, offering ample storage or workspace. This is a true fixer-upper being sold strictly as-is. The buyer is responsible for all inspections, certifications, and repairs. The seller makes no
Key facts
- Unfinished attic
- Detached garage
- 0.5 acre lot
Tags
Property features AI
Finance
- Other: Fee simple ownership
Exterior
- Parking: Detached front-entry garage with 2 spaces
- Utilities: Natural gas; Well water; Septic
- Home design: Detached structure; Frame construction
- Construction: Block foundation; Above-grade and below-grade structures
- Exterior features: Well water; Septic system
Interior
- Bedrooms: 2 bedrooms on the main level
- Bathrooms: 1 full bathroom on the main level
- Heating & cooling: 90% forced air heating (natural gas); Window unit cooling; Natural gas hot water
- Interior features: Partial basement
Neighborhood map
What this means for you Summary
Snapshot
- This is a 2-bed/1.0-bath single-family listed at $110k.
Deal economics
- At list price, monthly cash flow is $517 ($6k/yr) — positive.
- The deal already cash-flows at list — no discount required.
- Meets the 1% rule at list price ($2k rent vs $110k).
- Recommended offer: $108k (1.5% below list) — sets the bar for market timing.
Location & tenants
- Location reads: area grade B — affects rentability + tenant quality, not the cash-flow math above.
- Maurice River Township School District (rural): math 14% / reading 37% proficiency, ranked #376 of 472 in NJ (top 80%) — low school quality limits family demand, transient renter base, plan for 1-2y turnover.
- Market conditions: 10 active listings in the ZIP; 1 comparable units currently listed for rent nearby; 216 units permitted in Cumberland County in 2024 (73 in 5+ unit buildings).
Forward outlook
- Local home prices are declining (-2.2%/yr); year-one equity from $761 of loan paydown is wiped out by about $2k of value loss. Plan a longer hold.
- Cumberland County population projected to shrink 7% by 2050 — rents likely to lag national; underwrite the cash flow, not the appreciation.
- At projected returns (-2.2% appreciation + 3.0% rent growth), your $31k cash investment doubles in ~6 years — after that, you're playing with house money.
Negotiation context
- It's been on market 25 days — a 2% lower offer ($108k) is reasonable based on typical stale-listing flexibility.
Risks & watch-outs
- Watch-outs: property tax is 3.5% of price; built in 1928 — expect roof / HVAC / electrical / plumbing capex.
- Climate carrying-cost: moderate flood risk; severe wind risk, 80% chance of damaging wind over 30y; moderate wildfire risk; extreme-heat days projected 7→16/yr by 2055 (HVAC capex compounding) — expect insurance premiums to compound above CPI over the hold.
Questions for the listing agent
- Built in 1928 — when were the roof, HVAC, electrical panel, plumbing, and water heater last replaced?
- Property tax is high relative to price — has the assessment been appealed recently, and will the sale trigger a re-assessment?
- Is there a deadline driving the sale (1031 exchange, divorce, estate, relocation)? That informs how much negotiation room exists.
- What's the average days-on-market for RENTAL listings here right now (not sales)? A rising rental-DOM trend means longer vacancies and softer asking-rent achievability than the comps imply.
- What's the recent tenant-quality profile in this submarket — average credit score on applications, eviction rate, late-payment / NSF rate, and stable-employment percentage? A property-management company in the area should have these aggregated.
- How much new for-sale + rental construction is in the pipeline within 1–3 miles? Heavy new supply typically softens prices + rents 12–24 months out; constrained supply supports both.
Investment metrics
- 1% rule
- 1.68% ✓
- Cap rate
- 11.94%
- Cash-on-cash
- 20.16%
- DSCR
- 1.90
- GRM
- 5.0
CMA / ARV
- ARV (on-the-fly)
- $260,032
- Comps found
- 2
Show comp detail 2 sales within ~0.75 mi
| Address | Dist | Beds/Ba | Sqft | Sold | Price | $/sf | Match |
|---|---|---|---|---|---|---|---|
| 110 High St | 0.07mi | 3/1.0 (+1) | 1,094 (+1%) | 24mo | $229,900 | $210 | 71 |
| 69 High St | 0.50mi | 3/1.0 (+1) | 1,126 (+4%) | 3mo | $269,520 | $239 | 64 |
Match score weights: distance 35% · size 25% · config 20% · recency 20%. Top-matched comps best support the ARV.
Projected returns pro-forma
-2.16% appreciation · 3.0% rent growth · sell at horizon
- IRR
- 14.7%
- Equity multiple
- 1.62×
- Total profit
- $19,168
- Equity at exit
- $20,554
- IRR
- 22.3%
- Equity multiple
- 3.05×
- Total profit
- $63,143
- Equity at exit
- $16,799
Cash invested: $30,800 (down + closing). Projections, not guarantees.
Landlord ↔ Tenant lean methodology
- Overall (STATE)
- 21 Tenant-Leaning
- State New Jersey
- 21 Tenant-Leaning · D+6
- County
- — inherits STATE
- City
- — inherits STATE
ZIP-level market 08327
- Home prices YoY
- -1.3%
- Active inventory
- 10
- Price-to-rent
- 5.0×
Monthly cashflow live
- Estimated rent
- $1,850 medium interval (Pro) →
- Mortgage (P&I)
- −$577
- Tax from tax record
- −$321 /mo · $3,858/yr
- Insurance
- −$46
- HOA
- −$0
- Vacancy / Maint / Mgmt
- −$388
- Net cashflow
- $517
Break-even live
UW: 25.0% down · 7.5% · 30yr · 1.5% tax · 5.0% vac · 8.0% maint · 8.0% mgmt
Financing live
Cash to close
- Down payment
- $27,500
- Closing costs
- $3,300
- Reserves months
- —
- Total cash needed
- —
Loan-product check · same deal, 3 products live
Conventional
25% down · 7.5% · 30yr
- Down + closing
- —
- Monthly P&I
- —
- Monthly cashflow
- —
- DSCR
- —
- Eligible?
- —
Personal DTI + credit; lowest rate.
DSCR
20% down · 8.5% · 30yr
- Down + closing
- —
- Monthly P&I
- —
- Monthly cashflow
- —
- DSCR
- —
- Eligible?
- —
No personal income docs; deal must DSCR.
Hard money
10% down · 12.0% · 12mo
- Down + closing
- —
- Monthly P&I
- —
- Monthly cashflow
- —
- DSCR
- —
- Eligible?
- —
Short-term bridge; refi at stabilization.
Rent comps 1 comps
| Address | Beds | Baths | Sqft | Rent | $/sqft | DOM | Units | Dist |
|---|---|---|---|---|---|---|---|---|
| 10 Broad St Unit 2 Millville, NJ | 2.0 | 2.0 | 1000 | $1,850 | $1.85 | 44d | 1 | 0.26mi |
Listing history 2 events
-
2026-05-12status Pending
-
2026-04-17$110,000 Active
ⓘ Source: listings_history table (triggers on properties + properties_extension) + one-shot
backfill from property_details.listing_events for pre-trigger history.
Tax reassessment forecast NJ · Partial reset (capped growth)
- Current annual tax
- $3,858 · $321/mo
- Projected year-2 tax
- $3,858 · $321/mo
- Expected delta
- $0/yr ($0/mo · 0.0%)
ⓘ Screening estimate from a state-policy table — verify with the county assessor before closing.
Climate risk First Street
- Flood 5/10 Major FEMA zone X (unshaded) · 41% chance over 30 yrs
- Wildfire 5/10 Major
- Heat 7/10 Severe 7 d/yr ≥101°F today · 16 d/yr by 30 yrs out
- Wind 8/10 Severe 80% chance of damaging wind over 30 yrs
- Air quality 3/10 Moderate 3 unhealthy d/yr today · 5 by 30 yrs out
Nearby sold comps map
Loading sold comps map…
Walkable amenities ~0.75 mi
Loading nearby amenities…
Taxation est. · year 1
- Rental income
- $22,200
- − Mortgage interest
- −$6,162
- − Property taxes
- −$3,858
- − Insurance
- −$550
- − Repairs & maintenance
- −$1,776
- − Management
- −$1,776
- − Depreciation
- −$3,200
- Taxable income
- $4,878
- Est. tax owed @ 24.0%
- −$1,171
- After-tax cash flow
- $5,037/yr
For passive investors: Depreciation is non-cash, so a rental often shows a tax loss while cash-flowing — sheltering income. Rental losses are passive: they offset passive income freely, and up to $25,000/yr can offset ordinary (W-2) income if you actively participate and your MAGI is under $100k (phasing out to $0 by $150k); unused losses carry forward. On sale, claimed depreciation is recaptured at up to 25%, and gains may owe capital-gains tax (a 1031 exchange can defer both). Figures are a year-1 estimate at your 24.0% rate — not tax advice; consult a CPA.
Schools (NCES district)
- District
- Maurice River Township School District
- NCES district ID
- 3409780
- Math proficiency
- 14% ▼ -13.00%
- Reading proficiency
- 37% ▼ -3.00%
- Median HH income
- $64,846
- Composite
- 23.8/100
- National rank
- #7810
- State rank
- #376 of 472 in NJ
Livability — Leesburg
No livability data for this city. (Only ~50 U.S. cities are tracked.)
Census & demographics
- Census place
- Leesburg, NJ
- Population (ZIP)
- 3,505
Population outlook (Cumberland County) Hauer SSP2
- Today (2025)
- 152,743 people
- By 2030
- 150,373 · -1.6%
- By 2040
- 146,881 · -3.8%
- By 2050
- 142,653 · -6.6%
- By 2075
- 129,468 · -15.2%
- By 2100
- 107,456 · -29.6%
Race, ethnicity, and origin ACS 2023
- Neighborhood character
- Diverse neighborhood (Simpson 0.65)
- Race & ethnicity
- Black 45% White 29% Hispanic / Latino 26%
- Hispanic origin (detail)
- Mexican 3% Puerto Rican 9% Dominican 3%
- Common ancestry
- Slovak 1% Romanian 1%
- Foreign-born
- 10% · Canada
- Languages at home
- 83% English-only · Spanish 16% Arabic 1%
Political lean MEDSL · Cumberland
- 2024 margin
- Toss-up / Even · D 47.6% · R 51.3% · Other 1.1%
- 2008→2024 swing
- -25.4pp toward R · 2008: 21.6pp · 2024: -3.8pp
- All cycles
- 2024: R+3.8 2020: D+6.0 2016: D+5.3 2012: D+23.1 2008: D+21.6
Not yet ingested
- Civics
- —
Market trends
- HPI YoY
- ▼ -2.16%
- Current HPI
- 167.7001
- Rent YoY
- —
- Metro
- —
- State GDP YoY
- ▲ 2.05%
- F500 in state
- 34
Industry mix (Fortune 500 HQ in NJ)
| Industry | F500 HQs | Revenue |
|---|---|---|
| Consumer Goods | 3 | $31B |
|
||
| Pharmaceuticals | 2 | $153B |
|
||
| Technology | 2 | $21B |
|
||
| Insurance | 2 | $20B |
|
||
| Healthcare | 2 | $19B |
|
||
| Financial Services | 1 | $70B |
|
||
Price history
2 events — show timeline
- 2026-05-12 Pending — BRIGHT MLS
- 2026-04-17 Listed $110,000 BRIGHT MLS
Property tax history
+1.5%/yrLatest (2025): $3,858 · -0.5% YoY. Source: county tax records.
Cash-flow waterfall
monthlySold comps — $/sqft
last 12 mo · ≤1 miLoading sold comps…