 Duplex
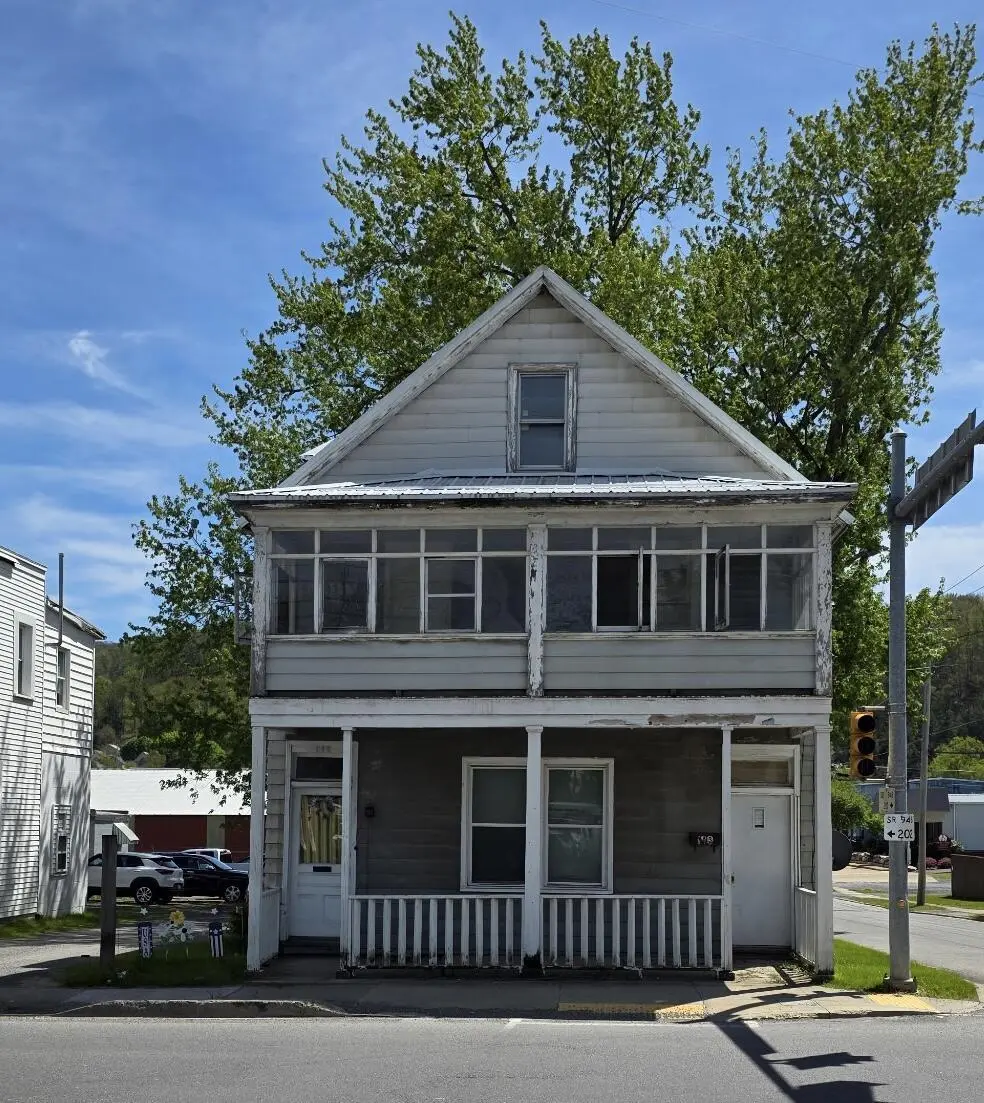
143-145 W Main St · Ridgway, PA
Flood risk 7/10 · Major
- FEMA flood zone
- AE
- Chance of flooding over 30 yrs
- 0.76%
- Est. flood insurance / yr
- $1,737 – $8,500
Fire risk 2/10 · Minimal
- Est. fire insurance / yr
- $511 – $949
Heat risk 3/10 · Minor
- Hot days now (above 89°F)
- 8 days/yr
- Hot days in 30 yrs
- 21 days/yr
Wind risk 2/10 · Minimal
- Chance of severe wind over 30 yrs
- —
Air-quality risk 2/10 · Minimal
- Unhealthy air days now
- 0 days/yr
- Unhealthy air days in 30 yrs
- 1 days/yr
Risk factors via First Street. Map © Google.
Why this score? — see what drove the A- grade
The composite is a weighted blend of 9 inputs, each scored 0–100. Each bar is that input's sub-score; the figure is the points it added to the 100-point composite (weight × sub-score).
- Cash flow +30.0/30.0
- 1% rule +10.0/10.0
- DSCR +10.0/10.0
- Appreciation +10.0/10.0
- ARV discount +7.5/15.0
- Schools +5.1/10.0
- Livability +3.3/5.0
- Rent growth +2.5/5.0
- Condition / age +2.2/5.0
$89,000
🖨 Deal sheet 📄 Offer letter ✓ Due diligence
Multi-family units
County records classify this as Multi-Family (2-4 Unit). Listing-text estimate: 2 units. confirmed
Listing remarks
Investment opportunity featuring a two-story duplex with both units currently rented. The upper unit offers 1 bedrooms and 1 full bath, 2 rooms in the attic for additional storage. While the lower unit also includes 2 bedrooms and 1 full bath. Call today for details.
Key facts
- 3,920 sq ft lot
- Built 1920
- Listed 30 days
Property features AI
Finance
- Other: Zoned Other
- Financial info: Annual property tax approximately $666.76
Exterior
- Home design: Multi-family residential income property
- Exterior features: Lot measures approximately 24 x 180 (about 0.09 acres)
Neighborhood map
What this means for you Summary
Snapshot
- This is a 1×1bd/1ba + 1×2bd/1ba units multifamily listed at $89k. Condition is rated fair.
Deal economics
- At list price, monthly cash flow is $570 ($7k/yr) — positive. Per door: $285/mo.
- The deal already cash-flows at list — no discount required.
- Meets the 1% rule at list price ($2k rent vs $89k).
- Recommended offer: $88k (1.5% below list) — sets the bar for market timing.
Location & tenants
- Location reads 66/100 on livability (#1,032 in PA) — a middle-class / working-renter tenant base. Strengths: crime A+, cost of living A+, schools A; Watch: health & safety D, amenities F, commute F.
- Ridgway Area SD (town): math 53% / reading 68% proficiency, ranked #79 of 539 in PA (top 15%) — acceptable for families but not a draw, mixed tenant base, ~2y average lease.
- Market conditions: 25 active listings in the ZIP; 53 units permitted in Elk County in 2024 (0 in 5+ unit buildings).
Forward outlook
- In year one you build about $10k of equity ($615 loan paydown + $9k appreciation (10.0% local appreciation)).
- Elk County population projected at -27% by 2050 — secular population decline; favor cash flow + early exit over multi-decade hold.
- At projected returns (10.0% appreciation + 3.0% rent growth), your $25k cash investment doubles in ~2 years — after that, you're playing with house money.
- By year 4, paydown + projected appreciation supports a ~$34k cash-out refi (75% LTV) — recoverable capital for the next deal without selling this one.
Negotiation context
- It's been on market 30 days — a 2% lower offer ($88k) is reasonable based on typical stale-listing flexibility.
Risks & watch-outs
- Watch-outs: flood insurance adds $427/mo; built in 1920 — expect roof / HVAC / electrical / plumbing capex.
- Climate carrying-cost: in FEMA flood zone AE (mandatory federal flood insurance) — expect insurance premiums to compound above CPI over the hold.
Questions for the listing agent
- Can we see the unit-by-unit rent roll, current vacancy, and any below-market leases? What's the average tenancy length?
- What capital expenditures (roof, boiler, parking lot, exteriors) have been made in the last 5 years, and what's planned in the next 2?
- Have any recent inspections been done? Can we get a copy of the seller's disclosures and any deferred-maintenance estimates?
- Built in 1920 — when were the roof, HVAC, electrical panel, plumbing, and water heater last replaced?
- What's the actual annual flood-insurance premium (NFIP or private), and is the property in a SFHA with mandatory coverage?
- Is there a deadline driving the sale (1031 exchange, divorce, estate, relocation)? That informs how much negotiation room exists.
- Schools are A-rated — typically a magnet for longer-tenancy family renters. What's the average tenant stay here, and is there a school-zone premium baked into asking?
- What's the average days-on-market for RENTAL listings here right now (not sales)? A rising rental-DOM trend means longer vacancies and softer asking-rent achievability than the comps imply.
- What's the recent tenant-quality profile in this submarket — average credit score on applications, eviction rate, late-payment / NSF rate, and stable-employment percentage? A property-management company in the area should have these aggregated.
- How much new apartment / multifamily construction is in the pipeline within 1–3 miles? Heavy new supply (>2% of stock underway) typically softens rents 12–24 months out; light construction supports rent growth.
Investment metrics
- 1% rule
- 2.29% ✓
- Cap rate
- 19.73%
- Cash-on-cash
- 47.99%
- DSCR
- 3.14
- GRM
- 3.6
CMA / ARV
No comps found within radius.
Projected returns pro-forma
10.0% appreciation · 3.0% rent growth · sell at horizon
- IRR
- 45.2%
- Equity multiple
- 4.41×
- Total profit
- $85,068
- Equity at exit
- $80,178
- IRR
- 39.2%
- Equity multiple
- 9.93×
- Total profit
- $222,545
- Equity at exit
- $172,907
Cash invested: $24,920 (down + closing). Projections, not guarantees.
Landlord ↔ Tenant lean methodology
- Overall (STATE)
- 62 Landlord-Friendly
- State Pennsylvania
- 62 Landlord-Friendly · EVEN
- County
- — inherits STATE
- City
- — inherits STATE
ZIP-level market 15853
- Home prices YoY
- 9.2%
- Active inventory
- 25
- Price-to-rent
- 7.3×
Monthly cashflow live
- Estimated rent
- $2,040 medium interval (Pro) →
- Mortgage (P&I)
- −$467
- Tax est. 1.5%
- −$111 /mo · $1,335/yr
- Insurance
- −$37
- Flood insurance flood zone
- −$427 /mo · $5,118/yr
- HOA
- −$0
- Vacancy / Maint / Mgmt
- −$428
- Net cashflow
- $570
Break-even live
2-unit breakdown (identical units grouped — click to expand)
| Units | Beds | Baths | Est. rent |
|---|---|---|---|
| 1× unit | 1 | 1 | $1,019 |
| 1× unit | 2 | 1 | $1,021 |
| Total (2 units) | $2,040 | ||
UW: 25.0% down · 7.5% · 30yr · 1.5% tax · 5.0% vac · 8.0% maint · 8.0% mgmt
Financing live
Cash to close
- Down payment
- $22,250
- Closing costs
- $2,670
- Reserves months
- —
- Total cash needed
- —
Loan-product check · same deal, 3 products live
Conventional
25% down · 7.5% · 30yr
- Down + closing
- —
- Monthly P&I
- —
- Monthly cashflow
- —
- DSCR
- —
- Eligible?
- —
Personal DTI + credit; lowest rate.
DSCR
20% down · 8.5% · 30yr
- Down + closing
- —
- Monthly P&I
- —
- Monthly cashflow
- —
- DSCR
- —
- Eligible?
- —
No personal income docs; deal must DSCR.
Hard money
10% down · 12.0% · 12mo
- Down + closing
- —
- Monthly P&I
- —
- Monthly cashflow
- —
- DSCR
- —
- Eligible?
- —
Short-term bridge; refi at stabilization.
Listing history 14 events
-
2026-06-18days on market $89,000 Active 30 DOM
-
2026-06-17days on market $89,000 Active 29 DOM
-
2026-06-16days on market $89,000 Active 28 DOM
-
2026-06-15days on market $89,000 Active 27 DOM
-
2026-06-13days on market $89,000 Active 25 DOM
-
2026-06-12days on market $89,000 Active 24 DOM
-
2026-06-09days on market $89,000 Active 21 DOM
-
2026-06-08days on market $89,000 Active 20 DOM
-
2026-06-08days on market $89,000 Active 19 DOM
-
2026-06-04days on market $89,000 Active 15 DOM
-
2026-06-02days on market $89,000 Active 14 DOM
-
2026-06-01days on market $89,000 Active 13 DOM
-
2026-05-31days on market $89,000 Active 12 DOM
-
2026-05-19$101,000 Active
ⓘ Source: listings_history table (triggers on properties + properties_extension) + one-shot
backfill from property_details.listing_events for pre-trigger history.
Climate risk First Street
- Flood 7/10 Severe FEMA zone AE · 76% chance over 30 yrs
- Wildfire 2/10 Low
- Heat 3/10 Moderate 8 d/yr ≥89°F today · 21 d/yr by 30 yrs out
- Wind 2/10 Low
- Air quality 2/10 Low 0 unhealthy d/yr today · 1 by 30 yrs out
Nearby sold comps map
Loading sold comps map…
Walkable amenities ~0.75 mi
Loading nearby amenities…
Taxation est. · year 1
- Rental income
- $24,480
- − Mortgage interest
- −$4,985
- − Property taxes
- −$1,335
- − Insurance
- −$5,564
- − Repairs & maintenance
- −$1,958
- − Management
- −$1,958
- − Depreciation
- −$2,589
- Taxable income
- $6,090
- Est. tax owed @ 24.0%
- −$1,462
- After-tax cash flow
- $5,378/yr
For passive investors: Depreciation is non-cash, so a rental often shows a tax loss while cash-flowing — sheltering income. Rental losses are passive: they offset passive income freely, and up to $25,000/yr can offset ordinary (W-2) income if you actively participate and your MAGI is under $100k (phasing out to $0 by $150k); unused losses carry forward. On sale, claimed depreciation is recaptured at up to 25%, and gains may owe capital-gains tax (a 1031 exchange can defer both). Figures are a year-1 estimate at your 24.0% rate — not tax advice; consult a CPA.
Condition & rehab AI · 4 photos
This two-story duplex requires significant exterior repairs and maintenance, including painting and roof replacement. These updates will significantly improve its value and make it more attractive to potential buyers or renters.
Repairs flagged
- Major roof — Signs of wear and tear are visible, indicating a major repair or replacement is needed.
- Major exterior siding — The siding is weathered and peeling, indicating a major repair or replacement is needed.
Value-add opportunities
- Both Painting the exterior and roof — Painting the exterior and roof will improve the curb appeal and increase both resale and rental value.
Renovation cost estimate screening
| Repair item | Severity | Est. cost |
|---|---|---|
| roof · Signs of wear and tear are visible, indicating a major repair or replacement is needed. | Major | $15,000–50,000 |
| exterior siding · The siding is weathered and peeling, indicating a major repair or replacement is needed. | Major | $15,000–50,000 |
| Total estimated repair cost · 2 items | $30,000–100,000 |
Value-add ROI direction
- Both Painting the exterior and roof — Painting the exterior and roof will improve the curb appeal and increase both resale and rental value. ↑
ⓘ Cost ranges are severity-bucket heuristics (US national rule-of-thumb). Get contractor quotes + a written scope before underwriting a rehab budget.
Schools (NCES district)
- District
- Ridgway Area SD
- NCES district ID
- 4220310
- Math proficiency
- 53% ▼ -8.00%
- Reading proficiency
- 68% ▼ -4.00%
- Median HH income
- $43,406
- Composite
- 50.8/100
- National rank
- #1807
- State rank
- #79 of 539 in PA
Livability — Ridgway
- Score
- 66/100
- State rank
- #1032
- US rank
- #11497
Category grades
Schools grade is shown separately in the Schools card above.
Census & demographics
- Census place
- Ridgway, PA
- Population (ZIP)
- 6,330
Population outlook (Elk County) Hauer SSP2
- Today (2025)
- 28,567 people
- By 2030
- 27,172 · -4.9%
- By 2040
- 24,111 · -15.6%
- By 2050
- 20,967 · -26.6%
- By 2075
- 15,355 · -46.2%
- By 2100
- 10,418 · -63.5%
Race, ethnicity, and origin ACS 2023
- Neighborhood character
- Predominantly White (95%)
- Race & ethnicity
- White 95% Two or more races 4%
- Common ancestry
- Romanian 7% Lithuanian 2% Italian 2%
- Foreign-born
- 1% · China
Political lean MEDSL · Elk
- 2024 margin
- Solid R (+47.0) · D 26.1% · R 73.1%
- 2008→2024 swing
- -51.3pp toward R · 2008: 4.3pp · 2024: -47.0pp
- All cycles
- 2024: R+47.0 2020: R+45.1 2016: R+43.8 2012: R+15.7 2008: D+4.3
Not yet ingested
- Civics
- —
Market trends
- HPI YoY
- ▲ 10.34%
- Current HPI
- 122.9988
- Rent YoY
- —
- Metro
- —
- State GDP YoY
- ▲ 1.68%
- F500 in state
- 34
Industry mix (Fortune 500 HQ in PA)
| Industry | F500 HQs | Revenue |
|---|---|---|
| Healthcare | 2 | $309B |
|
||
| Insurance | 2 | $27B |
|
||
| Telecommunications / Media | 1 | $124B |
|
||
| Industrial Distribution | 1 | $22B |
|
||
| Financial Services | 1 | $20B |
|
||
| Chemicals / Materials | 1 | $18B |
|
||
Price history
1 event — show timeline
- 2026-05-19 Listed $101,000 ECBR
Cash-flow waterfall
monthlySold comps — $/sqft
last 12 mo · ≤1 miLoading sold comps…