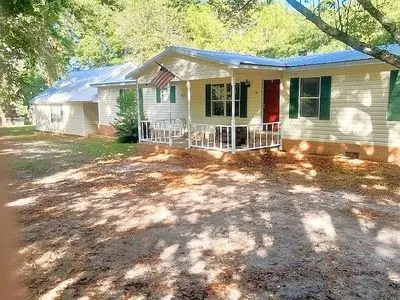
512 Center St · Level Plains, AL
Flood risk 1/10 · Minimal
- FEMA flood zone
- X (unshaded)
- Chance of flooding over 30 yrs
- 0.0%
- Est. flood insurance / yr
- $507 – $1,088
Fire risk 3/10 · Minor
- Est. fire insurance / yr
- $916 – $1,700
Heat risk 8/10 · Major
- Hot days now (above 106°F)
- 7 days/yr
- Hot days in 30 yrs
- 20 days/yr
Wind risk 9/10 · Severe
- Chance of severe wind over 30 yrs
- 99.0%
Air-quality risk 2/10 · Minimal
- Unhealthy air days now
- 0 days/yr
- Unhealthy air days in 30 yrs
- 1 days/yr
Risk factors via First Street. Map © Google.
Why this score? — see what drove the C grade
The composite is a weighted blend of 9 inputs, each scored 0–100. Each bar is that input's sub-score; the figure is the points it added to the 100-point composite (weight × sub-score).
- Cash flow +24.9/30.0
- DSCR +8.1/10.0
- ARV discount +7.5/15.0
- 1% rule +5.2/10.0
- Rent growth +3.5/5.0
- Livability +2.8/5.0
- Condition / age +2.5/5.0
- Schools +2.0/10.0
- Appreciation +0.0/10.0
$174,900
🖨 Deal sheet 📄 Offer letter ✓ Due diligence
Listing remarks
3/2 ON ONE ACRE With 600-700 sf garage/shop mancave. Large flat lot is Great for contractor, trucker (right on County rd 1 on the corner, easy in, easy out 2 driveways), 2 year old metal roof on house and garage. Massive living room and MBR suite with closet the size of a small bedroom. Carpet replaced and lvp installed 2 years ago. Soaker tube and shower in mbr. 2 car garage shop has an office. Convenient to Ft Rucker, Daleville. Owner finance available. Don& apos; t miss! This one will go quickly. !!!
Key facts
- 600-700 sf garage
- 2 car garage shop
- Large flat lot
Tags
Neighborhood map
What this means for you Summary
Snapshot
- This is a 3-bed/2.0-bath land listed at $175k.
Deal economics
- At list price, monthly cash flow is $375 ($5k/yr) — positive.
- The deal already cash-flows at list — no discount required.
- Meets the 1% rule at list price ($2k rent vs $175k).
Location & tenants
- Location reads 55/100 on livability (#438 in AL) — a working-class tenant base; expect higher turnover. Strengths: cost of living A+, housing A+; Watch: health & safety D, schools F, crime F.
- Daleville City (town): math 9% / reading 37% proficiency, ranked #97 of 129 in AL (top 75%) — low school quality limits family demand, transient renter base, plan for 1-2y turnover; 62% free/reduced lunch — lower-income household profile, screen leases tightly.
- Market conditions: Rents rising (+3.9%/yr); 441 active listings in the ZIP; 1 comparable units currently listed for rent nearby; solid renter incomes; 38 units permitted in Dale County in 2024 (0 in 5+ unit buildings).
Forward outlook
- Local home prices are declining (-3.0%/yr); year-one equity from $1k of loan paydown is wiped out by about $5k of value loss. Plan a longer hold.
- Dale County population projected at -20% by 2050 — secular population decline; favor cash flow + early exit over multi-decade hold.
Negotiation context
- Only 6 days on market — expect competitive offers; lowballing is unlikely to land.
- 6 sale attempts since 18y ago with the ask held roughly flat each time — persistent listings suggest the price (not the market) is what's stuck; bring a comps-based counter.
- Current owner paid $83k; list at $175k implies a 110% gain — meaningful room to come down on a strong offer.
Risks & watch-outs
- Climate carrying-cost: severe wind risk, 99% chance of damaging wind over 30y; extreme-heat days projected 7→20/yr by 2055 (HVAC capex compounding) — expect insurance premiums to compound above CPI over the hold.
Questions for the listing agent
- Is there a deadline driving the sale (1031 exchange, divorce, estate, relocation)? That informs how much negotiation room exists.
- Schools are F-rated, which usually means shorter tenancies and higher turnover. Who's the typical renter profile here, and what's been the actual vacancy rate?
- Crime grade is F in this area — have there been break-ins, vandalism, or insurance claims at this property in the last 3 years? What carrier currently insures it and at what premium?
- What's the average days-on-market for RENTAL listings here right now (not sales)? A rising rental-DOM trend means longer vacancies and softer asking-rent achievability than the comps imply.
- What's the recent tenant-quality profile in this submarket — average credit score on applications, eviction rate, late-payment / NSF rate, and stable-employment percentage? A property-management company in the area should have these aggregated.
- How much new for-sale + rental construction is in the pipeline within 1–3 miles? Heavy new supply typically softens prices + rents 12–24 months out; constrained supply supports both.
Investment metrics
- 1% rule
- 1.02% ✓
- Cap rate
- 8.87%
- Cash-on-cash
- 9.19%
- DSCR
- 1.41
- GRM
- 8.2
CMA / ARV
No comps found within radius.
Projected returns pro-forma
-3.0% appreciation · 3.92% rent growth · sell at horizon
- IRR
- -1.5%
- Equity multiple
- 0.94×
- Total profit
- $-2,864
- Equity at exit
- $26,078
- IRR
- 9.0%
- Equity multiple
- 1.71×
- Total profit
- $34,891
- Equity at exit
- $15,122
Cash invested: $48,972 (down + closing). Projections, not guarantees.
Landlord ↔ Tenant lean methodology
- Overall (STATE)
- 90 Strongly Landlord-Friendly
- State Alabama
- 90 Strongly Landlord-Friendly · R+15
- County
- — inherits STATE
- City
- — inherits STATE
ZIP-level market 36330
- Home prices YoY
- -19.4%
- Rents YoY
- 3.9%
- Active inventory
- 441
- Price-to-rent
- 8.2×
Monthly cashflow live
- Estimated rent
- $1,779 medium interval (Pro) →
- Mortgage (P&I)
- −$917
- Tax from tax record
- −$40 /mo · $481/yr
- Insurance
- −$73
- HOA
- −$0
- Vacancy / Maint / Mgmt
- −$374
- Net cashflow
- $375
Break-even live
UW: 25.0% down · 7.5% · 30yr · 1.5% tax · 5.0% vac · 8.0% maint · 8.0% mgmt
Financing live
Cash to close
- Down payment
- $43,725
- Closing costs
- $5,247
- Reserves months
- —
- Total cash needed
- —
Loan-product check · same deal, 3 products live
Conventional
25% down · 7.5% · 30yr
- Down + closing
- —
- Monthly P&I
- —
- Monthly cashflow
- —
- DSCR
- —
- Eligible?
- —
Personal DTI + credit; lowest rate.
DSCR
20% down · 8.5% · 30yr
- Down + closing
- —
- Monthly P&I
- —
- Monthly cashflow
- —
- DSCR
- —
- Eligible?
- —
No personal income docs; deal must DSCR.
Hard money
10% down · 12.0% · 12mo
- Down + closing
- —
- Monthly P&I
- —
- Monthly cashflow
- —
- DSCR
- —
- Eligible?
- —
Short-term bridge; refi at stabilization.
Rent comps 1 comps
| Address | Beds | Baths | Sqft | Rent | $/sqft | DOM | Units | Dist |
|---|---|---|---|---|---|---|---|---|
| 469 Madison Ave Enterprise, AL | 4.0 | 3.0 | 2130 | $2,500 | $1.17 | 43d | 1 | 0.95mi |
Listing history 7 events
-
2026-06-19days on market $174,900 Active 6 DOM
-
2026-06-18days on market $174,900 Active 5 DOM
-
2026-06-17days on market $174,900 Active 4 DOM
-
2026-06-16days on market $174,900 Active 3 DOM
-
2026-06-15days on market $174,900 Active 2 DOM
-
2026-06-14remarks 509-char remark
-
2026-06-14$174,900 Active 1 DOM
ⓘ Source: listings_history table (triggers on properties + properties_extension) + one-shot
backfill from property_details.listing_events for pre-trigger history.
Tax reassessment forecast AL · Resets to sale price
- Current annual tax
- $481 · $40/mo
- Projected year-2 tax
- $717 · $60/mo
- Expected delta
- +$236/yr (+$20/mo · 49.1%)
ⓘ Screening estimate from a state-policy table — verify with the county assessor before closing.
Climate risk First Street
- Flood 1/10 Low FEMA zone X (unshaded) · 0% chance over 30 yrs
- Wildfire 3/10 Moderate
- Heat 8/10 Severe 7 d/yr ≥106°F today · 20 d/yr by 30 yrs out
- Wind 9/10 Extreme 99% chance of damaging wind over 30 yrs
- Air quality 2/10 Low 0 unhealthy d/yr today · 1 by 30 yrs out
Nearby sold comps map
Loading sold comps map…
Walkable amenities ~0.75 mi
Loading nearby amenities…
Taxation est. · year 1
- Rental income
- $21,347
- − Mortgage interest
- −$9,797
- − Property taxes
- −$481
- − Insurance
- −$874
- − Repairs & maintenance
- −$1,708
- − Management
- −$1,708
- − Depreciation
- −$5,088
- Taxable income
- $1,691
- Est. tax owed @ 24.0%
- −$406
- After-tax cash flow
- $4,097/yr
For passive investors: Depreciation is non-cash, so a rental often shows a tax loss while cash-flowing — sheltering income. Rental losses are passive: they offset passive income freely, and up to $25,000/yr can offset ordinary (W-2) income if you actively participate and your MAGI is under $100k (phasing out to $0 by $150k); unused losses carry forward. On sale, claimed depreciation is recaptured at up to 25%, and gains may owe capital-gains tax (a 1031 exchange can defer both). Figures are a year-1 estimate at your 24.0% rate — not tax advice; consult a CPA.
Schools (NCES district)
- District
- Daleville City
- NCES district ID
- 0101080
- Math proficiency
- 9% ▼ -18.00%
- Reading proficiency
- 37% ▲ 1.00%
- Median HH income
- $45,865
- Composite
- 19.89/100
- National rank
- #8687
- State rank
- #97 of 129 in AL
Livability — Level Plains
- Score
- 55/100
- State rank
- #438
- US rank
- #23383
Category grades
Schools grade is shown separately in the Schools card above.
Census & demographics
- Census place
- Level Plains, AL
- County
- Coffee County · 39,557 people
- Metro
- Enterprise, AL
- Population (ZIP)
- 39,557
- Household income
- $75,765
- Rent vs Own
- Severe rent burden
- 1126.0
Population outlook (Dale County) Hauer SSP2
- Today (2025)
- 46,805 people
- By 2030
- 45,176 · -3.5%
- By 2040
- 41,523 · -11.3%
- By 2050
- 37,575 · -19.7%
- By 2075
- 28,931 · -38.2%
- By 2100
- 22,172 · -52.6%
Race, ethnicity, and origin ACS 2023
- Neighborhood character
- Diverse neighborhood (Simpson 0.56)
- Race & ethnicity
- White 63% Black 17% Hispanic / Latino 13% Two or more races 9% Asian 1%
- Hispanic origin (detail)
- Mexican 6% Puerto Rican 3%
- Common ancestry
- Italian 3% Lithuanian 2% Serbian 2%
- Foreign-born
- 6% · Canada, Vietnam, South Korea
- Languages at home
- 89% English-only · Spanish 8% German/W. Germanic 2%
Political lean MEDSL · Dale
- 2024 margin
- Solid R (+52.3) · D 23.5% · R 75.8%
- 2008→2024 swing
- -7.7pp toward R · 2008: -44.6pp · 2024: -52.3pp
- All cycles
- 2024: R+52.3 2020: R+46.3 2016: R+50.4 2012: R+42.2 2008: R+44.6
Not yet ingested
- Civics
- —
Market trends
- HPI YoY
- ▼ -44.44%
- Current HPI
- 184.0163
- Rent YoY
- ▲ 3.92%
- Metro
- Enterprise, AL
- State GDP YoY
- ▲ 2.94%
- F500 in state
- 4
Industry mix (Fortune 500 HQ in AL)
| Industry | F500 HQs | Revenue |
|---|---|---|
| Financial Services | 1 | $8B |
|
||
| Healthcare | 1 | $5B |
|
||
Price history
+102.2% since first listed8 events — show timeline
- 2026-06-14 Listed $174,900 FSBO.com
- 2011-09-17 Listed $95,000 MAAR
- 2011-09-17 Listed $95,000 WBR
- 2010-05-27 Listed $99,000 MAAR
- 2010-05-27 Listed $99,000 WBR
- 2009-01-16 Sold (Public Records) $83,250 Public Records
- 2009-01-16 Sold (MLS) $83,250 MAAR
- 2008-08-28 Listed $86,500 MAAR
Property tax history
+7.8%/yrLatest (2025): $481 · +2.4% YoY. Source: county tax records.
Cash-flow waterfall
monthlySold comps — $/sqft
last 12 mo · ≤1 miLoading sold comps…