 🌊 Lakefront
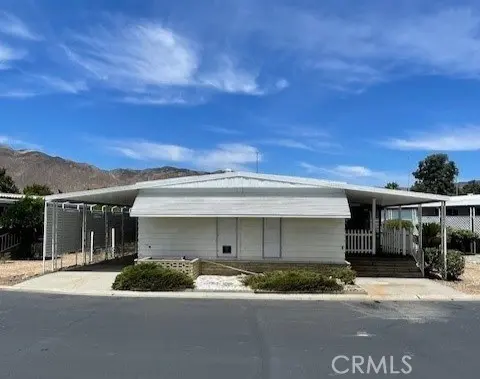
2230 Lake Park Dr #112 · San Jacinto, CA
Flood risk 3/10 · Minor
- FEMA flood zone
- X
- Chance of flooding over 30 yrs
- 0.1%
- Est. flood insurance / yr
- $507 – $1,088
Fire risk 9/10 · Severe
- Est. fire insurance / yr
- $659 – $1,223
Heat risk 7/10 · Major
- Hot days now (above 102°F)
- 4 days/yr
- Hot days in 30 yrs
- 11 days/yr
Wind risk 1/10 · Minimal
- Chance of severe wind over 30 yrs
- —
Air-quality risk 6/10 · Moderate
- Unhealthy air days now
- 11 days/yr
- Unhealthy air days in 30 yrs
- 13 days/yr
Risk factors via First Street. Map © Google.
Why this score? — see what drove the C- grade
The composite is a weighted blend of 9 inputs, each scored 0–100. Each bar is that input's sub-score; the figure is the points it added to the 100-point composite (weight × sub-score).
- Cash flow +15.0/30.0
- ARV discount +15.0/15.0
- 1% rule +5.0/10.0
- DSCR +5.0/10.0
- Rent growth +3.2/5.0
- Livability +3.2/5.0
- Condition / age +2.5/5.0
- Schools +2.1/10.0
- Appreciation +0.0/10.0
$40,000
🖨 Deal sheet (PDF) 📄 Offer letter ✓ Due diligence
Listing remarks MLS
Discover the potential of this LAKE FRONT 2-bedroom, 2-bathroom home nestled in a desirable 55+ community. This home offers a perfect canvas for those looking to infuse their personal style through cosmetic updates. This home features a large living area, spacious bedrooms, the master bath comes with a soaking tub, double sinks and a separate vanity. The kitchen, open to the family room is ready for a refresh to become the focal point of the home. Located across the street you will find the popular Soboba Casino, championship golf course and plenty of restaurants to choose from. Join in on the fun activities and events sponsored by the resident’s association. This property is a fantastic opportunity for those looking to customize their next home in a supportive and active senior community
Key facts
- Double sinks
- Separate vanity
- Lake front
Tags
Neighborhood map
What this means for you Summary
Snapshot
- This is a 2-bed/2.0-bath manufactured listed at $40k.
Deal economics
- At list price, monthly cash flow is $2k ($18k/yr) — positive.
- The deal already cash-flows at list — no discount required.
- Meets the 1% rule at list price ($2k rent vs $40k).
- Recommended offer: $35k (12.0% below list) — sets the bar for market timing.
- Cap rate 52.5% vs local median 3.8% in San Jacinto — top-decile yield for the area; either an underpriced asset or a hidden risk that comps aren't pricing in. Stress-test before assuming the spread holds.
Location & tenants
- Location reads 63/100 on livability (#467 in CA) — a middle-class / working-renter tenant base. Strengths: housing A+; Watch: employment D+, amenities F, cost of living F.
- San Jacinto Unified (suburban): math 13% / reading 36% proficiency, ranked #421 of 517 in CA (top 81%) — low school quality limits family demand, transient renter base, plan for 1-2y turnover; 68% free/reduced lunch — lower-income household profile, screen leases tightly.
- Zoned schools: Estudillo Elementary (726 students, 82% FRL); North Mountain Middle (math 24% / reading 24%, grade F, #277 of 498 statewide, top 73%, 844 students, 90% FRL); San Jacinto High (math 14% / reading 38%, grade F, #807 of 1,170 statewide, top 69%, 2,617 students, 85% FRL) — zoned schools average 86% FRL vs 68% district-wide (18 pts higher); higher-poverty schools than district average — tighter screening recommended.
- Market conditions: Rents rising (+2.6%/yr); 160 active listings in the ZIP; 15 comparable units currently listed for rent nearby; rentals at typical pace (median 26d on market — plan ~3-4 weeks tenant-placement turnaround); 9,195 units permitted in Riverside County in 2024 (1,512 in 5+ unit buildings).
- This rent runs 40% of the median local income ($68k/yr) — at the standard rent-burdened threshold; future hikes will face affordability resistance.
Forward outlook
- Local home prices are declining (-3.0%/yr); year-one equity from $277 of loan paydown is wiped out by about $1k of value loss. Plan a longer hold.
- Riverside County population projected at +22% by 2050 — long-run rental-demand tailwind backs the buy-and-hold thesis.
- At projected returns (-3.0% appreciation + 2.6% rent growth), your $11k cash investment doubles in ~1 year — after that, you're playing with house money.
Negotiation context
- It's been on market 327 days — a 12% lower offer ($35k) is reasonable based on typical stale-listing flexibility.
Risks & watch-outs
- Climate carrying-cost: severe wildfire risk; extreme-heat days projected 4→11/yr by 2055 (HVAC capex compounding) — expect insurance premiums to compound above CPI over the hold.
Questions for the listing agent
- It's been on market 327 days. Have you received any prior offers? Is the seller open to a 12% concession, seller financing, or rate buy-down credit?
- Built in 1972 — when were the roof, HVAC, electrical panel, plumbing, and water heater last replaced?
- Why hasn't it sold? Are there any deal-killer items the seller is aware of (foundation, flood, title, zoning, code violations)?
- Is there a deadline driving the sale (1031 exchange, divorce, estate, relocation)? That informs how much negotiation room exists.
- Schools are D-rated, which usually means shorter tenancies and higher turnover. Who's the typical renter profile here, and what's been the actual vacancy rate?
- This sits on a lake — are riparian / water-frontage rights deeded with the parcel? Any dock permits, shoreline easements, or HOA water-use restrictions?
- What's the documented flood / surge / shoreline-erosion history here (FEMA AND non-FEMA — e.g., storm surge, creek backup, septic-field saturation)?
- Any water-quality or seasonal algae-bloom issues that affect tenant satisfaction or short-term-rental demand?
- What's the average days-on-market for RENTAL listings here right now (not sales)? A rising rental-DOM trend means longer vacancies and softer asking-rent achievability than the comps imply.
- What's the recent tenant-quality profile in this submarket — average credit score on applications, eviction rate, late-payment / NSF rate, and stable-employment percentage? A property-management company in the area should have these aggregated.
- How much new for-sale + rental construction is in the pipeline within 1–3 miles? Heavy new supply typically softens prices + rents 12–24 months out; constrained supply supports both.
Investment metrics
- 1% rule
- 5.75% ✓
- Cap rate
- 52.53%
- Cash-on-cash
- 165.14%
- DSCR
- 8.35
- GRM
- 1.4
CMA / ARV
- ARV (median comp)
- $78,750
- List price
- $40,000
- Delta
- -49.21%
- Verdict
- UNDERPRICED
- Comps
- 14 within 1.0 mi
Show comp detail 12 sales within ~0.75 mi
| Address | Dist | Beds/Ba | Sqft | Sold | Price | $/sf | Match |
|---|---|---|---|---|---|---|---|
| 2230 Lake Park Dr #106 | 0.09mi | 2/2.0 | 1,440 (0%) | 2mo | $35,000 | $24 | 94 |
| 2230 Lake Park #127 | 0.11mi | 2/2.0 | 1,440 (0%) | 3mo | $32,000 | $22 | 92 |
| 2230 Lake Park Dr #143 | 0.11mi | 2/2.0 | 1,440 (0%) | 14mo | $75,000 | $52 | 83 |
| 2230 Lake Park Dr #174 | 0.11mi | 2/2.0 | 1,440 (0%) | 16mo | $142,000 | $99 | 82 |
| 2230 Lake Park Dr #223 | 0.09mi | 2/2.0 | 1,344 (-7%) | 4mo | $77,500 | $58 | 82 |
| 2230 Lake Park #193 | 0.11mi | 2/2.0 | 1,296 (-10%) | 2mo | $118,000 | $91 | 77 |
| 2230 Lake Park Dr #133 | 0.09mi | 3/2.0 (+1) | 1,325 (-8%) | 3mo | $195,500 | $148 | 75 |
| 1499 Old Mtn #51 | 0.73mi | 2/2.0 | 1,456 (+1%) | 2mo | $120,000 | $82 | 62 |
| 1499 Old Mountain Ave #93 | 0.70mi | 2/2.0 | 1,440 (0%) | 9mo | $91,500 | $64 | 60 |
| 1499 Old Mountain Ave #30 | 0.73mi | 2/2.0 | 1,440 (0%) | 11mo | $115,000 | $80 | 57 |
| 1499 Old Mountain Ave #145 | 0.73mi | 2/2.0 | 1,440 (0%) | 11mo | $110,000 | $76 | 57 |
| 1499 Old Mtn #88 | 0.73mi | 2/2.0 | 1,344 (-7%) | 0mo | $80,000 | $60 | 54 |
Match score weights: distance 35% · size 25% · config 20% · recency 20%. Top-matched comps best support the ARV.
Projected returns pro-forma
-3.0% appreciation · 2.61% rent growth · sell at horizon
- IRR
- —
- Equity multiple
- 9.11×
- Total profit
- $90,822
- Equity at exit
- $5,964
- IRR
- —
- Equity multiple
- 19.03×
- Total profit
- $201,973
- Equity at exit
- $3,458
Cash invested: $11,200 (down + closing). Projections, not guarantees.
Landlord ↔ Tenant lean methodology
- Overall (STATE)
- 18 Strongly Tenant-Friendly
- State California
- 18 Strongly Tenant-Friendly · D+13
- County
- — inherits STATE
- City
- — inherits STATE
ZIP-level market 92583
- Home prices YoY
- -14.8%
- Rents YoY
- 2.6%
- Active inventory
- 160
- Price-to-rent
- 1.4×
Monthly cashflow live
- Estimated rent
- $2,301 high interval (Pro) →
- Mortgage (P&I)
- −$210
- Tax est. 1.5%
- −$50 /mo · $600/yr
- Insurance
- −$17
- HOA
- −$0
- Vacancy / Maint / Mgmt
- −$483
- Net cashflow
- $1,541
Break-even live
Sensitivity live
| Price | -10% $1,569 | -5% $1,555 | +0% $1,541 | +5% $1,528 | +10% $1,514 |
|---|---|---|---|---|---|
| Rent | -10% $1,360 | -5% $1,450 | +0% $1,541 | +5% $1,632 | +10% $1,723 |
| Rate | -1.0pp $1,561 | -0.5pp $1,552 | base $1,541 | +0.5pp $1,531 | +1.0pp $1,520 |
UW: 25.0% down · 7.5% · 30yr · 1.5% tax · 5.0% vac · 8.0% maint · 8.0% mgmt
Financing live
Cash to close
- Down payment
- $10,000
- Closing costs
- $1,200
- Reserves months
- —
- Total cash needed
- —
Loan-product check · same deal, 3 products live
Conventional
25% down · 7.5% · 30yr
- Down + closing
- —
- Monthly P&I
- —
- Monthly cashflow
- —
- DSCR
- —
- Eligible?
- —
Personal DTI + credit; lowest rate.
DSCR
20% down · 8.5% · 30yr
- Down + closing
- —
- Monthly P&I
- —
- Monthly cashflow
- —
- DSCR
- —
- Eligible?
- —
No personal income docs; deal must DSCR.
Hard money
10% down · 12.0% · 12mo
- Down + closing
- —
- Monthly P&I
- —
- Monthly cashflow
- —
- DSCR
- —
- Eligible?
- —
Short-term bridge; refi at stabilization.
Rent comps 15 comps
| Address | Beds | Baths | Sqft | Rent | $/sqft | DOM | Units | Dist |
|---|---|---|---|---|---|---|---|---|
| 904 Bergamo Ave San Jacinto, CA | 2.0 | 2.0 | 1596 | $2,600 | $1.63 | 11d | 1 | 0.73mi |
| 905 Verona Ave San Jacinto, CA | 2.0 | 2.0 | 1417 | $2,300 | $1.62 | 19d | 1 | 0.77mi |
| 1129 Osprey St San Jacinto, CA | 3.0 | 2.0 | 1582 | $2,700 | $1.71 | 45d | 1 | 0.93mi |
| 492 Foursquare Pl San Jacinto, CA | 3.0 | 2.0 | 1573 | $3,500 | $2.23 | 0d | 1 | 1.12mi |
| 620 E Main St San Jacinto, CA | 2.0 | 2.0 | 900 | $1,600 | $1.78 | 26d | 1 | 1.14mi |
| 646 Field Maple Pl GLMN HOT SPGS, CA | 3.0–4.0 | 2.0–3.0 | 1825 | $2,850 | $1.56 | 0d | 9 | 1.25mi |
| 621 S Mistletoe Ave San Jacinto, CA | 2.0 | 2.0 | 1500 | $2,000 | $1.33 | 45d | 1 | 1.33mi |
| 700 Minor St San Jacinto, CA | 2.0 | 1.0 | 878 | $1,700 | $1.94 | 26d | 1 | 1.44mi |
| 700 Minor St San Jacinto, CA | 2.0 | 1.0 | 878 | $1,600 | $1.82 | 45d | 1 | 1.44mi |
| 1939 Hooper Dr San Jacinto, CA | 2.0 | 2.0 | 1111 | $1,950 | $1.76 | 26d | 1 | 1.45mi |
| 748 Minor St Apt F San Jacinto, CA | 2.0 | 1.0 | 878 | $1,600 | $1.82 | 45d | 1 | 1.45mi |
| 784 Minor St Unit B San Jacinto, CA | 2.0 | 1.0 | 878 | $1,700 | $1.94 | 26d | 1 | 1.46mi |
| 800 Minor St San Jacinto, CA | 2.0 | 1.0 | 878 | $1,600 | $1.82 | 0d | 1 | 1.46mi |
| 795 Minor St Unit A San Jacinto, CA | 2.0 | 1.0 | 878 | $1,700 | $1.94 | 26d | 1 | 1.47mi |
| 1809 Rue Chenin Blanc San Jacinto, CA | 3.0 | 2.0 | 1548 | $2,500 | $1.61 | 6d | 1 | 1.48mi |
Listing history 18 events
-
2026-06-21days on market $40,000 Active 327 DOM
-
2026-06-18days on market $40,000 Active 324 DOM
-
2026-06-17days on market $40,000 Active 323 DOM
-
2026-06-16days on market $40,000 Active 322 DOM
-
2026-06-15days on market $40,000 Active 321 DOM
-
2026-06-13days on market $40,000 Active 319 DOM
-
2026-06-13days on market $40,000 Active 318 DOM
-
2026-06-09days on market $40,000 Active 315 DOM
-
2026-06-08pricedays on market $40,000 Active 314 DOM
-
2026-06-07days on market $50,000 Active 313 DOM
-
2026-06-04days on market $50,000 Active 310 DOM
-
2026-06-03days on market $50,000 Active 309 DOM
-
2026-06-02days on market $50,000 Active 308 DOM
-
2026-06-01days on market $50,000 Active 307 DOM
-
2026-05-31days on market $50,000 Active 306 DOM
-
2026-01-28price $50,000 805-char remark
Show marketing remark (805 chars)
Discover the potential of this LAKE FRONT 2-bedroom, 2-bathroom home nestled in a desirable 55+ community. This home offers a perfect canvas for those looking to infuse their personal style through cosmetic updates. This home features a large living area, spacious bedrooms, the master bath comes with a soaking tub, double sinks and a separate vanity. The kitchen, open to the family room is ready for a refresh to become the focal point of the home. Located across the street you will find the popular Soboba Casino, championship golf course and plenty of restaurants to choose from. Join in on the fun activities and events sponsored by the resident’s association. This property is a fantastic opportunity for those looking to customize their next home in a supportive and active senior community
-
2025-10-03price $70,000 805-char remark
Show marketing remark (805 chars)
Discover the potential of this LAKE FRONT 2-bedroom, 2-bathroom home nestled in a desirable 55+ community. This home offers a perfect canvas for those looking to infuse their personal style through cosmetic updates. This home features a large living area, spacious bedrooms, the master bath comes with a soaking tub, double sinks and a separate vanity. The kitchen, open to the family room is ready for a refresh to become the focal point of the home. Located across the street you will find the popular Soboba Casino, championship golf course and plenty of restaurants to choose from. Join in on the fun activities and events sponsored by the resident’s association. This property is a fantastic opportunity for those looking to customize their next home in a supportive and active senior community
-
2025-07-29$80,000 Active 805-char remark
Show marketing remark (805 chars)
Discover the potential of this LAKE FRONT 2-bedroom, 2-bathroom home nestled in a desirable 55+ community. This home offers a perfect canvas for those looking to infuse their personal style through cosmetic updates. This home features a large living area, spacious bedrooms, the master bath comes with a soaking tub, double sinks and a separate vanity. The kitchen, open to the family room is ready for a refresh to become the focal point of the home. Located across the street you will find the popular Soboba Casino, championship golf course and plenty of restaurants to choose from. Join in on the fun activities and events sponsored by the resident’s association. This property is a fantastic opportunity for those looking to customize their next home in a supportive and active senior community
ⓘ Source: listings_history table (triggers on properties + properties_extension) + one-shot
backfill from property_details.listing_events for pre-trigger history.
Climate risk First Street
- Flood 3/10 Moderate FEMA zone X · 10% chance over 30 yrs
- Wildfire 9/10 Extreme
- Heat 7/10 Severe 4 d/yr ≥102°F today · 11 d/yr by 30 yrs out
- Wind 1/10 Low
- Air quality 6/10 Major 11 unhealthy d/yr today · 13 by 30 yrs out
Nearby sold comps map
Loading sold comps map…
Walkable amenities ~0.75 mi
Loading nearby amenities…
Taxation est. · year 1
- Rental income
- $27,612
- − Mortgage interest
- −$2,241
- − Property taxes
- −$600
- − Insurance
- −$200
- − Repairs & maintenance
- −$2,209
- − Management
- −$2,209
- − Depreciation
- −$1,164
- Taxable income
- $18,990
- Est. tax owed @ 24.0%
- −$4,557
- After-tax cash flow
- $13,939/yr
For passive investors: Depreciation is non-cash, so a rental often shows a tax loss while cash-flowing — sheltering income. Rental losses are passive: they offset passive income freely, and up to $25,000/yr can offset ordinary (W-2) income if you actively participate and your MAGI is under $100k (phasing out to $0 by $150k); unused losses carry forward. On sale, claimed depreciation is recaptured at up to 25%, and gains may owe capital-gains tax (a 1031 exchange can defer both). Figures are a year-1 estimate at your 24.0% rate — not tax advice; consult a CPA.
Schools (NCES district)
- District
- San Jacinto Unified
- NCES district ID
- 0634440
- Math proficiency
- 13% ▼ -9.00%
- Reading proficiency
- 36% ▬ 0.00%
- Median HH income
- $43,560
- Composite
- 20.94/100
- National rank
- #8478
- State rank
- #421 of 517 in CA
Livability — San Jacinto
- Score
- 63/100
- State rank
- #467
- US rank
- #15889
Category grades
Schools grade is shown separately in the Schools card above.
Census & demographics
- Census place
- San Jacinto, CA
- County
- Riverside County · 2,287,001 people
- City population
- 33,778
- Metro
- Riverside-San Bernardino-Ontario, CA
- Population (ZIP)
- 33,778
- Household income
- $68,351
- Rent vs Own
- Severe rent burden
- 747.0
Population outlook (Riverside County) Hauer SSP2
- Today (2025)
- 2,664,475 people
- By 2030
- 2,802,692 · +5.2%
- By 2040
- 3,050,904 · +14.5%
- By 2050
- 3,256,783 · +22.2%
- By 2075
- 3,655,058 · +37.2%
- By 2100
- 3,766,594 · +41.4%
Race, ethnicity, and origin ACS 2023
- Neighborhood character
- Diverse neighborhood (Simpson 0.57)
- Race & ethnicity
- Hispanic / Latino 60% White 26% Two or more races 23% Black 5% Asian 3% Native American 3%
- Hispanic origin (detail)
- Mexican 52%
- Common ancestry
- Lithuanian 1% Iranian 1% Portuguese 1%
- Foreign-born
- 20% · Canada
- Languages at home
- 56% English-only · Spanish 40% Tagalog/Filipino 2% Other Asian/Pacific 1%
Political lean MEDSL · Riverside
- 2024 margin
- Toss-up / Even · D 48.0% · R 49.3% · Other 2.6%
- 2008→2024 swing
- -3.6pp toward R · 2008: 2.3pp · 2024: -1.3pp
- All cycles
- 2024: R+1.3 2020: D+8.0 2016: D+4.3 2012: R+0.4 2008: D+2.3
Not yet ingested
- Civics
- —
Market trends
- HPI YoY
- ▼ -71.15%
- Current HPI
- 407.8584
- Rent YoY
- ▲ 2.61%
- Metro
- Riverside-San Bernardino-Ontario, CA
- State GDP YoY
- ▲ 3.21%
- F500 in state
- 116
Industry mix (Fortune 500 HQ in CA)
| Industry | F500 HQs | Revenue |
|---|---|---|
| Technology | 27 | $1,492B |
|
||
| Financial Services | 3 | $174B |
|
||
| Retail | 3 | $44B |
|
||
| Insurance | 3 | $26B |
|
||
| Media / Entertainment | 2 | $115B |
|
||
| Pharmaceuticals / Biotech | 2 | $62B |
|
||
Price history
-37.5% since first listed3 events — show timeline
- 2026-01-28 Price Changed $50,000 CRMLS
- 2025-10-03 Price Changed $70,000 CRMLS
- 2025-07-29 Listed $80,000 CRMLS
Cash-flow waterfall
monthlySold comps — $/sqft
last 12 mo · ≤1 miLoading sold comps…