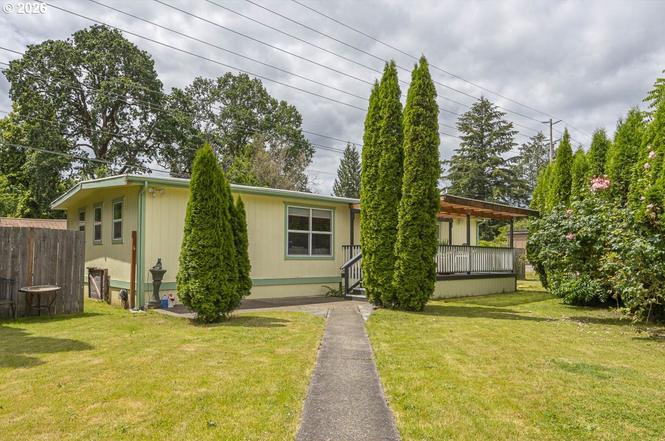
507 N 19th Ave #88 · Cornelius, OR
Flood risk 1/10 · Minimal
- FEMA flood zone
- X (unshaded)
- Chance of flooding over 30 yrs
- 0.0%
- Est. flood insurance / yr
- $507 – $1,088
Fire risk 3/10 · Minor
- Est. fire insurance / yr
- $498 – $926
Heat risk 3/10 · Minor
- Hot days now (above 92°F)
- 7 days/yr
- Hot days in 30 yrs
- 14 days/yr
Wind risk 1/10 · Minimal
- Chance of severe wind over 30 yrs
- —
Air-quality risk 8/10 · Major
- Unhealthy air days now
- 11 days/yr
- Unhealthy air days in 30 yrs
- 11 days/yr
Risk factors via First Street. Map © Google.
Why this score? — see what drove the B grade
The composite is a weighted blend of 9 inputs, each scored 0–100. Each bar is that input's sub-score; the figure is the points it added to the 100-point composite (weight × sub-score).
- Cash flow +28.0/30.0
- ARV discount +12.8/15.0
- DSCR +10.0/10.0
- 1% rule +6.9/10.0
- Livability +4.1/5.0
- Schools +3.6/10.0
- Rent growth +2.5/5.0
- Condition / age +2.5/5.0
- Appreciation +0.0/10.0
$125,000
🖨 Deal sheet (PDF) 📄 Offer letter ✓ Due diligence
Listing remarks MLS
$4850!! 1152SF 2BR/2BA/FAM RM DBL-WDE MFG HM IN GREAT W-SIDE SR PRK! HUGE LAWNED YARD W/ROSES! FRIDG,RANGE,WASHER & DRYER STAY! LOW, LOW $379 /MO SPACE RENT=WATER,SEWER,GARBAGE! BEST DBL-WDE DEAL AROUND! WEST SIDE!
Key facts
- Large deck
- Fully remodeled
- Updated hvac
Tags
Property features AI
Finance
- Other: Property type: Residential — Manufactured home in park; Main level area approximately 1,152; Year built: 1972
- HOA & community: Park name: Smoketree Mobile Court; Park pet restrictions: ask manager; Land lease (monthly lot rent of $1,025) with lease through 12/31/2026
Exterior
- Parking: Carport (1 space); Off-street parking
- Utilities: Public water; Public sewer; Electric fuel; Internet: Cable and fiber optics
- Home design: Manufactured home in park (not attached); Updated/remodeled condition; Territorial view; Main living all on one level; Built in 1972
- Construction: Pillar/post/pier foundation; Membrane roof; Manufacturer: Olympian
- Exterior features: Covered deck and deck; Fenced yard; Tool shed; T-111 siding; Level, private lot; Paved road access
Interior
- Kitchen: Built-in range; Down draft; Dishwasher; Disposal; Free-standing refrigerator; Laminate flooring in kitchen; Plumbed for ice maker
- Bedrooms: Primary bedroom on main level with attached bathroom and soaking tub; Second bedroom on main level
- Flooring: Vinyl flooring; Laminate flooring (kitchen); Wall-to-wall carpet
- Bathrooms: Two full bathrooms, both on the main level
- Heating & cooling: Forced air heating; Heat pump for heating and cooling
- Interior features: High-speed internet; Laundry area on main level; Soaking tub; Vinyl flooring; Wall-to-wall carpet; Double-pane windows with vinyl frames; Crawl space foundation
- Laundry & utility: Laundry room on main level; Hot water: electric
Neighborhood map
What this means for you Summary
Snapshot
- This is a 2-bed/2.0-bath manufactured listed at $125k.
Deal economics
- At list price, monthly cash flow is $390 ($5k/yr) — positive.
- The deal already cash-flows at list — no discount required.
- Meets the 1% rule at list price ($1k rent vs $125k).
- Cap rate 10.0% vs local median 2.9% in Cornelius — top-decile yield for the area; either an underpriced asset or a hidden risk that comps aren't pricing in. Stress-test before assuming the spread holds.
Location & tenants
- Location reads 82/100 on livability (#47 in OR, #1,193 nationally) — a professional / high-income tenant draw. Strengths: commute A+, employment A+, housing A+; Watch: amenities C-, cost of living C-.
- Forest Grove SD 15 (suburban): math 32% / reading 46% proficiency, ranked #111 of 183 in OR (top 61%) — families likely to look elsewhere, expect single-tenant / working-renter base with shorter leases.
- Zoned schools: Cornelius Elementary School (371 students, 93% FRL); Neil Armstrong Middle School (math 24% / reading 75%, grade C, #26 of 128 statewide, top 21%, 826 students, 48% FRL); Forest Grove High School (1,977 students, 41% FRL).
- Market conditions: 113 active listings in the ZIP; 20 comparable units currently listed for rent nearby; rentals at typical pace (median 20d on market — plan ~3-4 weeks tenant-placement turnaround); 2,224 units permitted in Washington County in 2024 (242 in 5+ unit buildings).
Forward outlook
- Local home prices are declining (-3.0%/yr); year-one equity from $864 of loan paydown is wiped out by about $4k of value loss. Plan a longer hold.
- Washington County population projected at +33% by 2050 — long-run rental-demand tailwind backs the buy-and-hold thesis.
- At projected returns (-3.0% appreciation + 3.0% rent growth), your $35k cash investment doubles in ~9 years — after that, you're playing with house money.
Negotiation context
- Only 10 days on market — expect competitive offers; lowballing is unlikely to land.
- 2 sale attempts since 25y ago with the ask held roughly flat each time — persistent listings suggest the price (not the market) is what's stuck; bring a comps-based counter.
- Current owner paid $5k; list at $125k implies a 2477% gain — meaningful room to come down on a strong offer.
Questions for the listing agent
- Built in 1972 — when were the roof, HVAC, electrical panel, plumbing, and water heater last replaced?
- Is there a deadline driving the sale (1031 exchange, divorce, estate, relocation)? That informs how much negotiation room exists.
- Schools are F-rated, which usually means shorter tenancies and higher turnover. Who's the typical renter profile here, and what's been the actual vacancy rate?
- What's the average days-on-market for RENTAL listings here right now (not sales)? A rising rental-DOM trend means longer vacancies and softer asking-rent achievability than the comps imply.
- What's the recent tenant-quality profile in this submarket — average credit score on applications, eviction rate, late-payment / NSF rate, and stable-employment percentage? A property-management company in the area should have these aggregated.
- How much new for-sale + rental construction is in the pipeline within 1–3 miles? Heavy new supply typically softens prices + rents 12–24 months out; constrained supply supports both.
Investment metrics
- 1% rule
- 1.19% ✓
- Cap rate
- 10.04%
- Cash-on-cash
- 13.38%
- DSCR
- 1.60
- GRM
- 7.0
CMA / ARV
- ARV (on-the-fly)
- $141,696
- Comps found
- 5
Show comp detail 5 sales within ~0.75 mi
| Address | Dist | Beds/Ba | Sqft | Sold | Price | $/sf | Match |
|---|---|---|---|---|---|---|---|
| 570 N 10th Ave #10 | 0.35mi | 3/2.0 (+1) | 1,188 (+3%) | 5mo | $45,000 | $38 | 70 |
| 507 N 19th Ave #66 | 0.00mi | 2/2.0 | 1,008 (-12%) | 17mo | $60,000 | $60 | 65 |
| 2329 N Gray St | 0.33mi | 3/2.0 (+1) | 1,296 (+12%) | 2mo | $375,000 | $289 | 57 |
| 570 N 10th Ave #78 | 0.35mi | 2/2.0 | 1,040 (-10%) | 19mo | $170,000 | $163 | 51 |
| 893 N 14th Pl #32 | 0.23mi | 3/2.0 (+1) | 1,296 (+12%) | 16mo | $160,000 | $123 | 50 |
Match score weights: distance 35% · size 25% · config 20% · recency 20%. Top-matched comps best support the ARV.
Projected returns pro-forma
-3.0% appreciation · 3.0% rent growth · sell at horizon
- IRR
- 3.4%
- Equity multiple
- 1.13×
- Total profit
- $4,569
- Equity at exit
- $18,638
- IRR
- 12.9%
- Equity multiple
- 2.02×
- Total profit
- $35,874
- Equity at exit
- $10,808
Cash invested: $35,000 (down + closing). Projections, not guarantees.
Landlord ↔ Tenant lean methodology
- Overall (STATE)
- 28 Tenant-Leaning
- State Oregon
- 28 Tenant-Leaning · D+6
- County
- — inherits STATE
- City
- — inherits STATE
ZIP-level market 97113
- Active inventory
- 113
- Price-to-rent
- 7.0×
Monthly cashflow live
- Estimated rent
- $1,489 high interval (Pro) →
- Mortgage (P&I)
- −$656
- Tax from tax record
- −$78 /mo · $940/yr
- Insurance
- −$52
- HOA
- −$0
- Lot rent leased land?
- −$0
- Vacancy / Maint / Mgmt
- −$313
- Net cashflow
- $390
Break-even live
Sensitivity live
| Price | -10% $461 | -5% $426 | +0% $390 | +5% $355 | +10% $319 |
|---|---|---|---|---|---|
| Rent | -10% $273 | -5% $331 | +0% $390 | +5% $449 | +10% $508 |
| Rate | -1.0pp $453 | -0.5pp $422 | base $390 | +0.5pp $358 | +1.0pp $325 |
UW: 25.0% down · 7.5% · 30yr · 1.5% tax · 5.0% vac · 8.0% maint · 8.0% mgmt
Financing live
Cash to close
- Down payment
- $31,250
- Closing costs
- $3,750
- Reserves months
- —
- Total cash needed
- —
Loan-product check · same deal, 3 products live
Conventional
25% down · 7.5% · 30yr
- Down + closing
- —
- Monthly P&I
- —
- Monthly cashflow
- —
- DSCR
- —
- Eligible?
- —
Personal DTI + credit; lowest rate.
DSCR
20% down · 8.5% · 30yr
- Down + closing
- —
- Monthly P&I
- —
- Monthly cashflow
- —
- DSCR
- —
- Eligible?
- —
No personal income docs; deal must DSCR.
Hard money
10% down · 12.0% · 12mo
- Down + closing
- —
- Monthly P&I
- —
- Monthly cashflow
- —
- DSCR
- —
- Eligible?
- —
Short-term bridge; refi at stabilization.
Rent comps 20 comps
| Address | Beds | Baths | Sqft | Rent | $/sqft | DOM | Units | Dist |
|---|---|---|---|---|---|---|---|---|
| 898 N 18th Ave Cornelius, OR | 3.0 | 2.5 | 1417 | $2,195 | $1.55 | 0d | 1 | 0.10mi |
| 873 N 19th Ave Cornelius, OR | 3.0 | 2.5 | 1396 | $2,245 | $1.61 | 4d | 1 | 0.11mi |
| 1100 N Davis St Cornelius, OR | 2.0 | 1.0 | 750 | $1,645 | $2.19 | 0d | 2 | 0.41mi |
| 1250 E Baseline St Unit 4 Cornelius, OR | 2.0 | 1.0 | 700 | $1,280 | $1.83 | 6d | 1 | 0.50mi |
| 120 N 7th Ave Unit D Cornelius, OR | 2.0 | 2.0 | 1015 | $1,699 | $1.67 | 46d | 1 | 0.68mi |
| 110 N 7th Ave Apt C Cornelius, OR | 2.0 | 2.0 | 1015 | $1,749 | $1.72 | 46d | 1 | 0.68mi |
| 110 N 7th Ave Apt A Cornelius, OR | 2.0 | 2.0 | 1015 | $1,609 | $1.59 | 10d | 1 | 0.68mi |
| 2795 N Clark Ct Cornelius, OR | 3.0 | 2.0 | 1100 | $2,295 | $2.09 | 19d | 1 | 0.68mi |
| 100 N 7th Ave Apt B Cornelius, OR | 2.0 | 2.0 | 1015 | $1,599 | $1.58 | 17d | 1 | 0.69mi |
| 100 N 7th Ave Unit A Cornelius, OR | 2.0 | 2.0 | 1015 | $1,595 | $1.57 | 22d | 1 | 0.69mi |
| 101 N 7th Ave Apt D Cornelius, OR | 2.0 | 1.5 | 936 | $1,545 | $1.65 | 17d | 1 | 0.71mi |
| 101 N 7th Ave Unit C Cornelius, OR | 2.0 | 1.5 | 936 | $1,499 | $1.60 | 24d | 1 | 0.71mi |
| 299 N 5th Pl Cornelius, OR | 2.0 | 2.0 | 956 | $1,900 | $1.99 | 46d | 1 | 0.79mi |
| 184 S 5th Ave Unit 164 Cornelius, OR | 2.0 | 1.5 | 1114 | $1,795 | $1.61 | 17d | 1 | 0.87mi |
| 1318 S Ivy St Cornelius, OR | 2.0 | 1.0 | 816 | $1,795 | $2.20 | 26d | 1 | 0.90mi |
| 1330 S Ivy St Cornelius, OR | 2.0 | 1.0 | 816 | $1,745 | $2.14 | 26d | 1 | 0.90mi |
| 1367 S Ivy St Apt B Cornelius, OR | 2.0 | 1.0 | 800 | $1,550 | $1.94 | 46d | 1 | 0.93mi |
| 4300 Pacific Ave Forest Grove, OR | 2.0 | 1.5 | 950 | $1,645 | $1.73 | 0d | 5 | 1.16mi |
| 4204 Pacific Ave Forest Grove, OR | 2.0 | 1.0 | 900 | $1,500 | $1.67 | 4d | 1 | 1.23mi |
| 313 S Nectarine St Cornelius, OR | 3.0 | 2.0 | 1114 | $2,295 | $2.06 | 22d | 1 | 1.41mi |
Listing history 8 events
-
2026-06-22days on market $125,000 Active 10 DOM
-
2026-06-21days on market $125,000 Active 9 DOM
-
2026-06-18days on market $125,000 Active 6 DOM
-
2026-06-17days on market $125,000 Active 5 DOM
-
2026-06-16days on market $125,000 Active 4 DOM
-
2026-06-15days on market $125,000 Active 3 DOM
-
2026-06-13remarks 699-char remark
-
2026-06-13$125,000 Active 1 DOM
ⓘ Source: listings_history table (triggers on properties + properties_extension) + one-shot
backfill from property_details.listing_events for pre-trigger history.
Tax reassessment forecast OR · Resets to sale price
- Current annual tax
- $940 · $78/mo
- Projected year-2 tax
- $1,212 · $101/mo
- Expected delta
- +$272/yr (+$23/mo · 29.0%)
ⓘ Screening estimate from a state-policy table — verify with the county assessor before closing.
Climate risk First Street
- Flood 1/10 Low FEMA zone X (unshaded) · 0% chance over 30 yrs
- Wildfire 3/10 Moderate
- Heat 3/10 Moderate 7 d/yr ≥92°F today · 14 d/yr by 30 yrs out
- Wind 1/10 Low
- Air quality 8/10 Severe 11 unhealthy d/yr today · 11 by 30 yrs out
Nearby sold comps map
Loading sold comps map…
Walkable amenities ~0.75 mi
Loading nearby amenities…
Taxation est. · year 1
- Rental income
- $17,865
- − Mortgage interest
- −$7,002
- − Property taxes
- −$940
- − Insurance
- −$625
- − Repairs & maintenance
- −$1,429
- − Management
- −$1,429
- − Depreciation
- −$3,636
- Taxable income
- $2,803
- Est. tax owed @ 24.0%
- −$673
- After-tax cash flow
- $4,009/yr
For passive investors: Depreciation is non-cash, so a rental often shows a tax loss while cash-flowing — sheltering income. Rental losses are passive: they offset passive income freely, and up to $25,000/yr can offset ordinary (W-2) income if you actively participate and your MAGI is under $100k (phasing out to $0 by $150k); unused losses carry forward. On sale, claimed depreciation is recaptured at up to 25%, and gains may owe capital-gains tax (a 1031 exchange can defer both). Figures are a year-1 estimate at your 24.0% rate — not tax advice; consult a CPA.
Schools (NCES district)
- District
- Forest Grove SD 15
- NCES district ID
- 4105160
- Math proficiency
- 32% ▼ -4.00%
- Reading proficiency
- 46% ▼ -4.00%
- Median HH income
- $52,159
- Composite
- 36.31/100
- National rank
- #9395
- State rank
- #111 of 183 in OR
Livability — Cornelius
- Score
- 82/100
- State rank
- #47
- US rank
- #1193
Category grades
Schools grade is shown separately in the Schools card above.
Census & demographics
- Census place
- Cornelius, OR
- Population (ZIP)
- 15,621
Population outlook (Washington County) Hauer SSP2
- Today (2025)
- 674,042 people
- By 2030
- 721,804 · +7.1%
- By 2040
- 812,732 · +20.6%
- By 2050
- 895,143 · +32.8%
- By 2075
- 1,058,806 · +57.1%
- By 2100
- 1,131,692 · +67.9%
Race, ethnicity, and origin ACS 2023
- Neighborhood character
- Diverse neighborhood (Simpson 0.57)
- Race & ethnicity
- Hispanic / Latino 47% White 46% Two or more races 13% Native American 4% Asian 2%
- Hispanic origin (detail)
- Mexican 42%
- Common ancestry
- Iranian 3% Italian 2% Portuguese 2%
- Foreign-born
- 24% · Canada, China, Vietnam
- Languages at home
- 55% English-only · Spanish 42% Other Indo-European 1% Chinese 1%
Political lean MEDSL · Washington
- 2024 margin
- Solid D (+34.0) · D 65.3% · R 31.3% · Other 3.4%
- 2008→2024 swing
- +11.8pp toward D · 2008: 22.1pp · 2024: 34.0pp
- All cycles
- 2024: D+34.0 2020: D+34.6 2016: D+26.7 2012: D+17.5 2008: D+22.1
Not yet ingested
- Civics
- —
Market trends
- HPI YoY
- ▼ -171.16%
- Current HPI
- 285.7514
- Rent YoY
- —
- Metro
- —
- State GDP YoY
- ▲ 2.05%
- F500 in state
- 2
Industry mix (Fortune 500 HQ in OR)
| Industry | F500 HQs | Revenue |
|---|---|---|
| Consumer Goods | 1 | $51B |
|
||
Price history
+1006.2% since first listed4 events — show timeline
- 2026-06-12 Listed $125,000 RMLS
- 2001-07-30 Sold (MLS) $4,850 RMLS
- 2001-03-06 Listed $4,850 RMLS
- 1972-05-01 Sold (Public Records) $11,300 Public Records
Property tax history
+14.5%/yrLatest (2025): $940 · +2.7% YoY. Source: county tax records.
Cash-flow waterfall
monthlySold comps — $/sqft
last 12 mo · ≤1 miLoading sold comps…