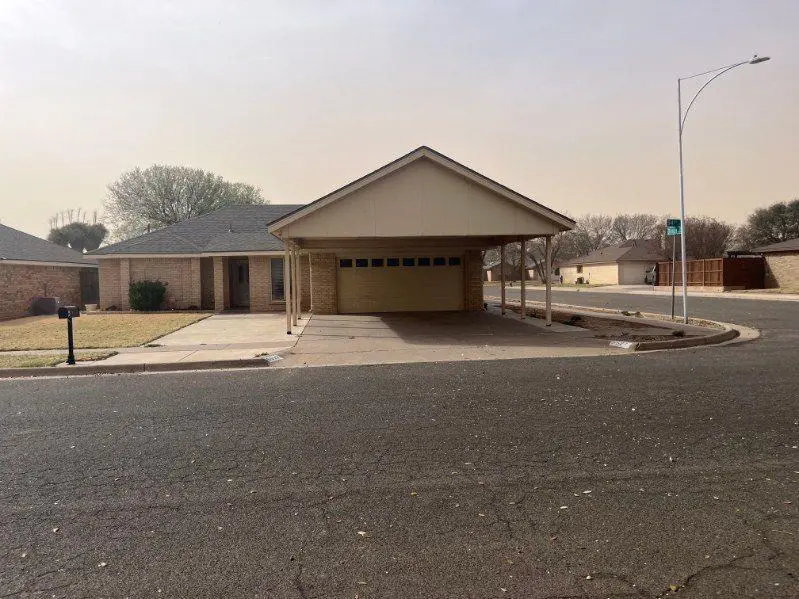
5527 94th St · Lubbock, TX
Flood risk 1/10 · Minimal
- FEMA flood zone
- X (unshaded)
- Chance of flooding over 30 yrs
- 0.0%
- Est. flood insurance / yr
- $507 – $1,088
Fire risk 1/10 · Minimal
- Est. fire insurance / yr
- $1,222 – $2,270
Heat risk 5/10 · Moderate
- Hot days now (above 99°F)
- 7 days/yr
- Hot days in 30 yrs
- 21 days/yr
Wind risk 2/10 · Minimal
- Chance of severe wind over 30 yrs
- —
Air-quality risk 2/10 · Minimal
- Unhealthy air days now
- 1 days/yr
- Unhealthy air days in 30 yrs
- 1 days/yr
Risk factors via First Street. Map © Google.
Why this score? — see what drove the D grade
The composite is a weighted blend of 9 inputs, each scored 0–100. Each bar is that input's sub-score; the figure is the points it added to the 100-point composite (weight × sub-score).
- ARV discount +14.4/15.0
- Cash flow +8.1/30.0
- Livability +4.0/5.0
- 1% rule +3.2/10.0
- Rent growth +3.2/5.0
- Schools +3.1/10.0
- Condition / age +2.5/5.0
- DSCR +2.1/10.0
- Appreciation +0.0/10.0
$230,000
🖨 Deal sheet (PDF) 📄 Offer letter ✓ Due diligence
Listing remarks MLS
Charming home located in beautifully established neighborhood. This 3/2/2 with office and 2 living areas & 2 dining areas has been very well maintained and lightly lived in and good storage throughout. Backyard paradise with spacious patio and covered outdoor storage.
Key facts
- Covered back patio
- Fenced backyard
- Corner lot
Tags
Property features AI
Finance
- HOA & community: Neighborhood has curbs, street lights, and sidewalks
Exterior
- Parking: Attached garage (2 spaces); Attached carport (2 spaces); Garage faces front
- Utilities: Public water; Public sewer; Electricity connected; Natural gas available and connected
- Home design: Single-family residence; One-story; Fixer condition
- Construction: Brick and frame construction; Composition roof; Slab foundation; Built as residential single-family
- Exterior features: Covered patio; Patio; Wood fencing; City lot on a corner; Paved public-maintained city street with curbs, sidewalks, and street lights
Interior
- Kitchen: Dishwasher; Free-standing electric range
- Flooring: Carpet; Concrete; Tile
- Bathrooms: 2 full bathrooms
- Heating & cooling: Central heating; Central air conditioning
- Interior features: Vaulted ceilings; Gas and wood-burning fireplace
Neighborhood map
What this means for you Summary
Snapshot
- This is a 3-bed/2.0-bath single-family listed at $230k.
Deal economics
- At list price, monthly cash flow is $-224 ($-3k/yr) — negative.
- To cash-flow at today's rent, offer at most $190k (17.2% below list).
- To meet the 1% rule (rent ≥ 1% of price), the offer needs to be $189k (17.8% below list).
- Recommended offer: $189k (17.8% below list) — sets the bar for 1% rule.
Location & tenants
- Location reads 80/100 on livability (#37 in TX, #1,749 nationally) — a professional / high-income tenant draw. Strengths: commute A+, cost of living A+, housing A+; Watch: employment C-, crime F.
- Lubbock ISD (urban): math 36% / reading 39% proficiency, ranked #481 of 826 in TX (top 58%) — families likely to look elsewhere, expect single-tenant / working-renter base with shorter leases; 60% free/reduced lunch — lower-income household profile, screen leases tightly.
- Zoned schools: Smith El (math 57% / reading 60%, grade B-, #467 of 4,322 statewide, top 11%, 561 students, 48% FRL); Irons Middle (math 25% / reading 36%, grade F, #1,036 of 1,662 statewide, top 63%, 815 students, 71% FRL); Coronado H S (math 34% / reading 38%, grade F, #930 of 1,632 statewide, top 57%, 1,960 students, 66% FRL) — zoned schools at 62% FRL track the district average.
- Market conditions: Rents rising (+2.8%/yr); 712 active listings in the ZIP; 23 comparable units currently listed for rent nearby; rentals at typical pace (median 24d on market — plan ~3-4 weeks tenant-placement turnaround); 43% of comp listings sitting > 30 days — soft ceiling on asking rent; solid renter incomes; 2,219 units permitted in Lubbock County in 2024 (252 in 5+ unit buildings).
Forward outlook
- Local home prices are declining (-3.0%/yr); year-one equity from $2k of loan paydown is wiped out by about $7k of value loss. Plan a longer hold.
- Lubbock County population projected at +39% by 2050 — long-run rental-demand tailwind backs the buy-and-hold thesis.
Negotiation context
- It's been on market 19 days — a 2% lower offer ($227k) is reasonable based on typical stale-listing flexibility.
- 3 sale attempts since 12y ago with the ask held roughly flat each time — persistent listings suggest the price (not the market) is what's stuck; bring a comps-based counter.
Risks & watch-outs
- Climate carrying-cost: extreme-heat days projected 7→21/yr by 2055 (HVAC capex compounding) — expect insurance premiums to compound above CPI over the hold.
Questions for the listing agent
- What do current leases actually rent for vs. the listed asking? Can we see a recent rent roll and the last 12 months of T-12 income?
- Is there a deadline driving the sale (1031 exchange, divorce, estate, relocation)? That informs how much negotiation room exists.
- Schools are D-rated, which usually means shorter tenancies and higher turnover. Who's the typical renter profile here, and what's been the actual vacancy rate?
- Crime grade is F in this area — have there been break-ins, vandalism, or insurance claims at this property in the last 3 years? What carrier currently insures it and at what premium?
- The area grade is low — what's the realistic commute time and amenity access for the typical tenant pool here? Any planned neighborhood developments (good or bad) we should know about?
- What's the average days-on-market for RENTAL listings here right now (not sales)? A rising rental-DOM trend means longer vacancies and softer asking-rent achievability than the comps imply.
- What's the recent tenant-quality profile in this submarket — average credit score on applications, eviction rate, late-payment / NSF rate, and stable-employment percentage? A property-management company in the area should have these aggregated.
- How much new for-sale + rental construction is in the pipeline within 1–3 miles? Heavy new supply typically softens prices + rents 12–24 months out; constrained supply supports both.
Investment metrics
- 1% rule
- 0.82% ✗
- Cap rate
- 5.12%
- Cash-on-cash
- -4.17%
- DSCR
- 0.81
- GRM
- 10.1
CMA / ARV
- ARV (median comp)
- $271,790
- List price
- $230,000
- Delta
- -16.11%
- Verdict
- UNDERPRICED
- Comps
- 1 within 2.0 mi
Projected returns pro-forma
-3.0% appreciation · 2.75% rent growth · sell at horizon
- IRR
- -23.6%
- Equity multiple
- 0.19×
- Total profit
- $-51,905
- Equity at exit
- $34,294
- IRR
- -19.0%
- Equity multiple
- -0.01×
- Total profit
- $-65,071
- Equity at exit
- $19,886
Cash invested: $64,400 (down + closing). Projections, not guarantees.
Landlord ↔ Tenant lean methodology
- Overall (STATE)
- 87 Strongly Landlord-Friendly
- State Texas
- 87 Strongly Landlord-Friendly · R+5
- County
- — inherits STATE
- City
- — inherits STATE
ZIP-level market 79424
- Rents YoY
- 2.8%
- Active inventory
- 712
- Price-to-rent
- 10.1×
Monthly cashflow live
- Estimated rent
- $1,890 high interval (Pro) →
- Mortgage (P&I)
- −$1,206
- Tax from tax record
- −$415 /mo · $4,978/yr
- Insurance
- −$96
- HOA
- −$0
- Lot rent
- −$0
- Vacancy / Maint / Mgmt
- −$397
- Net cashflow
- $-224
Break-even live
Sensitivity live
| Price | -10% $-94 | -5% $-159 | +0% $-224 | +5% $-289 | +10% $-354 |
|---|---|---|---|---|---|
| Rent | -10% $-373 | -5% $-299 | +0% $-224 | +5% $-149 | +10% $-75 |
| Rate | -1.0pp $-108 | -0.5pp $-166 | base $-224 | +0.5pp $-284 | +1.0pp $-344 |
UW: 25.0% down · 7.5% · 30yr · 1.5% tax · 5.0% vac · 8.0% maint · 8.0% mgmt
Financing live
Cash to close
- Down payment
- $57,500
- Closing costs
- $6,900
- Reserves months
- —
- Total cash needed
- —
Loan-product check · same deal, 3 products live
Conventional
25% down · 7.5% · 30yr
- Down + closing
- —
- Monthly P&I
- —
- Monthly cashflow
- —
- DSCR
- —
- Eligible?
- —
Personal DTI + credit; lowest rate.
DSCR
20% down · 8.5% · 30yr
- Down + closing
- —
- Monthly P&I
- —
- Monthly cashflow
- —
- DSCR
- —
- Eligible?
- —
No personal income docs; deal must DSCR.
Hard money
10% down · 12.0% · 12mo
- Down + closing
- —
- Monthly P&I
- —
- Monthly cashflow
- —
- DSCR
- —
- Eligible?
- —
Short-term bridge; refi at stabilization.
Rent comps 23 comps
| Address | Beds | Baths | Sqft | Rent | $/sqft | DOM | Units | Dist |
|---|---|---|---|---|---|---|---|---|
| 5513 95th St Lubbock, TX | 3.0 | 2.0 | 1785 | $1,575 | $0.88 | 23d | 1 | 0.10mi |
| 5731 90th St Lubbock, TX | 3.0 | 2.0 | 1504 | $1,650 | $1.10 | 23d | 1 | 0.38mi |
| 5523 101st St Lubbock, TX | 3.0 | 2.0 | 1901 | $2,100 | $1.10 | 23d | 1 | 0.39mi |
| 5706 87th Pl Lubbock, TX | 3.0 | 2.0 | 1544 | $1,550 | $1.00 | 16d | 1 | 0.47mi |
| 9701 Abbeville Ave Lubbock, TX | 3.0 | 2.0 | 1817 | $1,750 | $0.96 | 23d | 1 | 0.54mi |
| 5216 94th St Lubbock, TX | 3.0 | 2.0 | 1557 | $1,900 | $1.22 | 23d | 1 | 0.57mi |
| 9806 Genoa Ave Lubbock, TX | 4.0 | 2.0 | 1763 | $2,050 | $1.16 | 46d | 1 | 0.61mi |
| 10502 Beaufort Ave Lubbock, TX | 3.0 | 2.0 | 1760 | $2,399 | $1.36 | 46d | 1 | 0.82mi |
| 10506 Beaufort Ave Lubbock, TX | 3.0 | 2.0 | 1760 | $2,399 | $1.36 | 46d | 1 | 0.83mi |
| 5507 108th St Lubbock, TX | 3.0 | 2.0 | 1587 | $1,550 | $0.98 | 23d | 1 | 0.87mi |
| 10510 Bangor Ave Lubbock, TX | 4.0 | 2.0 | 2152 | $2,650 | $1.23 | 16d | 1 | 0.90mi |
| 5703 80th St Lubbock, TX | 3.0 | 2.0 | 2133 | $2,295 | $1.08 | 46d | 1 | 0.93mi |
| 5534 111th St Lubbock, TX | 3.0 | 2.0 | 1415 | $1,800 | $1.27 | 16d | 1 | 1.00mi |
| 7911 Albany Ave Unit B Lubbock, TX | 2.0 | 2.0 | 1441 | $1,350 | $0.94 | 16d | 1 | 1.02mi |
| 7911 Albany Ave Unit A Lubbock, TX | 3.0 | 2.0 | 1441 | $1,350 | $0.94 | 23d | 1 | 1.02mi |
| 5309 77th St Lubbock, TX | 4.0 | 2.5 | 2336 | $2,500 | $1.07 | 46d | 1 | 1.13mi |
| 5806 78th St Lubbock, TX | 3.0 | 2.0 | 1985 | $1,800 | $0.91 | 46d | 1 | 1.13mi |
| 9616 Kline Ave Lubbock, TX | 3.0 | 2.0 | 2198 | $2,150 | $0.98 | 46d | 1 | 1.15mi |
| 5415 73rd St Lubbock, TX | 3.0 | 2.0 | 1725 | $1,849 | $1.07 | 23d | 1 | 1.34mi |
| 4715 French Quarter Ct Lubbock, TX | 3.0 | 2.0 | 2386 | $2,400 | $1.01 | 46d | 1 | 1.36mi |
| 5605 117th St Lubbock, TX | 4.0 | 2.0 | 2036 | $2,650 | $1.30 | 23d | 1 | 1.42mi |
| 6024 74th St Lubbock, TX | 4.0 | 2.0 | 1997 | $1,999 | $1.00 | 46d | 1 | 1.49mi |
| 11810 Evanston Ave Lubbock, TX | 3.0 | 2.0 | 1400 | $1,475 | $1.05 | 46d | 1 | 1.49mi |
Listing history 29 events
-
2026-06-22days on market $230,000 Active 19 DOM
-
2026-06-18days on market $230,000 Active 16 DOM
-
2026-06-18price $230,000 Active 15 DOM
-
2026-06-17days on market $240,000 Active 15 DOM
-
2026-06-16days on market $240,000 Active 14 DOM
-
2026-06-15days on market $240,000 Active 13 DOM
-
2026-06-14days on market $240,000 Active 11 DOM
-
2026-06-13days on market $240,000 Active 10 DOM
-
2026-06-10days on market $240,000 Active 8 DOM
-
2026-06-09days on market $240,000 Active 7 DOM
-
2026-06-08days on market $240,000 Active 6 DOM
-
2026-06-07days on market $240,000 Active 5 DOM
-
2026-06-05remarks 699-char remark
-
2026-06-05days on market $240,000 Active 2 DOM
-
2026-06-03remarks 546-char remark
-
2026-06-03pricedays on market $240,000 Active 1 DOM
-
2026-06-02days on market $227,999 Active 25 DOM
-
2026-06-01days on market $227,999 Active 24 DOM
-
2026-05-31days on market $227,999 Active 23 DOM
-
2026-05-30days on market $227,999 Active 22 DOM
-
2026-05-15price $239,000 400-char remark
-
2026-05-08$240,000 Active 400-char remark
-
2014-05-29soldstatus
-
2014-05-23soldstatus 274-char remark
Show marketing remark (274 chars)
Charming home located in beautifully established neighborhood. This 3/2/2 with office and 2 living areas & 2 dining areas has been very well maintained and lightly lived in and good storage throughout. Backyard paradise with spacious patio and covered outdoor storage.
-
2014-03-20$160,000 274-char remark
Show marketing remark (274 chars)
Charming home located in beautifully established neighborhood. This 3/2/2 with office and 2 living areas & 2 dining areas has been very well maintained and lightly lived in and good storage throughout. Backyard paradise with spacious patio and covered outdoor storage.
-
2013-06-21soldstatus
-
1989-11-01soldstatus
-
1987-07-01soldstatus
-
1987-01-01soldstatus
ⓘ Source: listings_history table (triggers on properties + properties_extension) + one-shot
backfill from property_details.listing_events for pre-trigger history.
Tax reassessment forecast TX · Resets to sale price
- Current annual tax
- $4,978 · $415/mo
- Projected year-2 tax
- $4,978 · $415/mo
- Expected delta
- $0/yr ($0/mo · 0.0%)
ⓘ Screening estimate from a state-policy table — verify with the county assessor before closing.
Climate risk First Street
- Flood 1/10 Low FEMA zone X (unshaded) · 0% chance over 30 yrs
- Wildfire 1/10 Low
- Heat 5/10 Major 7 d/yr ≥99°F today · 21 d/yr by 30 yrs out
- Wind 2/10 Low
- Air quality 2/10 Low 1 unhealthy d/yr today · 1 by 30 yrs out
Nearby sold comps map
Loading sold comps map…
Walkable amenities ~0.75 mi
Loading nearby amenities…
Taxation est. · year 1
- Rental income
- $22,676
- − Mortgage interest
- −$12,884
- − Property taxes
- −$4,978
- − Insurance
- −$1,150
- − Repairs & maintenance
- −$1,814
- − Management
- −$1,814
- − Depreciation
- −$6,691
- Taxable loss
- −$6,655
- Est. tax savings @ 24.0%
- +$1,597
- After-tax cash flow
- $-1,091/yr
For passive investors: Depreciation is non-cash, so a rental often shows a tax loss while cash-flowing — sheltering income. Rental losses are passive: they offset passive income freely, and up to $25,000/yr can offset ordinary (W-2) income if you actively participate and your MAGI is under $100k (phasing out to $0 by $150k); unused losses carry forward. On sale, claimed depreciation is recaptured at up to 25%, and gains may owe capital-gains tax (a 1031 exchange can defer both). Figures are a year-1 estimate at your 24.0% rate — not tax advice; consult a CPA.
Schools (NCES district)
- District
- Lubbock ISD
- NCES district ID
- 4828500
- Math proficiency
- 36% ▼ -8.00%
- Reading proficiency
- 39% ▼ -1.00%
- Median HH income
- $39,820
- Composite
- 31.44/100
- National rank
- #5984
- State rank
- #481 of 826 in TX
Livability — Lubbock
- Score
- 80/100
- State rank
- #37
- US rank
- #1749
Category grades
Schools grade is shown separately in the Schools card above.
Census & demographics
- Census place
- Lubbock, TX
- County
- Lubbock County · 293,542 people
- City population
- 283,030
- Metro
- Lubbock, TX
- Population (ZIP)
- 53,478
- Household income
- $97,231
- Rent vs Own
- Severe rent burden
- 1958.0
Population outlook (Lubbock County) Hauer SSP2
- Today (2025)
- 345,960 people
- By 2030
- 371,449 · +7.4%
- By 2040
- 424,539 · +22.7%
- By 2050
- 481,150 · +39.1%
- By 2075
- 633,467 · +83.1%
- By 2100
- 746,853 · +115.9%
Race, ethnicity, and origin ACS 2023
- Neighborhood character
- Predominantly White (71%)
- Race & ethnicity
- White 71% Hispanic / Latino 21% Two or more races 12% Asian 3% Black 2%
- Hispanic origin (detail)
- Mexican 17%
- Common ancestry
- Slovak 2% Italian 2% Lithuanian 1%
- Foreign-born
- 6% · Canada, China
- Languages at home
- 88% English-only · Spanish 8% Chinese 1% Tagalog/Filipino 1%
Political lean MEDSL · Lubbock
- 2024 margin
- Solid R (+39.5) · D 29.7% · R 69.2% · Other 1.0%
- 2008→2024 swing
- -2.8pp toward R · 2008: -36.7pp · 2024: -39.5pp
- All cycles
- 2024: R+39.5 2020: R+32.2 2016: R+38.4 2012: R+40.9 2008: R+36.7
Not yet ingested
- Civics
- —
Market trends
- HPI YoY
- ▼ -146.64%
- Current HPI
- 213.2155
- Rent YoY
- ▲ 2.75%
- Metro
- Lubbock, TX
- State GDP YoY
- ▲ 3.95%
- F500 in state
- 110
Industry mix (Fortune 500 HQ in TX)
| Industry | F500 HQs | Revenue |
|---|---|---|
| Energy | 16 | $1,198B |
|
||
| Technology | 5 | $198B |
|
||
| Engineering / Construction | 4 | $72B |
|
||
| Energy Services | 3 | $60B |
|
||
| Utilities | 3 | $41B |
|
||
| Healthcare | 2 | $330B |
|
||
Price history
+43.8% since first listed15 events — show timeline
- 2026-06-18 Price Changed $230,000 LARMLS
- 2026-06-03 Listing Removed — NTREIS
- 2026-06-03 Price Changed $240,000 LARMLS
- 2026-06-02 Listed $227,999 LARMLS
- 2026-05-27 Price Changed $227,999 NTREIS
- 2026-05-20 Price Changed $233,000 NTREIS
- 2026-05-15 Price Changed $239,000 NTREIS
- 2026-05-08 Listed $240,000 NTREIS
- 2014-05-29 Sold (Public Records) — Public Records
- 2014-05-23 Sold (MLS) — LARMLS
- 2014-03-20 Listed $160,000 LARMLS
- 2013-06-21 Sold (Public Records) — Public Records
- 1989-11-01 Sold (Public Records) — Public Records
- 1987-07-01 Sold (Public Records) — Public Records
- 1987-01-01 Sold (Public Records) — Public Records
Property tax history
+4.3%/yrLatest (2025): $4,978 · +1.3% YoY. Source: county tax records.
Cash-flow waterfall
monthlySold comps — $/sqft
last 12 mo · ≤1 miLoading sold comps…