12403 Tinsley St · Huntley, IL
Flood risk No data
- FEMA flood zone
- —
- Chance of flooding over 30 yrs
- —
- Est. flood insurance / yr
- —
Fire risk No data
- Est. fire insurance / yr
- —
Heat risk No data
- Hot days now (above threshold)
- —
- Hot days in 30 yrs
- —
Wind risk No data
- Chance of severe wind over 30 yrs
- —
Air-quality risk No data
- Unhealthy air days now
- —
- Unhealthy air days in 30 yrs
- —
Risk factors via First Street. Map © Google.
Why this score? — see what drove the D grade
The composite is a weighted blend of 9 inputs, each scored 0–100. Each bar is that input's sub-score; the figure is the points it added to the 100-point composite (weight × sub-score).
- Cash flow +12.6/30.0
- ARV discount +8.7/15.0
- Condition / age +4.0/5.0
- DSCR +3.8/10.0
- Livability +3.8/5.0
- Schools +3.7/10.0
- 1% rule +3.6/10.0
- Rent growth +2.5/5.0
- Appreciation +0.0/10.0
$353,990
🖨 Deal sheet (PDF) 📄 Offer letter ✓ Due diligence
Listing remarks
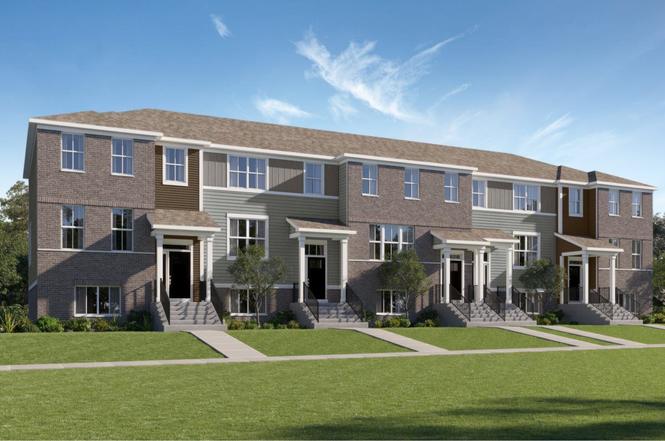
This new three-story townhome is designed for family comfort, with a lower level providing versatile finished space. The first floor showcases an open floorplan among the family room, kitchen and dining room that opens out to a deck. Three upstairs bedrooms including the spacious owner's suite provide private retreats for family members.
Key facts
- Open floorplan
- Three story townhome
- Deck
Tags
Property features AI
Finance
- Other: Listing status: Active
- Financial info: List price $353,990
Exterior
- Parking: 2-car garage (2 total parking spaces)
- Home design: Single-family property (Amherst plan)
- Construction: New construction (spec home)
- Exterior features: Living area approximately 1764; Address: 12403 Tinsley St, Huntley IL 60142
Interior
- Bedrooms: 3 bedrooms
- Bathrooms: 2 full bathrooms and 1 half bathroom
- Interior features: Open floor plan (model: Amherst); Spec home (new construction)
Neighborhood map
What this means for you Summary
Snapshot
- This is a 3-bed/2.5-bath townhouse listed at $354k. Condition is rated good.
Deal economics
- At list price, monthly cash flow is $-45 ($-540/yr) — negative.
- To cash-flow at today's rent, offer at most $347k (1.8% below list).
- To meet the 1% rule (rent ≥ 1% of price), the offer needs to be $304k (14.1% below list).
- Recommended offer: $304k (14.1% below list) — sets the bar for 1% rule.
- Cap rate 6.1% vs local median 4.0% in Huntley — top-decile yield for the area; either an underpriced asset or a hidden risk that comps aren't pricing in. Stress-test before assuming the spread holds.
Location & tenants
- Location reads 75/100 on livability (#235 in IL, #4,300 nationally) — a middle-class / working-renter tenant base. Strengths: crime A+, employment A+, housing A+; Watch: amenities F, commute F.
- Huntley Community School District 158 (suburban): math 37% / reading 42% proficiency, ranked #116 of 620 in IL (top 19%) — families likely to look elsewhere, expect single-tenant / working-renter base with shorter leases; only 10% free/reduced lunch — higher-income household profile.
- Zoned schools: Leggee Elementary School (math 45% / reading 46%, grade D-, #255 of 2,056 statewide, top 13%, 907 students, 0% FRL); Heineman Middle School (math 25% / reading 33%, grade F, #275 of 665 statewide, top 41%, 751 students, 0% FRL); Huntley High School (math 45% / reading 50%, grade D, #51 of 693 statewide, top 7%, 2,926 students, 0% FRL).
- Market conditions: 190 active listings in the ZIP; 5 comparable units currently listed for rent nearby; rentals at typical pace (median 23d on market — plan ~3-4 weeks tenant-placement turnaround); solid renter incomes; 1,944 units permitted in Kane County in 2024 (357 in 5+ unit buildings).
- This rent runs 41% of the median local income ($90k/yr) — at the standard rent-burdened threshold; future hikes will face affordability resistance.
Forward outlook
- Local home prices are declining (-3.0%/yr); year-one equity from $2k of loan paydown is wiped out by about $11k of value loss. Plan a longer hold.
Negotiation context
- Only 2 days on market — expect competitive offers; lowballing is unlikely to land.
Questions for the listing agent
- What do current leases actually rent for vs. the listed asking? Can we see a recent rent roll and the last 12 months of T-12 income?
- Is there a deadline driving the sale (1031 exchange, divorce, estate, relocation)? That informs how much negotiation room exists.
- The area grade is low — what's the realistic commute time and amenity access for the typical tenant pool here? Any planned neighborhood developments (good or bad) we should know about?
- What's the average days-on-market for RENTAL listings here right now (not sales)? A rising rental-DOM trend means longer vacancies and softer asking-rent achievability than the comps imply.
- What's the recent tenant-quality profile in this submarket — average credit score on applications, eviction rate, late-payment / NSF rate, and stable-employment percentage? A property-management company in the area should have these aggregated.
- How much new for-sale + rental construction is in the pipeline within 1–3 miles? Heavy new supply typically softens prices + rents 12–24 months out; constrained supply supports both.
Investment metrics
- 1% rule
- 0.86% ✗
- Cap rate
- 6.14%
- Cash-on-cash
- -0.55%
- DSCR
- 0.98
- GRM
- 9.7
CMA / ARV
- ARV (on-the-fly)
- $363,384
- Comps found
- 12
Show comp detail 12 sales within ~0.75 mi
| Address | Dist | Beds/Ba | Sqft | Sold | Price | $/sf | Match |
|---|---|---|---|---|---|---|---|
| 12386 Tinsley St | 0.03mi | 3/2.5 | 1,764 (0%) | 1mo | $347,990 | $197 | 98 |
| 12382 Tinsley St | 0.04mi | 3/2.5 | 1,764 (0%) | 1mo | $346,490 | $196 | 98 |
| 12336 Tinsley St | 0.06mi | 3/2.5 | 1,764 (0%) | 1mo | $349,990 | $198 | 97 |
| 12332 Tinsley St | 0.06mi | 3/2.5 | 1,764 (0%) | 2mo | $349,990 | $198 | 95 |
| 12322 Tinsley St | 0.08mi | 3/2.5 | 1,764 (0%) | 2mo | $349,990 | $198 | 95 |
| 12177 Dodwell St | 0.18mi | 3/2.5 | 1,717 (-3%) | 2mo | $396,990 | $231 | 86 |
| 12209 Dodwell St | 0.18mi | 3/2.5 | 1,840 (+4%) | 1mo | $389,990 | $212 | 84 |
| 12175 Dodwell St | 0.24mi | 3/2.5 | 1,840 (+4%) | 1mo | $378,990 | $206 | 81 |
| 12183 Dodwell St | 0.28mi | 3/2.5 | 1,840 (+4%) | 1mo | $378,990 | $206 | 79 |
| 12091 Chandra Cir | 0.07mi | 2/2.0 (-1) | 1,512 (-14%) | 1mo | $372,000 | $246 | 65 |
| 12230 Barcroft Cir | 0.13mi | 2/2.0 (-1) | 1,512 (-14%) | 1mo | $345,000 | $228 | 63 |
| 11676 River Ter | 0.54mi | 2/2.0 (-1) | 1,566 (-11%) | 2mo | $330,000 | $211 | 47 |
Match score weights: distance 35% · size 25% · config 20% · recency 20%. Top-matched comps best support the ARV.
Projected returns pro-forma
-3.0% appreciation · 3.0% rent growth · sell at horizon
- IRR
- -17.2%
- Equity multiple
- 0.39×
- Total profit
- $-60,184
- Equity at exit
- $52,781
- IRR
- -9.1%
- Equity multiple
- 0.44×
- Total profit
- $-55,915
- Equity at exit
- $30,607
Cash invested: $99,117 (down + closing). Projections, not guarantees.
Landlord ↔ Tenant lean methodology
- Overall (STATE)
- 43 Moderately Tenant-Leaning
- State Illinois
- 43 Moderately Tenant-Leaning · D+7
- County
- — inherits STATE
- City
- — inherits STATE
ZIP-level market 60142
- Home prices YoY
- -28.7%
- Active inventory
- 190
- Price-to-rent
- 9.7×
Monthly cashflow live
- Estimated rent
- $3,040 high interval (Pro) →
- Mortgage (P&I)
- −$1,856
- Tax est. 1.5%
- −$442 /mo · $5,310/yr
- Insurance
- −$147
- HOA
- −$0
- Vacancy / Maint / Mgmt
- −$638
- Net cashflow
- $-45
Break-even live
Sensitivity live
| Price | -10% $200 | -5% $77 | +0% $-45 | +5% $-167 | +10% $-290 |
|---|---|---|---|---|---|
| Rent | -10% $-285 | -5% $-165 | +0% $-45 | +5% $75 | +10% $195 |
| Rate | -1.0pp $133 | -0.5pp $45 | base $-45 | +0.5pp $-137 | +1.0pp $-230 |
UW: 25.0% down · 7.5% · 30yr · 1.5% tax · 5.0% vac · 8.0% maint · 8.0% mgmt
Financing live
Cash to close
- Down payment
- $88,498
- Closing costs
- $10,620
- Reserves months
- —
- Total cash needed
- —
Loan-product check · same deal, 3 products live
Conventional
25% down · 7.5% · 30yr
- Down + closing
- —
- Monthly P&I
- —
- Monthly cashflow
- —
- DSCR
- —
- Eligible?
- —
Personal DTI + credit; lowest rate.
DSCR
20% down · 8.5% · 30yr
- Down + closing
- —
- Monthly P&I
- —
- Monthly cashflow
- —
- DSCR
- —
- Eligible?
- —
No personal income docs; deal must DSCR.
Hard money
10% down · 12.0% · 12mo
- Down + closing
- —
- Monthly P&I
- —
- Monthly cashflow
- —
- DSCR
- —
- Eligible?
- —
Short-term bridge; refi at stabilization.
Rent comps 5 comps
| Address | Beds | Baths | Sqft | Rent | $/sqft | DOM | Units | Dist |
|---|---|---|---|---|---|---|---|---|
| 12382 Tinsley St Huntley, IL | 3.0 | 2.5 | 1764 | $2,800 | $1.59 | 20d | 1 | 0.02mi |
| 12134 Kelsey Dr Unit 12134 Huntley, IL | 3.0 | 2.5 | 1850 | $2,800 | $1.51 | 24d | 1 | 0.20mi |
| 12175 Dodwell St Huntley, IL | 3.0 | 2.5 | 1840 | $2,850 | $1.55 | 24d | 1 | 0.25mi |
| 13215 Michigan Ave Huntley, IL | 2.0 | 2.0 | 1535 | $2,550 | $1.66 | 22d | 1 | 1.23mi |
| 12452 Wedgemere Dr Huntley, IL | 2.0 | 2.0 | 1422 | $2,550 | $1.79 | 0d | 1 | 1.45mi |
Listing history 2 events
-
2026-06-21remarks 339-char remark
-
2026-06-21$353,990 Active 2 DOM
ⓘ Source: listings_history table (triggers on properties + properties_extension) + one-shot
backfill from property_details.listing_events for pre-trigger history.
Nearby sold comps map
Loading sold comps map…
Walkable amenities ~0.75 mi
Loading nearby amenities…
Taxation est. · year 1
- Rental income
- $36,476
- − Mortgage interest
- −$19,829
- − Property taxes
- −$5,310
- − Insurance
- −$1,770
- − Repairs & maintenance
- −$2,918
- − Management
- −$2,918
- − Depreciation
- −$10,298
- Taxable loss
- −$6,567
- Est. tax savings @ 24.0%
- +$1,576
- After-tax cash flow
- $1,036/yr
For passive investors: Depreciation is non-cash, so a rental often shows a tax loss while cash-flowing — sheltering income. Rental losses are passive: they offset passive income freely, and up to $25,000/yr can offset ordinary (W-2) income if you actively participate and your MAGI is under $100k (phasing out to $0 by $150k); unused losses carry forward. On sale, claimed depreciation is recaptured at up to 25%, and gains may owe capital-gains tax (a 1031 exchange can defer both). Figures are a year-1 estimate at your 24.0% rate — not tax advice; consult a CPA.
Condition & rehab AI · 13 photos
This three-story townhome is in excellent condition with minimal repairs needed. It offers a good balance of curb appeal and interior comfort, making it a solid investment for both resale and rental markets.
Value-add opportunities
- Both Painting the exterior and interior walls — Fresh paint enhances curb appeal and interior aesthetics
- Both Updating the flooring with a more durable material — Updated flooring improves both resale and rental value
- Both Upgrading the kitchen appliances — Modern appliances increase appeal and functionality
- Both Installing smart home features — Smart home features enhance convenience and attract tech-savvy buyers
Renovation cost estimate screening
Value-add ROI direction
- Both Painting the exterior and interior walls — Fresh paint enhances curb appeal and interior aesthetics ↑
- Both Updating the flooring with a more durable material — Updated flooring improves both resale and rental value ↑
- Both Upgrading the kitchen appliances — Modern appliances increase appeal and functionality ↑
- Both Installing smart home features — Smart home features enhance convenience and attract tech-savvy buyers ↑
ⓘ Cost ranges are severity-bucket heuristics (US national rule-of-thumb). Get contractor quotes + a written scope before underwriting a rehab budget.
Schools (NCES district)
- District
- Huntley Community School District 158
- NCES district ID
- 1719830
- Math proficiency
- 37% ▼ -9.00%
- Reading proficiency
- 42% ▼ -12.00%
- Median HH income
- $83,196
- Composite
- 37.24/100
- National rank
- #4461
- State rank
- #116 of 620 in IL
Livability — Huntley
- Score
- 75/100
- State rank
- #235
- US rank
- #4300
Category grades
Schools grade is shown separately in the Schools card above.
Census & demographics
- Census place
- Huntley, IL
- County
- McHenry County · 204,279 people
- City population
- 29,692
- Metro
- Chicago-Naperville-Elgin, IL-IN-WI
- Population (ZIP)
- 29,692
- Household income
- $89,735
- Rent vs Own
- Severe rent burden
- 317.0
Population outlook (Kane County) Hauer SSP2
- Today (2025)
- 559,449 people
- By 2030
- 568,757 · +1.7%
- By 2040
- 575,969 · +3.0%
- By 2050
- 563,477 · +0.7%
- By 2075
- 492,321 · -12.0%
- By 2100
- 380,943 · -31.9%
Race, ethnicity, and origin ACS 2023
- Neighborhood character
- Predominantly White (78%)
- Race & ethnicity
- White 78% Hispanic / Latino 9% Asian 5% Two or more races 5% Black 5%
- Hispanic origin (detail)
- Mexican 7%
- Common ancestry
- Romanian 13% Lithuanian 2% Slovak 2%
- Foreign-born
- 10% · Canada, South Korea
- Languages at home
- 88% English-only · Spanish 4% Russian/Polish/Slavic 2% Other Indo-European 2%
Political lean MEDSL · Kane
- 2024 margin
- Lean D (+9.4) · D 54.0% · R 44.6% · Other 1.4%
- 2008→2024 swing
- -2.4pp toward R · 2008: 11.8pp · 2024: 9.4pp
- All cycles
- 2024: D+9.4 2020: D+14.4 2016: D+8.9 2012: D+0.9 2008: D+11.8
Not yet ingested
- Civics
- —
Market trends
- HPI YoY
- ▼ -79.50%
- Current HPI
- 197.505
- Rent YoY
- —
- Metro
- Chicago-Naperville-Elgin, IL-IN-WI
- State GDP YoY
- ▲ 1.59%
- F500 in state
- 60
Industry mix (Fortune 500 HQ in IL)
| Industry | F500 HQs | Revenue |
|---|---|---|
| Insurance | 4 | $201B |
|
||
| Consumer Goods | 4 | $87B |
|
||
| Industrial Machinery | 3 | $64B |
|
||
| Healthcare | 2 | $55B |
|
||
| Retail / Pharmacy | 1 | $148B |
|
||
| Agriculture / Food | 1 | $86B |
|
||
Cash-flow waterfall
monthlySold comps — $/sqft
last 12 mo · ≤1 miLoading sold comps…