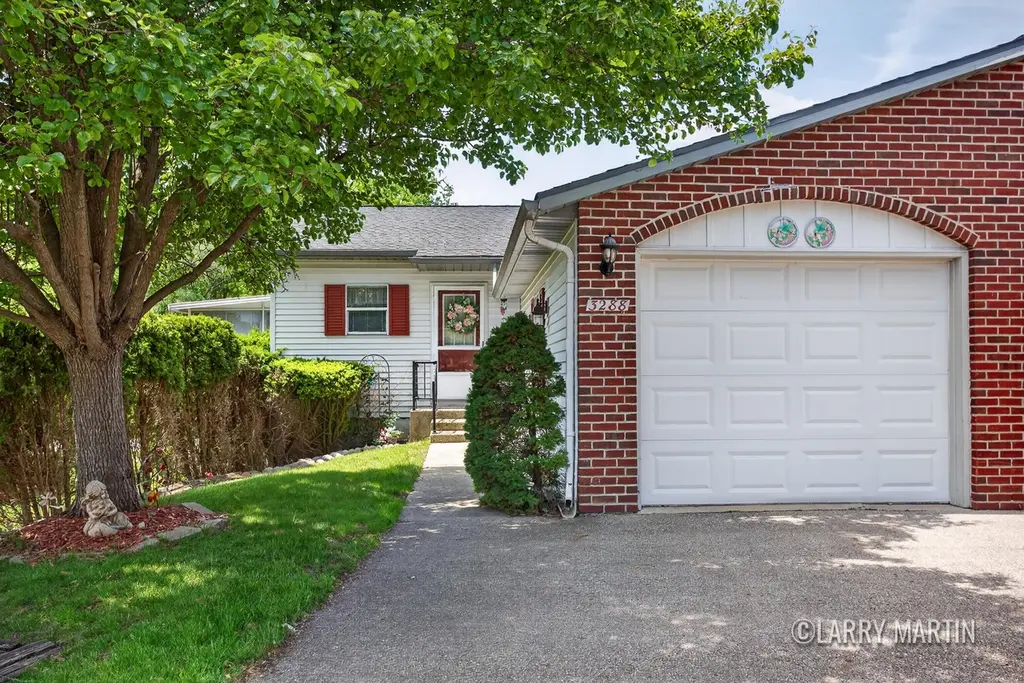
3288 Cambridge St SE #9 · Kentwood, MI
Flood risk 5/10 · Moderate
- FEMA flood zone
- X (unshaded)
- Chance of flooding over 30 yrs
- 0.52%
- Est. flood insurance / yr
- $473 – $860
Fire risk 1/10 · Minimal
- Est. fire insurance / yr
- $784 – $1,456
Heat risk 2/10 · Minimal
- Hot days now (above 96°F)
- 7 days/yr
- Hot days in 30 yrs
- 16 days/yr
Wind risk 2/10 · Minimal
- Chance of severe wind over 30 yrs
- —
Air-quality risk 2/10 · Minimal
- Unhealthy air days now
- 2 days/yr
- Unhealthy air days in 30 yrs
- 2 days/yr
Risk factors via First Street. Map © Google.
Why this score? — see what drove the D grade
The composite is a weighted blend of 9 inputs, each scored 0–100. Each bar is that input's sub-score; the figure is the points it added to the 100-point composite (weight × sub-score).
- Cash flow +11.2/30.0
- ARV discount +7.5/15.0
- 1% rule +4.3/10.0
- Rent growth +4.1/5.0
- Livability +3.7/5.0
- Schools +3.4/10.0
- DSCR +3.3/10.0
- Condition / age +2.8/5.0
- Appreciation +0.0/10.0
$250,000
🖨 Deal sheet 📄 Offer letter ✓ Due diligence
Listing remarks MLS
Welcome to this desirable end-unit condo nestled in the quiet Castle Villa Condominiums, offering peaceful and scenic views of the pond. The main level boasts a bright, open-concept floor plan where the living and dining areas flow seamlessly into a fantastic sunroom, alongside two comfortable bedrooms and a full bathroom. Downstairs, the fully finished lower level doubles your comfort with a second living area, a third bedroom, a second full bathroom, dedicated laundry, and a rare second walk-out sunroom that brings you even closer to nature. Complete with a detached garage, this beautiful home perfectly blends spacious living with a tranquil, maintenance-free lifestyle. Seller has requested that all offers be reviewed 6/10/26 at 12pm.
Key facts
- End-unit condo
- Second living area
- Sunroom
Tags
Property features AI
Finance
- Other: Property type: Residential condominium
- HOA & community: Monthly association fee (about $212) covering water, trash, sewer, snow removal, and lawn/yard care; Association allows pets
Exterior
- Parking: Attached garage (1 car)
- Utilities: Public water; Natural gas water heater; Public sewer
- Home design: Ranch-style condominium; Living area approximately 1,696 square feet
- Construction: Built in 1982; Brick and vinyl siding exterior
- Exterior features: Pond on property; Lot of approximately 14.22 acres
Interior
- Kitchen: Dishwasher; Range; Microwave; Refrigerator
- Bedrooms: Primary bedroom; Bedroom 2; Bedroom 3
- Bathrooms: 2 full bathrooms
- Heating & cooling: Forced air heating; Has heating; Has cooling
- Interior features: Eat-in kitchen; Full basement; 6 total rooms
- Laundry & utility: Washer; Dryer; Laundry room; Utility room
Neighborhood map
What this means for you Summary
Snapshot
- This is a 3-bed/2.0-bath condo listed at $250k. Condition is rated average.
Deal economics
- At list price, monthly cash flow is $-96 ($-1k/yr) — negative.
- To cash-flow at today's rent, offer at most $236k (5.6% below list).
- To meet the 1% rule (rent ≥ 1% of price), the offer needs to be $233k (6.7% below list).
- Recommended offer: $233k (6.7% below list) — sets the bar for 1% rule.
- Cap rate 5.8% vs local median 3.7% in Kentwood — top-decile yield for the area; either an underpriced asset or a hidden risk that comps aren't pricing in. Stress-test before assuming the spread holds.
Location & tenants
- Location reads 74/100 on livability (#191 in MI, #4,892 nationally) — a middle-class / working-renter tenant base. Strengths: cost of living A+, housing A+, schools A-; Watch: commute C-, crime D, amenities F.
- Kentwood Public Schools (suburban): math 34% / reading 46% proficiency, ranked #206 of 540 in MI (top 38%) — families likely to look elsewhere, expect single-tenant / working-renter base with shorter leases.
- Market conditions: Rents rising fast (+6.5%/yr); 147 active listings in the ZIP; 3 comparable units currently listed for rent nearby; rentals leasing fast (median 3d on market — plan ~1-2 weeks tenant-placement turnaround); 2,253 units permitted in Kent County in 2024 (969 in 5+ unit buildings).
- This rent runs 39% of the median local income ($71k/yr) — at the standard rent-burdened threshold; future hikes will face affordability resistance.
Forward outlook
- Local home prices are declining (-3.0%/yr); year-one equity from $2k of loan paydown is wiped out by about $8k of value loss. Plan a longer hold.
- Kent County population projected at +22% by 2050 — long-run rental-demand tailwind backs the buy-and-hold thesis.
Negotiation context
- Only 8 days on market — expect competitive offers; lowballing is unlikely to land.
- 7 sale attempts since 9y ago with the ask held roughly flat each time — persistent listings suggest the price (not the market) is what's stuck; bring a comps-based counter.
- Current owner paid $145k; list at $250k implies a 72% gain — meaningful room to come down on a strong offer.
Risks & watch-outs
- Climate carrying-cost: moderate flood risk — expect insurance premiums to compound above CPI over the hold.
Questions for the listing agent
- What do current leases actually rent for vs. the listed asking? Can we see a recent rent roll and the last 12 months of T-12 income?
- What does the HOA fee cover, when was the last increase, and are there any pending special assessments or reserve-fund shortfalls?
- Any open or pending special assessments — roof, HVAC, plumbing, elevator, façade? What's the per-unit balance and payoff schedule, and is the seller paying it off at close or rolling it to the buyer?
- Is there a deadline driving the sale (1031 exchange, divorce, estate, relocation)? That informs how much negotiation room exists.
- Schools are A-rated — typically a magnet for longer-tenancy family renters. What's the average tenant stay here, and is there a school-zone premium baked into asking?
- Crime grade is D in this area — have there been break-ins, vandalism, or insurance claims at this property in the last 3 years? What carrier currently insures it and at what premium?
- The area grade is low — what's the realistic commute time and amenity access for the typical tenant pool here? Any planned neighborhood developments (good or bad) we should know about?
- What's the average days-on-market for RENTAL listings here right now (not sales)? A rising rental-DOM trend means longer vacancies and softer asking-rent achievability than the comps imply.
- What's the recent tenant-quality profile in this submarket — average credit score on applications, eviction rate, late-payment / NSF rate, and stable-employment percentage? A property-management company in the area should have these aggregated.
- How much new apartment / multifamily construction is in the pipeline within 1–3 miles? Heavy new supply (>2% of stock underway) typically softens rents 12–24 months out; light construction supports rent growth.
Investment metrics
- 1% rule
- 0.93% ✗
- Cap rate
- 5.83%
- Cash-on-cash
- -1.65%
- DSCR
- 0.93
- GRM
- 8.9
CMA / ARV
No comps found within radius.
Projected returns pro-forma
-3.0% appreciation · 6.55% rent growth · sell at horizon
- IRR
- -14.6%
- Equity multiple
- 0.46×
- Total profit
- $-37,848
- Equity at exit
- $37,276
- IRR
- -0.4%
- Equity multiple
- 0.97×
- Total profit
- $-2,080
- Equity at exit
- $21,615
Cash invested: $70,000 (down + closing). Projections, not guarantees.
Landlord ↔ Tenant lean methodology
- Overall (STATE)
- 62 Landlord-Friendly
- State Michigan
- 62 Landlord-Friendly · EVEN
- County
- — inherits STATE
- City
- — inherits STATE
ZIP-level market 49512
- Home prices YoY
- -15.9%
- Rents YoY
- 6.5%
- Active inventory
- 147
- Price-to-rent
- 8.9×
Monthly cashflow live
- Estimated rent
- $2,333 medium interval (Pro) →
- Mortgage (P&I)
- −$1,311
- Tax est. 1.5%
- −$312 /mo · $3,750/yr
- Insurance
- −$104
- HOA
- −$212
- Vacancy / Maint / Mgmt
- −$490
- Net cashflow
- $-96
Break-even live
UW: 25.0% down · 7.5% · 30yr · 1.5% tax · 5.0% vac · 8.0% maint · 8.0% mgmt
Financing live
Cash to close
- Down payment
- $62,500
- Closing costs
- $7,500
- Reserves months
- —
- Total cash needed
- —
Loan-product check · same deal, 3 products live
Conventional
25% down · 7.5% · 30yr
- Down + closing
- —
- Monthly P&I
- —
- Monthly cashflow
- —
- DSCR
- —
- Eligible?
- —
Personal DTI + credit; lowest rate.
DSCR
20% down · 8.5% · 30yr
- Down + closing
- —
- Monthly P&I
- —
- Monthly cashflow
- —
- DSCR
- —
- Eligible?
- —
No personal income docs; deal must DSCR.
Hard money
10% down · 12.0% · 12mo
- Down + closing
- —
- Monthly P&I
- —
- Monthly cashflow
- —
- DSCR
- —
- Eligible?
- —
Short-term bridge; refi at stabilization.
Rent comps 3 comps
| Address | Beds | Baths | Sqft | Rent | $/sqft | DOM | Units | Dist |
|---|---|---|---|---|---|---|---|---|
| 2859 Bransford Dr SE Grand Rapids, MI | 4.0 | 2.0 | 1667 | $2,625 | $1.57 | 10d | 1 | 0.38mi |
| 4260 Hidden Lakes Dr SE Kentwood, MI | 1.0–2.0 | 1.0–2.0 | 931 | $1,795 | $1.93 | 2d | 21 | 1.31mi |
| 3300 E Paris Ave SE Kentwood, MI | 1.0–2.0 | 1.0–2.0 | 1012 | $1,919 | $1.90 | 2d | 64 | 1.48mi |
HOA detail condo
- Monthly dues
- $212 · $2,544/yr
- Assessments
- None detected in remarks — confirm with the listing agent.
Listing history 6 events
-
2026-06-13statusdays on market $250,000 Pending 8 DOM
-
2026-06-10days on market $250,000 Active 7 DOM
-
2026-06-09days on market $250,000 Active 6 DOM
-
2026-06-08days on market $250,000 Active 5 DOM
-
2026-06-07remarks 699-char remark
-
2026-06-07$250,000 Active 4 DOM
ⓘ Source: listings_history table (triggers on properties + properties_extension) + one-shot
backfill from property_details.listing_events for pre-trigger history.
Climate risk First Street
- Flood 5/10 Major FEMA zone X (unshaded) · 52% chance over 30 yrs
- Wildfire 1/10 Low
- Heat 2/10 Low 7 d/yr ≥96°F today · 16 d/yr by 30 yrs out
- Wind 2/10 Low
- Air quality 2/10 Low 2 unhealthy d/yr today · 2 by 30 yrs out
Nearby sold comps map
Loading sold comps map…
Walkable amenities ~0.75 mi
Loading nearby amenities…
Taxation est. · year 1
- Rental income
- $28,001
- − Mortgage interest
- −$14,004
- − Property taxes
- −$3,750
- − Insurance
- −$1,250
- − Repairs & maintenance
- −$2,240
- − Management
- −$2,240
- − HOA
- −$2,544
- − Depreciation
- −$7,273
- Taxable loss
- −$5,300
- Est. tax savings @ 24.0%
- +$1,272
- After-tax cash flow
- $116/yr
For passive investors: Depreciation is non-cash, so a rental often shows a tax loss while cash-flowing — sheltering income. Rental losses are passive: they offset passive income freely, and up to $25,000/yr can offset ordinary (W-2) income if you actively participate and your MAGI is under $100k (phasing out to $0 by $150k); unused losses carry forward. On sale, claimed depreciation is recaptured at up to 25%, and gains may owe capital-gains tax (a 1031 exchange can defer both). Figures are a year-1 estimate at your 24.0% rate — not tax advice; consult a CPA.
Condition & rehab AI · 12 photos
This end-unit condo offers a bright, open-concept floor plan with a sunroom and two bedrooms. It requires minor repairs and maintenance to enhance its curb appeal and interior aesthetics.
Repairs flagged
- Minor kitchen cabinets — slight wear
- Minor bathroom vanity — slight wear
Value-add opportunities
- Both paint interior walls — enhances curb appeal and interior aesthetics
- Both replace carpet — improves comfort and reduces maintenance
- Both update kitchen cabinets — modernizes the space and increases value
- Both update bathroom vanity — modernizes the space and increases value
Renovation cost estimate screening
| Repair item | Severity | Est. cost |
|---|---|---|
| kitchen cabinets · slight wear | Minor | $500–3,000 |
| bathroom vanity · slight wear | Minor | $500–3,000 |
| Total estimated repair cost · 2 items | $1,000–6,000 |
Value-add ROI direction
- Both paint interior walls — enhances curb appeal and interior aesthetics ↑
- Both replace carpet — improves comfort and reduces maintenance ↑
- Both update kitchen cabinets — modernizes the space and increases value ↑
- Both update bathroom vanity — modernizes the space and increases value ↑
ⓘ Cost ranges are severity-bucket heuristics (US national rule-of-thumb). Get contractor quotes + a written scope before underwriting a rehab budget.
Schools (NCES district)
- District
- Kentwood Public Schools
- NCES district ID
- 2620340
- Math proficiency
- 34% ▼ -4.00%
- Reading proficiency
- 46% ▼ -3.00%
- Median HH income
- $48,962
- Composite
- 34.35/100
- National rank
- #5226
- State rank
- #206 of 540 in MI
Livability — Kentwood
- Score
- 74/100
- State rank
- #191
- US rank
- #4892
Category grades
Schools grade is shown separately in the Schools card above.
Census & demographics
- Census place
- Kentwood, MI
- County
- Kent County · 533,805 people
- City population
- 130,591
- Metro
- Grand Rapids-Kentwood, MI
- Population (ZIP)
- 18,373
- Household income
- $71,329
- Rent vs Own
- Severe rent burden
- 1230.0
Population outlook (Kent County) Hauer SSP2
- Today (2025)
- 712,484 people
- By 2030
- 748,618 · +5.1%
- By 2040
- 814,777 · +14.4%
- By 2050
- 868,556 · +21.9%
- By 2075
- 966,487 · +35.7%
- By 2100
- 967,975 · +35.9%
Race, ethnicity, and origin ACS 2023
- Neighborhood character
- Diverse neighborhood (Simpson 0.57)
- Race & ethnicity
- White 62% Black 18% Hispanic / Latino 9% Two or more races 9% Asian 5%
- Hispanic origin (detail)
- Mexican 6% Puerto Rican 2%
- Common ancestry
- Iranian 13% American 5% Romanian 3%
- Foreign-born
- 17% · Vietnam, Canada, Philippines
- Languages at home
- 79% English-only · Russian/Polish/Slavic 4% Spanish 4% Other Indo-European 3%
Political lean MEDSL · Kent
- 2024 margin
- Lean D (+5.4) · D 51.8% · R 46.5% · Other 1.7%
- 2008→2024 swing
- +4.8pp toward D · 2008: 0.5pp · 2024: 5.4pp
- All cycles
- 2024: D+5.4 2020: D+6.1 2016: R+3.1 2012: R+7.9 2008: D+0.5
Not yet ingested
- Civics
- —
Market trends
- HPI YoY
- ▼ -43.77%
- Current HPI
- 231.7742
- Rent YoY
- ▲ 6.55%
- Metro
- Grand Rapids-Kentwood, MI
- State GDP YoY
- ▲ 1.37%
- F500 in state
- 28
Industry mix (Fortune 500 HQ in MI)
| Industry | F500 HQs | Revenue |
|---|---|---|
| Automotive Parts | 3 | $48B |
|
||
| Automotive | 2 | $372B |
|
||
| Chemicals | 1 | $45B |
|
||
| Automotive Retail | 1 | $29B |
|
||
| Healthcare / Medical Devices | 1 | $23B |
|
||
| Automotive Technology | 1 | $20B |
|
||
Price history
+92.5% since first listed13 events — show timeline
- 2026-06-03 Listed $250,000 SW Michigan MLS
- 2026-06-03 Listed $250,000 MiRealSource-MiMLS
- 2026-06-03 Listed $250,000 REALCOMP
- 2019-09-13 Sold (MLS) $145,000 SW Michigan MLS
- 2019-09-13 Sold (MLS) $145,000 REALCOMP
- 2019-08-10 Pending — SW Michigan MLS
- 2019-08-06 Listed $139,900 SW Michigan MLS
- 2019-08-06 Listed $139,900 REALCOMP
- 2017-05-11 Sold (MLS) $131,000 SW Michigan MLS
- 2017-05-11 Sold (MLS) $131,000 REALCOMP
- 2017-03-20 Pending — SW Michigan MLS
- 2017-03-16 Listed $129,900 SW Michigan MLS
- 2017-03-16 Listed $129,900 REALCOMP
Cash-flow waterfall
monthlySold comps — $/sqft
last 12 mo · ≤1 miLoading sold comps…