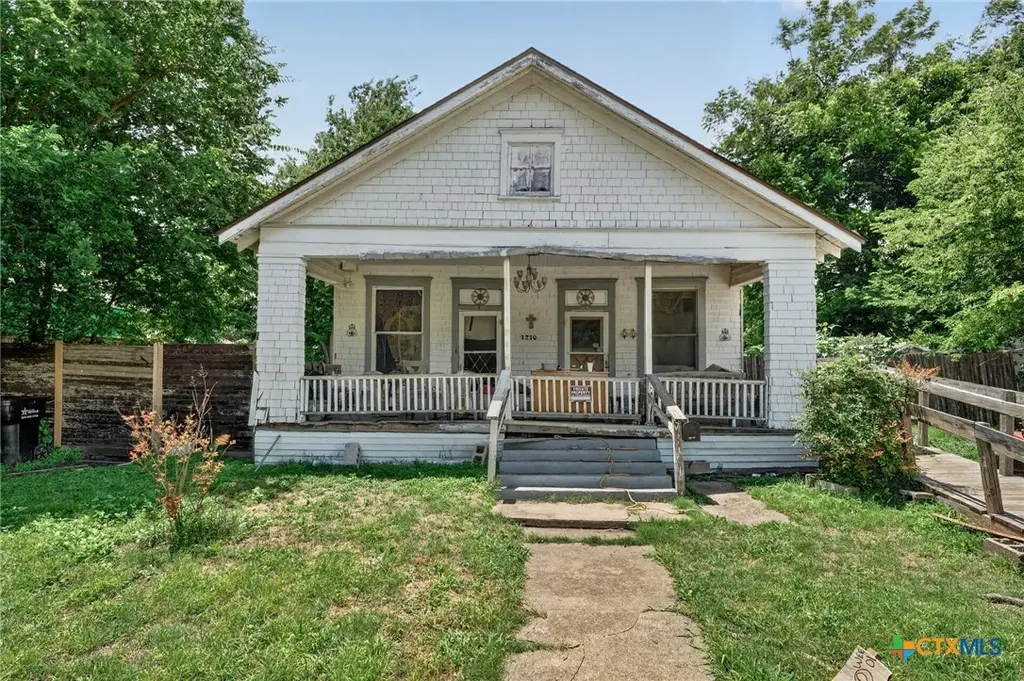
1210 S 5th St · Temple, TX
Flood risk 1/10 · Minimal
- FEMA flood zone
- X (unshaded)
- Chance of flooding over 30 yrs
- 0.0%
- Est. flood insurance / yr
- $507 – $1,088
Fire risk 1/10 · Minimal
- Est. fire insurance / yr
- $1,222 – $2,270
Heat risk 7/10 · Major
- Hot days now (above 108°F)
- 7 days/yr
- Hot days in 30 yrs
- 22 days/yr
Wind risk 6/10 · Moderate
- Chance of severe wind over 30 yrs
- 70.0%
Air-quality risk 1/10 · Minimal
- Unhealthy air days now
- 0 days/yr
- Unhealthy air days in 30 yrs
- 0 days/yr
Risk factors via First Street. Map © Google.
Why this score? — see what drove the B- grade
The composite is a weighted blend of 9 inputs, each scored 0–100. Each bar is that input's sub-score; the figure is the points it added to the 100-point composite (weight × sub-score).
- Cash flow +30.0/30.0
- DSCR +10.0/10.0
- 1% rule +9.9/10.0
- ARV discount +7.5/15.0
- Livability +3.8/5.0
- Schools +2.7/10.0
- Rent growth +2.6/5.0
- Condition / age +2.5/5.0
- Appreciation +0.0/10.0
$65,000
🖨 Deal sheet (PDF) 📄 Offer letter ✓ Due diligence
Listing remarks
Investor Special! Great opportunity to add a duplex to your portfolio in the heart of Temple. This property features two separate 1-bedroom, 1-bathroom units, each with its own private entrance, offering flexibility for a variety of rental or occupancy options. The property showcases a classic front porch and traditional architectural character and is conveniently located within Temple with access to downtown amenities, major employers, shopping, dining, and healthcare facilities. Whether you're looking to expand an existing portfolio or acquire your first investment property, this duplex offers potential and flexibility under one roof. The property also offers opportunities for updates and
Key facts
- Front porch
- Private entrance
- Shopping
Tags
Property features AI
Finance
- Other: Property condition: Resale
- Financial info: Multi-unit property with 2 total units
- HOA & community: No HOA information provided
Exterior
- Parking: No parking details provided
- Security: No security features listed
- Utilities: Electricity available and on property; Public water
- Home design: Single-story building
- Construction: Pillar/post/pier foundation; Composition and shingle roof; Construction details: See remarks; Built year per assessor
- Exterior features: Property located outside city limits; Lot between one-half and one acre
Interior
- Kitchen: No kitchen appliance details provided
- Bedrooms: Two 1-bedroom units
- Flooring: Tile
- Bathrooms: Two 1-bath units
- Heating & cooling: Electric heating; Wall/window cooling units
- Interior features: Tile flooring; No additional interior features listed
- Laundry & utility: No laundry or utility appliances listed
Neighborhood map
What this means for you Summary
Snapshot
- This is a 2-bed/2.0-bath townhouse listed at $65k.
Deal economics
- At list price, monthly cash flow is $274 ($3k/yr) — positive.
- The deal already cash-flows at list — no discount required.
- Meets the 1% rule at list price ($971 rent vs $65k).
- Recommended offer: $64k (1.5% below list) — sets the bar for market timing.
- Cap rate 11.4% vs local median 3.6% in Temple — top-decile yield for the area; either an underpriced asset or a hidden risk that comps aren't pricing in. Stress-test before assuming the spread holds.
Location & tenants
- Location reads 75/100 on livability (#122 in TX, #3,814 nationally) — a middle-class / working-renter tenant base. Strengths: cost of living A+, housing A+, health & safety A+; Watch: schools C-, commute C-, crime D+.
- Temple ISD (urban): math 32% / reading 31% proficiency, ranked #590 of 826 in TX (top 71%) — families likely to look elsewhere, expect single-tenant / working-renter base with shorter leases; 66% free/reduced lunch — lower-income household profile, screen leases tightly.
- Market conditions: Rents flat; 276 active listings in the ZIP; 22 comparable units currently listed for rent nearby; rentals at typical pace (median 15d on market — plan ~3-4 weeks tenant-placement turnaround); 41% of comp listings sitting > 30 days — soft ceiling on asking rent; 3,222 units permitted in Bell County in 2024 (246 in 5+ unit buildings).
Forward outlook
- Local home prices are declining (-3.0%/yr); year-one equity from $449 of loan paydown is wiped out by about $2k of value loss. Plan a longer hold.
- Bell County population projected at +21% by 2050 — long-run rental-demand tailwind backs the buy-and-hold thesis.
- At projected returns (-3.0% appreciation + 0.3% rent growth), your $18k cash investment doubles in ~9 years — after that, you're playing with house money.
Negotiation context
- It's been on market 15 days — a 2% lower offer ($64k) is reasonable based on typical stale-listing flexibility.
- 2 sale attempts since 13y ago; this cycle's ask has dropped $25k (28%) from the opening price — seller is motivated, your offer sets the floor, not the list.
Risks & watch-outs
- Climate carrying-cost: major wind risk, 70% chance of damaging wind over 30y; extreme-heat days projected 7→22/yr by 2055 (HVAC capex compounding) — expect insurance premiums to compound above CPI over the hold.
Questions for the listing agent
- Is there a deadline driving the sale (1031 exchange, divorce, estate, relocation)? That informs how much negotiation room exists.
- Crime grade is D in this area — have there been break-ins, vandalism, or insurance claims at this property in the last 3 years? What carrier currently insures it and at what premium?
- What's the average days-on-market for RENTAL listings here right now (not sales)? A rising rental-DOM trend means longer vacancies and softer asking-rent achievability than the comps imply.
- What's the recent tenant-quality profile in this submarket — average credit score on applications, eviction rate, late-payment / NSF rate, and stable-employment percentage? A property-management company in the area should have these aggregated.
- How much new for-sale + rental construction is in the pipeline within 1–3 miles? Heavy new supply typically softens prices + rents 12–24 months out; constrained supply supports both.
Investment metrics
- 1% rule
- 1.49% ✓
- Cap rate
- 11.35%
- Cash-on-cash
- 18.07%
- DSCR
- 1.80
- GRM
- 5.6
CMA / ARV
No comps found within radius.
Projected returns pro-forma
-3.0% appreciation · 0.33% rent growth · sell at horizon
- IRR
- 6.4%
- Equity multiple
- 1.24×
- Total profit
- $4,422
- Equity at exit
- $9,692
- IRR
- 13.1%
- Equity multiple
- 1.91×
- Total profit
- $16,613
- Equity at exit
- $5,620
Cash invested: $18,200 (down + closing). Projections, not guarantees.
Landlord ↔ Tenant lean methodology
- Overall (STATE)
- 87 Strongly Landlord-Friendly
- State Texas
- 87 Strongly Landlord-Friendly · R+5
- County
- — inherits STATE
- City
- — inherits STATE
ZIP-level market 76504
- Rents YoY
- 0.3%
- Active inventory
- 276
- Price-to-rent
- 5.6×
Monthly cashflow live
- Estimated rent
- $971 high interval (Pro) →
- Mortgage (P&I)
- −$341
- Tax from tax record
- −$125 /mo · $1,498/yr
- Insurance
- −$27
- HOA
- −$0
- Vacancy / Maint / Mgmt
- −$204
- Net cashflow
- $274
Break-even live
Sensitivity live
| Price | -10% $311 | -5% $292 | +0% $274 | +5% $256 | +10% $237 |
|---|---|---|---|---|---|
| Rent | -10% $197 | -5% $236 | +0% $274 | +5% $312 | +10% $351 |
| Rate | -1.0pp $307 | -0.5pp $291 | base $274 | +0.5pp $257 | +1.0pp $240 |
UW: 25.0% down · 7.5% · 30yr · 1.5% tax · 5.0% vac · 8.0% maint · 8.0% mgmt
Financing live
Cash to close
- Down payment
- $16,250
- Closing costs
- $1,950
- Reserves months
- —
- Total cash needed
- —
Loan-product check · same deal, 3 products live
Conventional
25% down · 7.5% · 30yr
- Down + closing
- —
- Monthly P&I
- —
- Monthly cashflow
- —
- DSCR
- —
- Eligible?
- —
Personal DTI + credit; lowest rate.
DSCR
20% down · 8.5% · 30yr
- Down + closing
- —
- Monthly P&I
- —
- Monthly cashflow
- —
- DSCR
- —
- Eligible?
- —
No personal income docs; deal must DSCR.
Hard money
10% down · 12.0% · 12mo
- Down + closing
- —
- Monthly P&I
- —
- Monthly cashflow
- —
- DSCR
- —
- Eligible?
- —
Short-term bridge; refi at stabilization.
Rent comps 22 comps
| Address | Beds | Baths | Sqft | Rent | $/sqft | DOM | Units | Dist |
|---|---|---|---|---|---|---|---|---|
| 1511 S 11th St Temple, TX | 2.0 | 1.0 | 735 | $1,095 | $1.49 | 14d | 1 | 0.24mi |
| 1118 Martin Luther King Junior Dr Unit D Temple, TX | 1.0 | 1.0 | 572 | $750 | $1.31 | 14d | 1 | 0.43mi |
| 2405 S 13th St Temple, TX | 1.0–2.0 | 1.0–2.0 | 835 | $1,065 | $1.28 | 14d | 4 | 0.82mi |
| 804 S 31st St Temple, TX | 1.0 | 1.0 | 522 | $799 | $1.53 | 44d | 1 | 0.90mi |
| 804 S 31st St Temple, TX | 1.0 | 1.0 | 522 | $649 | $1.24 | 24d | 1 | 0.90mi |
| 901 S 20th St Unit b Temple, TX | 1.0 | 1.0 | 615 | $750 | $1.22 | 14d | 1 | 0.93mi |
| 510 S Knob St Unit A Temple, TX | 1.0 | 1.0 | 560 | $650 | $1.16 | 44d | 1 | 0.95mi |
| 714 S 20th St Unit B Temple, TX | 2.0 | 1.0 | 650 | $750 | $1.15 | 44d | 1 | 0.95mi |
| 513 S Knob St Unit B Temple, TX | 1.0 | 1.0 | 560 | $550 | $0.98 | 44d | 1 | 0.96mi |
| 1104 S Terrace St Unit A Temple, TX | 1.0 | 1.0 | 560 | $750 | $1.34 | 14d | 1 | 0.99mi |
| 1802 West Avenue H Unit A Temple, TX | 1.0 | 1.0 | 730 | $700 | $0.96 | 44d | 1 | 1.03mi |
| 1802 West Avenue H Unit D Temple, TX | 2.0 | 1.0 | 700 | $850 | $1.21 | 44d | 1 | 1.03mi |
| 640 SW H K Dodgen Loop Temple, TX | 1.0–2.0 | 1.0–2.0 | 857 | $1,899 | $2.22 | 14d | 1 | 1.04mi |
| 514 E Central Ave Unit B Temple, TX | 1.0 | 1.0 | 560 | $695 | $1.24 | 14d | 1 | 1.07mi |
| 607 A S Terrace ST Unit A Temple, TX | 1.0 | 1.0 | 560 | $550 | $0.98 | 44d | 1 | 1.11mi |
| 701a S 24th St Unit A Temple, TX | 1.0 | 1.0 | 550 | $795 | $1.45 | 44d | 1 | 1.14mi |
| 701 S 24th St Unit B Temple, TX | 1.0 | 1.0 | 555 | $795 | $1.43 | 44d | 1 | 1.14mi |
| 606 S 26th St Apt A Temple, TX | 1.0 | 1.0 | 580 | $750 | $1.29 | 14d | 1 | 1.18mi |
| 2102 Scott Blvd Temple, TX | 1.0–3.0 | 1.0–2.0 | 924 | $1,717 | $1.86 | 14d | 22 | 1.23mi |
| 2510 S 31st St Temple, TX | 1.0–3.0 | 1.0–2.0 | 987 | $1,318 | $1.34 | 14d | 26 | 1.29mi |
| 720 Azalea Dr Temple, TX | 1.0–2.0 | 1.0–2.0 | 780 | $1,375 | $1.76 | 14d | 10 | 1.42mi |
| 807 N 4th St Unit A Temple, TX | 1.0 | 1.0 | 615 | $695 | $1.13 | 14d | 1 | 1.48mi |
Listing history 10 events
-
2026-06-18days on market $65,000 Active 15 DOM
-
2026-06-17days on market $65,000 Active 14 DOM
-
2026-06-16days on market $65,000 Active 13 DOM
-
2026-06-15days on market $65,000 Active 12 DOM
-
2026-06-14pricedays on market $65,000 Active 10 DOM
-
2026-06-10pricedays on market $80,000 Active 7 DOM
-
2026-06-09days on market $90,000 Active 6 DOM
-
2026-06-08days on market $90,000 Active 5 DOM
-
2026-06-07remarks 699-char remark
-
2026-06-07$90,000 Active 4 DOM
ⓘ Source: listings_history table (triggers on properties + properties_extension) + one-shot
backfill from property_details.listing_events for pre-trigger history.
Tax reassessment forecast TX · Resets to sale price
- Current annual tax
- $1,498 · $125/mo
- Projected year-2 tax
- $1,498 · $125/mo
- Expected delta
- $0/yr ($0/mo · 0.0%)
ⓘ Screening estimate from a state-policy table — verify with the county assessor before closing.
Climate risk First Street
- Flood 1/10 Low FEMA zone X (unshaded) · 0% chance over 30 yrs
- Wildfire 1/10 Low
- Heat 7/10 Severe 7 d/yr ≥108°F today · 22 d/yr by 30 yrs out
- Wind 6/10 Major 70% chance of damaging wind over 30 yrs
- Air quality 1/10 Low 0 unhealthy d/yr today · 0 by 30 yrs out
Nearby sold comps map
Loading sold comps map…
Walkable amenities ~0.75 mi
Loading nearby amenities…
Taxation est. · year 1
- Rental income
- $11,648
- − Mortgage interest
- −$3,641
- − Property taxes
- −$1,498
- − Insurance
- −$325
- − Repairs & maintenance
- −$932
- − Management
- −$932
- − Depreciation
- −$1,891
- Taxable income
- $2,429
- Est. tax owed @ 24.0%
- −$583
- After-tax cash flow
- $2,705/yr
For passive investors: Depreciation is non-cash, so a rental often shows a tax loss while cash-flowing — sheltering income. Rental losses are passive: they offset passive income freely, and up to $25,000/yr can offset ordinary (W-2) income if you actively participate and your MAGI is under $100k (phasing out to $0 by $150k); unused losses carry forward. On sale, claimed depreciation is recaptured at up to 25%, and gains may owe capital-gains tax (a 1031 exchange can defer both). Figures are a year-1 estimate at your 24.0% rate — not tax advice; consult a CPA.
Schools (NCES district)
- District
- Temple ISD
- NCES district ID
- 4842330
- Math proficiency
- 32% ▼ -8.00%
- Reading proficiency
- 31% ▼ -4.00%
- Median HH income
- $43,120
- Composite
- 26.8/100
- National rank
- #7123
- State rank
- #590 of 826 in TX
Livability — Temple
- Score
- 75/100
- State rank
- #122
- US rank
- #3814
Category grades
Schools grade is shown separately in the Schools card above.
Census & demographics
- Census place
- Temple, TX
- County
- Bell County · 345,090 people
- City population
- 96,587
- Metro
- Killeen-Temple, TX
- Population (ZIP)
- 26,166
- Household income
- $52,803
- Rent vs Own
- Severe rent burden
- 1489.0
Population outlook (Bell County) Hauer SSP2
- Today (2025)
- 371,114 people
- By 2030
- 389,104 · +4.8%
- By 2040
- 420,592 · +13.3%
- By 2050
- 447,779 · +20.7%
- By 2075
- 499,130 · +34.5%
- By 2100
- 505,680 · +36.3%
Race, ethnicity, and origin ACS 2023
- Neighborhood character
- Diverse neighborhood (Simpson 0.65)
- Race & ethnicity
- White 49% Hispanic / Latino 29% Black 15% Two or more races 14% Asian 1%
- Hispanic origin (detail)
- Mexican 24% Puerto Rican 2%
- Common ancestry
- Italian 2% Romanian 2% Lithuanian 1%
- Foreign-born
- 8% · Canada
- Languages at home
- 81% English-only · Spanish 17% Other Indo-European 1%
Political lean MEDSL · Bell
- 2024 margin
- R (+16.2) · D 41.3% · R 57.6% · Other 1.1%
- 2008→2024 swing
- -6.5pp toward R · 2008: -9.8pp · 2024: -16.2pp
- All cycles
- 2024: R+16.2 2020: R+8.5 2016: R+15.1 2012: R+16.4 2008: R+9.8
Not yet ingested
- Civics
- —
Market trends
- HPI YoY
- ▼ -159.28%
- Current HPI
- 186.1148
- Rent YoY
- ▲ 0.33%
- Metro
- Killeen-Temple, TX
- State GDP YoY
- ▲ 3.95%
- F500 in state
- 110
Industry mix (Fortune 500 HQ in TX)
| Industry | F500 HQs | Revenue |
|---|---|---|
| Energy | 16 | $1,198B |
|
||
| Technology | 5 | $198B |
|
||
| Engineering / Construction | 4 | $72B |
|
||
| Energy Services | 3 | $60B |
|
||
| Utilities | 3 | $41B |
|
||
| Healthcare | 2 | $330B |
|
||
Price history
+400.0% since first listed5 events — show timeline
- 2026-06-02 Listed $90,000 CTXMLS
- 2020-09-14 Sold (Public Records) — Public Records
- 2013-08-14 Sold (Public Records) — Public Records
- 2013-07-10 Listed $18,000 CTXMLS
- 1992-06-12 Sold (Public Records) — Public Records
Property tax history
+5.8%/yrLatest (2025): $1,498 · +9.8% YoY. Source: county tax records.
Cash-flow waterfall
monthlySold comps — $/sqft
last 12 mo · ≤1 miLoading sold comps…