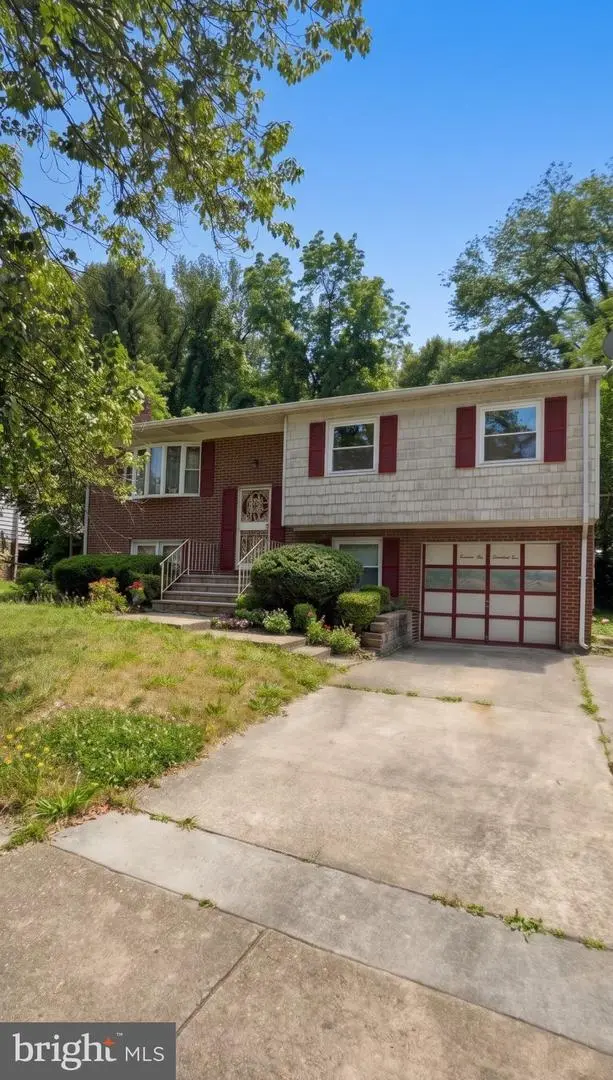
16605 Village Dr W · Marlboro Meadows, MD
Flood risk 1/10 · Minimal
- FEMA flood zone
- X (unshaded)
- Chance of flooding over 30 yrs
- 0.0%
- Est. flood insurance / yr
- $473 – $860
Fire risk 4/10 · Minor
- Est. fire insurance / yr
- $755 – $1,403
Heat risk 8/10 · Major
- Hot days now (above 103°F)
- 7 days/yr
- Hot days in 30 yrs
- 16 days/yr
Wind risk 6/10 · Moderate
- Chance of severe wind over 30 yrs
- 27.0%
Air-quality risk 3/10 · Minor
- Unhealthy air days now
- 2 days/yr
- Unhealthy air days in 30 yrs
- 3 days/yr
Risk factors via First Street. Map © Google.
Why this score? — see what drove the D grade
The composite is a weighted blend of 9 inputs, each scored 0–100. Each bar is that input's sub-score; the figure is the points it added to the 100-point composite (weight × sub-score).
- ARV discount +13.6/15.0
- Cash flow +9.0/30.0
- Rent growth +5.0/5.0
- Livability +3.1/5.0
- 1% rule +2.7/10.0
- DSCR +2.5/10.0
- Condition / age +2.5/5.0
- Schools +1.7/10.0
- Appreciation +0.0/10.0
$365,000
🖨 Deal sheet 📄 Offer letter ✓ Due diligence
Listing remarks
Attention handymen, contractors, and buyers looking for a project! This is your chance to secure a fixer-upper and build serious equity. Priced well below market, this pre-foreclosure property offers strong potential for investors or savvy buyers seeking built-in value. With an estimated after-repair value of $425,000 or more, this is a prime value-add opportunity. The home needs work and is being sold as-is, but features solid structure and “good bones, ” making it an ideal renovation project. Perfect for cash buyers seeking a fast closing. Sale is subject to third-party approval. Don’t miss the opportunity to transform this property into a standout home or a profitable i
Key facts
- Garage
- Built 1969
- Listed 9 days
Property features AI
Finance
- Other: No additional financial amenities provided
- Financial info: Fee simple ownership
- HOA & community: No HOA details provided
Exterior
- Parking: Attached basement garage with space for one vehicle; Total of one garage/parking space
- Security: No security details provided
- Utilities: Public water; Public sewer
- Home design: Detached structure
- Construction: Frame construction; Slab foundation; Estimated year built
- Exterior features: Not located in a federal flood zone; Above-grade and below-grade structures present; Ground rent paid annually
Interior
- Kitchen: No kitchen appliance details provided
- Bedrooms: Three bedrooms on the main level
- Flooring: No flooring details provided
- Bathrooms: Three full bathrooms (two on the main level, one on the lower level)
- Heating & cooling: Central heating; Natural gas heating; Central air conditioning (electric)
- Interior features: Estimated living area; Finished lower level; Basement with English-style entry, garage access, and fully finished space
- Laundry & utility: No laundry details provided
Neighborhood map
What this means for you Summary
Snapshot
- This is a 3-bed/2.5-bath single-family listed at $365k.
Deal economics
- At list price, monthly cash flow is $-288 ($-3k/yr) — negative.
- To cash-flow at today's rent, offer at most $314k (13.9% below list).
- To meet the 1% rule (rent ≥ 1% of price), the offer needs to be $283k (22.6% below list).
- Recommended offer: $283k (22.6% below list) — sets the bar for 1% rule.
- Cap rate 5.3% vs local median 9.1% in Marlboro Meadows — below-typical yield; the buyer is paying a premium for something (appreciation thesis, condition, location) that the cap rate doesn't capture.
Location & tenants
- Location reads 62/100 on livability (#327 in MD) — a middle-class / working-renter tenant base. Strengths: employment A+, housing A+, crime A-; Watch: schools D, amenities F, commute F.
- Prince George'S County Public Schools (suburban): math 8% / reading 24% proficiency, ranked #21 of 24 in MD (top 88%) — low school quality limits family demand, transient renter base, plan for 1-2y turnover.
- Market conditions: Rents rising fast (+9.8%/yr); 309 active listings in the ZIP; high-income renter base; 1,481 units permitted in Prince George's County in 2024 (0 in 5+ unit buildings).
Forward outlook
- Local home prices are declining (-3.0%/yr); year-one equity from $3k of loan paydown is wiped out by about $11k of value loss. Plan a longer hold.
- Prince George's County population projected at +18% by 2050 — long-run rental-demand tailwind backs the buy-and-hold thesis.
Negotiation context
- Only 10 days on market — expect competitive offers; lowballing is unlikely to land.
- Current owner paid $49k; list at $365k implies a 645% gain — meaningful room to come down on a strong offer.
Risks & watch-outs
- Climate carrying-cost: major wind risk, 27% chance of damaging wind over 30y; extreme-heat days projected 7→16/yr by 2055 (HVAC capex compounding) — expect insurance premiums to compound above CPI over the hold.
Questions for the listing agent
- What do current leases actually rent for vs. the listed asking? Can we see a recent rent roll and the last 12 months of T-12 income?
- Built in 1969 — when were the roof, HVAC, electrical panel, plumbing, and water heater last replaced?
- Is there a deadline driving the sale (1031 exchange, divorce, estate, relocation)? That informs how much negotiation room exists.
- Schools are D-rated, which usually means shorter tenancies and higher turnover. Who's the typical renter profile here, and what's been the actual vacancy rate?
- The area grade is low — what's the realistic commute time and amenity access for the typical tenant pool here? Any planned neighborhood developments (good or bad) we should know about?
- What's the average days-on-market for RENTAL listings here right now (not sales)? A rising rental-DOM trend means longer vacancies and softer asking-rent achievability than the comps imply.
- What's the recent tenant-quality profile in this submarket — average credit score on applications, eviction rate, late-payment / NSF rate, and stable-employment percentage? A property-management company in the area should have these aggregated.
- How much new for-sale + rental construction is in the pipeline within 1–3 miles? Heavy new supply typically softens prices + rents 12–24 months out; constrained supply supports both.
Investment metrics
- 1% rule
- 0.77% ✗
- Cap rate
- 5.35%
- Cash-on-cash
- -3.38%
- DSCR
- 0.85
- GRM
- 10.8
CMA / ARV
- ARV (on-the-fly)
- $421,848
- Comps found
- 12
Show comp detail 12 sales within ~0.75 mi
| Address | Dist | Beds/Ba | Sqft | Sold | Price | $/sf | Match |
|---|---|---|---|---|---|---|---|
| 3907 Bishopmill Pl | 0.19mi | 4/2.5 (+1) | 1,066 (-6%) | 4mo | $397,000 | $372 | 73 |
| 17010 Village Dr W | 0.40mi | 3/3.0 | 1,108 (-2%) | 8mo | $415,000 | $375 | 69 |
| 17211 Usher Pl | 0.62mi | 3/3.0 | 1,196 (+6%) | 4mo | $330,000 | $276 | 56 |
| 3833 Halloway Cir | 0.05mi | 4/2.0 (+1) | 988 (-13%) | 16mo | $375,000 | $380 | 56 |
| 17212 Usher Pl | 0.60mi | 4/3.0 (+1) | 1,190 (+5%) | 4mo | $384,500 | $323 | 53 |
| 4306 Canyonview Dr | 0.52mi | 4/2.5 (+1) | 1,134 (0%) | 22mo | $470,000 | $414 | 53 |
| 16111 Village Dr W | 0.47mi | 3/2.0 | 1,300 (+15%) | 1mo | $440,000 | $338 | 51 |
| 17007 Fairway View Ln | 0.47mi | 3/2.0 | 988 (-13%) | 9mo | $316,000 | $320 | 47 |
| 3507 Halloway S | 0.34mi | 4/2.0 (+1) | 988 (-13%) | 12mo | $365,000 | $369 | 45 |
| 17002 Usher Pl | 0.43mi | 4/2.0 (+1) | 988 (-13%) | 9mo | $415,000 | $420 | 44 |
| 16400 Halloway Ct | 0.31mi | 3/1.5 | 1,300 (+15%) | 20mo | $355,000 | $273 | 40 |
| 16103 Village Dr W | 0.52mi | 4/2.0 (+1) | 988 (-13%) | 18mo | $475,000 | $481 | 33 |
Match score weights: distance 35% · size 25% · config 20% · recency 20%. Top-matched comps best support the ARV.
Projected returns pro-forma
-3.0% appreciation · 8.0% rent growth · sell at horizon
- IRR
- -16.5%
- Equity multiple
- 0.39×
- Total profit
- $-62,490
- Equity at exit
- $54,423
- IRR
- -1.2%
- Equity multiple
- 0.90×
- Total profit
- $-9,858
- Equity at exit
- $31,559
Cash invested: $102,200 (down + closing). Projections, not guarantees.
Landlord ↔ Tenant lean methodology
- Overall (STATE)
- 27 Tenant-Leaning
- State Maryland
- 27 Tenant-Leaning · D+14
- County
- — inherits STATE
- City
- — inherits STATE
ZIP-level market 20772
- Rents YoY
- 9.8%
- Active inventory
- 309
- Price-to-rent
- 10.8×
Monthly cashflow live
- Estimated rent
- $2,826 medium interval (Pro) →
- Mortgage (P&I)
- −$1,914
- Tax from tax record
- −$454 /mo · $5,451/yr
- Insurance
- −$152
- HOA
- −$0
- Vacancy / Maint / Mgmt
- −$594
- Net cashflow
- $-288
Break-even live
UW: 25.0% down · 7.5% · 30yr · 1.5% tax · 5.0% vac · 8.0% maint · 8.0% mgmt
Financing live
Cash to close
- Down payment
- $91,250
- Closing costs
- $10,950
- Reserves months
- —
- Total cash needed
- —
Loan-product check · same deal, 3 products live
Conventional
25% down · 7.5% · 30yr
- Down + closing
- —
- Monthly P&I
- —
- Monthly cashflow
- —
- DSCR
- —
- Eligible?
- —
Personal DTI + credit; lowest rate.
DSCR
20% down · 8.5% · 30yr
- Down + closing
- —
- Monthly P&I
- —
- Monthly cashflow
- —
- DSCR
- —
- Eligible?
- —
No personal income docs; deal must DSCR.
Hard money
10% down · 12.0% · 12mo
- Down + closing
- —
- Monthly P&I
- —
- Monthly cashflow
- —
- DSCR
- —
- Eligible?
- —
Short-term bridge; refi at stabilization.
Listing history 7 events
-
2026-06-18days on market $365,000 Active 10 DOM
-
2026-06-17days on market $365,000 Active 9 DOM
-
2026-06-16days on market $365,000 Active 8 DOM
-
2026-06-15days on market $365,000 Active 7 DOM
-
2026-06-13days on market $365,000 Active 5 DOM
-
2026-06-10remarks 681-char remark
-
2026-06-10$365,000 Active 1 DOM
ⓘ Source: listings_history table (triggers on properties + properties_extension) + one-shot
backfill from property_details.listing_events for pre-trigger history.
Tax reassessment forecast MD · Partial reset (capped growth)
- Current annual tax
- $5,451 · $454/mo
- Projected year-2 tax
- $5,451 · $454/mo
- Expected delta
- $0/yr ($0/mo · 0.0%)
ⓘ Screening estimate from a state-policy table — verify with the county assessor before closing.
Climate risk First Street
- Flood 1/10 Low FEMA zone X (unshaded) · 0% chance over 30 yrs
- Wildfire 4/10 Moderate
- Heat 8/10 Severe 7 d/yr ≥103°F today · 16 d/yr by 30 yrs out
- Wind 6/10 Major 27% chance of damaging wind over 30 yrs
- Air quality 3/10 Moderate 2 unhealthy d/yr today · 3 by 30 yrs out
Nearby sold comps map
Loading sold comps map…
Walkable amenities ~0.75 mi
Loading nearby amenities…
Taxation est. · year 1
- Rental income
- $33,915
- − Mortgage interest
- −$20,446
- − Property taxes
- −$5,451
- − Insurance
- −$1,825
- − Repairs & maintenance
- −$2,713
- − Management
- −$2,713
- − Depreciation
- −$10,618
- Taxable loss
- −$9,851
- Est. tax savings @ 24.0%
- +$2,364
- After-tax cash flow
- $-1,088/yr
For passive investors: Depreciation is non-cash, so a rental often shows a tax loss while cash-flowing — sheltering income. Rental losses are passive: they offset passive income freely, and up to $25,000/yr can offset ordinary (W-2) income if you actively participate and your MAGI is under $100k (phasing out to $0 by $150k); unused losses carry forward. On sale, claimed depreciation is recaptured at up to 25%, and gains may owe capital-gains tax (a 1031 exchange can defer both). Figures are a year-1 estimate at your 24.0% rate — not tax advice; consult a CPA.
Schools (NCES district)
- District
- Prince George'S County Public Schools
- NCES district ID
- 2400510
- Math proficiency
- 8% ▼ -11.00%
- Reading proficiency
- 24% ▼ -9.00%
- Median HH income
- $73,967
- Composite
- 16.82/100
- National rank
- #9151
- State rank
- #21 of 24 in MD
Livability — Marlboro Meadows
- Score
- 62/100
- State rank
- #327
- US rank
- #17129
Category grades
Schools grade is shown separately in the Schools card above.
Census & demographics
- Census place
- Marlboro Meadows, MD
- County
- Prince Georges County · 919,866 people
- Metro
- Washington-Arlington-Alexandria, DC-VA-MD-WV
- Population (ZIP)
- 54,319
- Household income
- $139,403
- Rent vs Own
- Severe rent burden
- 524.0
Population outlook (Prince George's County) Hauer SSP2
- Today (2025)
- 1,005,426 people
- By 2030
- 1,048,416 · +4.3%
- By 2040
- 1,123,425 · +11.7%
- By 2050
- 1,183,220 · +17.7%
- By 2075
- 1,306,202 · +29.9%
- By 2100
- 1,408,179 · +40.1%
Race, ethnicity, and origin ACS 2023
- Neighborhood character
- Predominantly Black (78%)
- Race & ethnicity
- Black 78% White 10% Hispanic / Latino 7% Two or more races 5% Asian 1%
- Hispanic origin (detail)
- Mexican 1%
- Foreign-born
- 10% · Canada, China
- Languages at home
- 88% English-only · Spanish 5% French/Haitian/Cajun 1% Other Indo-European 1%
Political lean MEDSL · Prince George's
- 2024 margin
- Solid D (+75.2) · D 86.3% · R 11.2% · Other 2.5%
- 2008→2024 swing
- -3.3pp toward R · 2008: 78.5pp · 2024: 75.2pp
- All cycles
- 2024: D+75.2 2020: D+80.5 2016: D+81.0 2012: D+80.9 2008: D+78.5
Not yet ingested
- Civics
- —
Market trends
- HPI YoY
- ▼ -184.63%
- Current HPI
- 251.8236
- Rent YoY
- ▲ 9.80%
- Metro
- Washington-Arlington-Alexandria, DC-VA-MD-WV
- State GDP YoY
- ▲ 2.97%
- F500 in state
- 12
Industry mix (Fortune 500 HQ in MD)
| Industry | F500 HQs | Revenue |
|---|---|---|
| Aerospace / Defense | 1 | $71B |
|
||
| Utilities | 1 | $25B |
|
||
| Hotels | 1 | $24B |
|
||
| Consumer Goods | 1 | $7B |
|
||
| Real Estate | 1 | $6B |
|
||
| Chemicals | 1 | $2B |
|
||
Price history
+1059.7% since first listed3 events — show timeline
- 2026-06-08 Listed $365,000 BRIGHT MLS
- 1975-06-13 Sold (Public Records) $49,000 Public Records
- 1971-09-21 Sold (Public Records) $31,475 Public Records
Property tax history
+7.3%/yrLatest (2025): $5,451 · +5.4% YoY. Source: county tax records.
Cash-flow waterfall
monthlySold comps — $/sqft
last 12 mo · ≤1 miLoading sold comps…