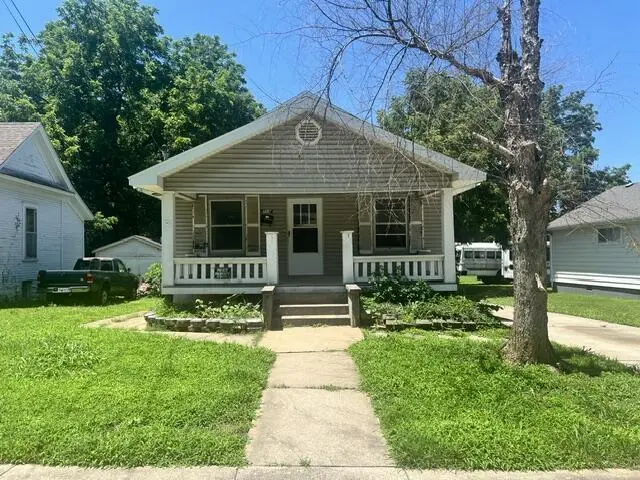
719 S Newton Ave · Springfield, MO
Flood risk 6/10 · Moderate
- FEMA flood zone
- X (unshaded)
- Chance of flooding over 30 yrs
- 0.71%
- Est. flood insurance / yr
- $473 – $860
Fire risk 1/10 · Minimal
- Est. fire insurance / yr
- $1,054 – $1,958
Heat risk 5/10 · Moderate
- Hot days now (above 104°F)
- 7 days/yr
- Hot days in 30 yrs
- 18 days/yr
Wind risk 2/10 · Minimal
- Chance of severe wind over 30 yrs
- —
Air-quality risk 2/10 · Minimal
- Unhealthy air days now
- 1 days/yr
- Unhealthy air days in 30 yrs
- 2 days/yr
Risk factors via First Street. Map © Google.
Why this score? — see what drove the B grade
The composite is a weighted blend of 9 inputs, each scored 0–100. Each bar is that input's sub-score; the figure is the points it added to the 100-point composite (weight × sub-score).
- Cash flow +28.8/30.0
- ARV discount +15.0/15.0
- DSCR +10.0/10.0
- 1% rule +7.2/10.0
- Livability +3.8/5.0
- Rent growth +3.5/5.0
- Schools +3.2/10.0
- Condition / age +2.5/5.0
- Appreciation +0.0/10.0
$79,000
🖨 Deal sheet 📄 Offer letter ✓ Due diligence
Listing remarks
2-bedroom, 1-bath home featuring an additional bathroom in the unfinished basement. Detached garage, newer roof and siding. Great opportunity for investors or buyers looking to build equity. Plenty of potential with room for storage or future expansion in the basement.
Key facts
- Room for storage
- Newer roof
- Unfinished basement
Tags
Property features AI
Exterior
- Parking: Garage with 1 parking space; Parking pad and driveway; Garage faces front
- Utilities: Public water; Public sewer; Cable available
- Home design: Single-family residential property; Has a view
- Construction: Composition roof; Basement: concrete, full, unfinished with walk-up access
- Exterior features: Covered front porch; Deck; Workshop (separate structure); City street frontage; Asphalt road access; Publicly maintained road
Interior
- Flooring: Hardwood flooring; Vinyl flooring
- Bathrooms: 1 full bathroom
- Heating & cooling: Natural gas heating with forced air; Ceiling fans for cooling
- Interior features: Shutters on windows; Storm windows; Rain gutters
- Laundry & utility: Laundry located in basement
Neighborhood map
What this means for you Summary
Snapshot
- This is a 2-bed/1.0-bath single-family listed at $79k.
Deal economics
- At list price, monthly cash flow is $266 ($3k/yr) — positive.
- The deal already cash-flows at list — no discount required.
- Meets the 1% rule at list price ($963 rent vs $79k).
- Cap rate 10.3% vs local median 4.6% in Springfield — top-decile yield for the area; either an underpriced asset or a hidden risk that comps aren't pricing in. Stress-test before assuming the spread holds.
Location & tenants
- Location reads 75/100 on livability (#57 in MO, #4,121 nationally) — a middle-class / working-renter tenant base. Strengths: commute A+, cost of living A+, housing A+; Watch: crime F, employment F.
- Springfield R-XII (urban): math 32% / reading 46% proficiency, ranked #174 of 324 in MO (top 54%) — families likely to look elsewhere, expect single-tenant / working-renter base with shorter leases.
- Zoned schools: Mcgregor Elem. (math 12% / reading 17%, grade F, #993 of 1,115 statewide, top 90%, 271 students, 90% FRL); Parkview High (math 11% / reading 40%, grade F, #433 of 521 statewide, top 83%, 1,234 students, 62% FRL) — zoned schools average 76% FRL vs 46% district-wide (30 pts higher); higher-poverty schools than district average — tighter screening recommended.
- Zoned-school proficiency averages 20% at this address vs 39% district-wide (-19 pts) — the specific schools serving this property underperform the Springfield R-XII average; the district grade overstates school quality for this exact location.
- Market conditions: Rents rising fast (+4.2%/yr); 86 active listings in the ZIP; 25 comparable units currently listed for rent nearby; rentals at typical pace (median 24d on market — plan ~3-4 weeks tenant-placement turnaround); lower-income renter base — watch delinquency; 1,302 units permitted in Greene County in 2024 (250 in 5+ unit buildings).
- This rent runs 41% of the median local income ($28k/yr) — at the standard rent-burdened threshold; future hikes will face affordability resistance.
Forward outlook
- Local home prices are declining (-3.0%/yr); year-one equity from $546 of loan paydown is wiped out by about $2k of value loss. Plan a longer hold.
- Greene County population projected at +25% by 2050 — long-run rental-demand tailwind backs the buy-and-hold thesis.
- At projected returns (-3.0% appreciation + 4.2% rent growth), your $22k cash investment doubles in ~8 years — after that, you're playing with house money.
Negotiation context
- Only 4 days on market — expect competitive offers; lowballing is unlikely to land.
Risks & watch-outs
- Watch-outs: built in 1932 — expect roof / HVAC / electrical / plumbing capex.
- Climate carrying-cost: major flood risk; extreme-heat days projected 7→18/yr by 2055 (HVAC capex compounding) — expect insurance premiums to compound above CPI over the hold.
Questions for the listing agent
- Built in 1932 — when were the roof, HVAC, electrical panel, plumbing, and water heater last replaced?
- Is there a deadline driving the sale (1031 exchange, divorce, estate, relocation)? That informs how much negotiation room exists.
- Crime grade is F in this area — have there been break-ins, vandalism, or insurance claims at this property in the last 3 years? What carrier currently insures it and at what premium?
- What's the average days-on-market for RENTAL listings here right now (not sales)? A rising rental-DOM trend means longer vacancies and softer asking-rent achievability than the comps imply.
- What's the recent tenant-quality profile in this submarket — average credit score on applications, eviction rate, late-payment / NSF rate, and stable-employment percentage? A property-management company in the area should have these aggregated.
- How much new for-sale + rental construction is in the pipeline within 1–3 miles? Heavy new supply typically softens prices + rents 12–24 months out; constrained supply supports both.
Investment metrics
- 1% rule
- 1.22% ✓
- Cap rate
- 10.33%
- Cash-on-cash
- 14.42%
- DSCR
- 1.64
- GRM
- 6.8
CMA / ARV
- ARV (on-the-fly)
- $108,720
- Comps found
- 12
Show comp detail 12 sales within ~0.75 mi
| Address | Dist | Beds/Ba | Sqft | Sold | Price | $/sf | Match |
|---|---|---|---|---|---|---|---|
| 1310 W State St | 0.07mi | 2/1.0 | 728 (+1%) | 3mo | $114,900 | $158 | 92 |
| 1055 S New Ave | 0.50mi | 2/1.0 | 724 (+1%) | 5mo | $149,900 | $207 | 72 |
| 1012 S Fort Ave | 0.38mi | 2/1.0 | 768 (+7%) | 1mo | $105,000 | $137 | 70 |
| 657 S Newton Ave | 0.05mi | 2/1.0 | 624 (-13%) | 6mo | $109,900 | $176 | 70 |
| 611 S Nettleton Ave | 0.16mi | 2/1.0 | 620 (-14%) | 3mo | $102,900 | $166 | 67 |
| 1121 S Fort Ave | 0.55mi | 2/1.0 | 741 (+3%) | 4mo | $67,000 | $90 | 66 |
| 906 S Kansas Ave | 0.27mi | 2/1.0 | 660 (-8%) | 10mo | $69,900 | $106 | 66 |
| 942 S Nettleton Ave | 0.30mi | 2/2.0 | 816 (+13%) | 0mo | $122,900 | $151 | 59 |
| 1241 S Ferguson Ave | 0.68mi | 2/1.0 | 672 (-7%) | 1mo | $70,000 | $104 | 57 |
| 818 W College St | 0.64mi | 1/1.0 (-1) | 700 (-3%) | 10mo | $50,000 | $71 | 52 |
| 1068 S Broadway Ave | 0.59mi | 2/1.0 | 821 (+14%) | 7mo | $139,900 | $170 | 43 |
| 1226 S Ferguson Ave | 0.66mi | 2/1.0 | 803 (+12%) | 11mo | $109,900 | $137 | 41 |
Match score weights: distance 35% · size 25% · config 20% · recency 20%. Top-matched comps best support the ARV.
Projected returns pro-forma
-3.0% appreciation · 4.17% rent growth · sell at horizon
- IRR
- 6.0%
- Equity multiple
- 1.24×
- Total profit
- $5,263
- Equity at exit
- $11,779
- IRR
- 16.4%
- Equity multiple
- 2.41×
- Total profit
- $31,139
- Equity at exit
- $6,830
Cash invested: $22,120 (down + closing). Projections, not guarantees.
Landlord ↔ Tenant lean methodology
- Overall (STATE)
- 81 Strongly Landlord-Friendly
- State Missouri
- 81 Strongly Landlord-Friendly · R+10
- County
- — inherits STATE
- City
- — inherits STATE
ZIP-level market 65806
- Home prices YoY
- -11.7%
- Rents YoY
- 4.2%
- Active inventory
- 86
- Price-to-rent
- 6.8×
Monthly cashflow live
- Estimated rent
- $963 high interval (Pro) →
- Mortgage (P&I)
- −$414
- Tax from tax record
- −$47 /mo · $570/yr
- Insurance
- −$33
- HOA
- −$0
- Vacancy / Maint / Mgmt
- −$202
- Net cashflow
- $266
Break-even live
UW: 25.0% down · 7.5% · 30yr · 1.5% tax · 5.0% vac · 8.0% maint · 8.0% mgmt
Financing live
Cash to close
- Down payment
- $19,750
- Closing costs
- $2,370
- Reserves months
- —
- Total cash needed
- —
Loan-product check · same deal, 3 products live
Conventional
25% down · 7.5% · 30yr
- Down + closing
- —
- Monthly P&I
- —
- Monthly cashflow
- —
- DSCR
- —
- Eligible?
- —
Personal DTI + credit; lowest rate.
DSCR
20% down · 8.5% · 30yr
- Down + closing
- —
- Monthly P&I
- —
- Monthly cashflow
- —
- DSCR
- —
- Eligible?
- —
No personal income docs; deal must DSCR.
Hard money
10% down · 12.0% · 12mo
- Down + closing
- —
- Monthly P&I
- —
- Monthly cashflow
- —
- DSCR
- —
- Eligible?
- —
Short-term bridge; refi at stabilization.
Rent comps 25 comps
| Address | Beds | Baths | Sqft | Rent | $/sqft | DOM | Units | Dist |
|---|---|---|---|---|---|---|---|---|
| 1911 W Elm St Springfield, MO | 2.0 | 1.0 | 580 | $875 | $1.51 | 43d | 1 | 0.52mi |
| 1740 W Olive St Springfield, MO | 3.0 | 1.0 | 736 | $1,195 | $1.62 | 13d | 1 | 0.60mi |
| 733 W College St Springfield, MO | 1.0 | 1.0 | 700 | $750 | $1.07 | 13d | 1 | 0.72mi |
| 810 W Catalpa St Apt 316 Springfield, MO | 1.0 | 1.0 | 581 | $551 | $0.95 | 23d | 1 | 0.72mi |
| 301 W State St Unit D Springfield, MO | 1.0 | 1.0 | 570 | $875 | $1.54 | 23d | 1 | 0.92mi |
| 305 S Campbell Ave Unit 208 Springfield, MO | 1.0 | 1.0 | 649 | $975 | $1.50 | 13d | 1 | 0.95mi |
| 235 N Market Ave Springfield, MO | 1.0–4.0 | 1.0–2.0 | 1350 | $1,267 | $0.94 | 23d | 5 | 0.95mi |
| 235 N Market Ave Springfield, MO | 1.0–4.0 | 1.0–2.0 | 1350 | $1,267 | $0.94 | 13d | 4 | 0.95mi |
| 755 South Ave Unit 2 Springfield, MO | 1.0 | 1.0 | 600 | $850 | $1.42 | 23d | 1 | 0.95mi |
| 901 South Ave Springfield, MO | 2.0–3.0 | 1.0–2.0 | 695 | $825 | $1.19 | 43d | 1 | 0.97mi |
| 806 South Ave Springfield, MO | 1.0 | 1.0 | 670 | $1,085 | $1.62 | 13d | 3 | 0.99mi |
| 522 N Park Ave Springfield, MO | 1.0 | 1.0 | 608 | $950 | $1.56 | 43d | 1 | 1.02mi |
| 209 W McDaniel St Unit 209-207 Springfield, MO | 1.0 | 1.0 | 700 | $950 | $1.36 | 43d | 1 | 1.05mi |
| 138 Park Central Sq Springfield, MO | 1.0–2.0 | 1.0–2.0 | 1083 | $2,489 | $2.30 | 13d | 8 | 1.07mi |
| 745 S Jefferson Ave Unit 6 Springfield, MO | 1.0 | 1.0 | 500 | $850 | $1.70 | 43d | 1 | 1.09mi |
| 745 S Jefferson Ave Unit 1 Springfield, MO | 1.0 | 1.0 | 410 | $795 | $1.94 | 23d | 1 | 1.09mi |
| 813 W Poplar St Unit 813 Springfield, MO | 2.0 | 1.0 | 560 | $795 | $1.42 | 13d | 1 | 1.09mi |
| 916 N Kansas Expy Springfield, MO | 1.0 | 1.0 | 573 | $595 | $1.04 | 43d | 1 | 1.13mi |
| 520 S Scenic Ave Unit 101-A Springfield, MO | 1.0 | 1.0 | 550 | $650 | $1.18 | 43d | 1 | 1.16mi |
| 511 E Cherry St Unit 2 Springfield, MO | 1.0 | 1.0 | 700 | $850 | $1.21 | 43d | 1 | 1.23mi |
| 511 E Cherry St Unit 8 Springfield, MO | 1.0 | 1.0 | 500 | $775 | $1.55 | 13d | 1 | 1.23mi |
| 1634 S Marion Ave Springfield, MO | 3.0 | 1.0–2.0 | 845 | $1,404 | $1.66 | 13d | 23 | 1.26mi |
| 2711 W Olive St Springfield, MO | 1.0 | 1.0 | 621 | $750 | $1.21 | 23d | 1 | 1.29mi |
| 1126 W Hamilton St Springfield, MO | 2.0 | 1.0 | 648 | $895 | $1.38 | 23d | 1 | 1.45mi |
| 1017 W Washita St Unit 2 Springfield, MO | 1.0 | 1.0 | 585 | $825 | $1.41 | 13d | 1 | 1.45mi |
Listing history 3 events
-
2026-06-14statusdays on market $79,000 Pending 4 DOM
-
2026-06-10remarks 269-char remark
-
2026-06-10$79,000 Active 1 DOM
ⓘ Source: listings_history table (triggers on properties + properties_extension) + one-shot
backfill from property_details.listing_events for pre-trigger history.
Tax reassessment forecast MO · Resets to sale price
- Current annual tax
- $570 · $47/mo
- Projected year-2 tax
- $766 · $64/mo
- Expected delta
- +$196/yr (+$16/mo · 34.5%)
ⓘ Screening estimate from a state-policy table — verify with the county assessor before closing.
Climate risk First Street
- Flood 6/10 Major FEMA zone X (unshaded) · 71% chance over 30 yrs
- Wildfire 1/10 Low
- Heat 5/10 Major 7 d/yr ≥104°F today · 18 d/yr by 30 yrs out
- Wind 2/10 Low
- Air quality 2/10 Low 1 unhealthy d/yr today · 2 by 30 yrs out
Nearby sold comps map
Loading sold comps map…
Walkable amenities ~0.75 mi
Loading nearby amenities…
Taxation est. · year 1
- Rental income
- $11,553
- − Mortgage interest
- −$4,425
- − Property taxes
- −$570
- − Insurance
- −$395
- − Repairs & maintenance
- −$924
- − Management
- −$924
- − Depreciation
- −$2,298
- Taxable income
- $2,016
- Est. tax owed @ 24.0%
- −$484
- After-tax cash flow
- $2,707/yr
For passive investors: Depreciation is non-cash, so a rental often shows a tax loss while cash-flowing — sheltering income. Rental losses are passive: they offset passive income freely, and up to $25,000/yr can offset ordinary (W-2) income if you actively participate and your MAGI is under $100k (phasing out to $0 by $150k); unused losses carry forward. On sale, claimed depreciation is recaptured at up to 25%, and gains may owe capital-gains tax (a 1031 exchange can defer both). Figures are a year-1 estimate at your 24.0% rate — not tax advice; consult a CPA.
Schools (NCES district)
- District
- Springfield R-XII
- NCES district ID
- 2928860
- Math proficiency
- 32% ▼ -2.00%
- Reading proficiency
- 46% ▼ -3.00%
- Median HH income
- $37,886
- Composite
- 32.45/100
- National rank
- #5717
- State rank
- #174 of 324 in MO
Livability — Springfield
- Score
- 75/100
- State rank
- #57
- US rank
- #4121
Category grades
Schools grade is shown separately in the Schools card above.
Census & demographics
- Census place
- Springfield, MO
- County
- Greene County · 244,327 people
- City population
- 223,044
- Metro
- Springfield, MO
- Population (ZIP)
- 13,692
- Household income
- $28,165
- Rent vs Own
- Severe rent burden
- 1966.0
Population outlook (Greene County) Hauer SSP2
- Today (2025)
- 319,054 people
- By 2030
- 335,135 · +5.0%
- By 2040
- 366,186 · +14.8%
- By 2050
- 397,431 · +24.6%
- By 2075
- 477,035 · +49.5%
- By 2100
- 520,828 · +63.2%
Race, ethnicity, and origin ACS 2023
- Neighborhood character
- Predominantly White (75%)
- Race & ethnicity
- White 75% Two or more races 8% Hispanic / Latino 7% Black 6% Asian 3%
- Hispanic origin (detail)
- Mexican 4%
- Common ancestry
- Slovak 2% Italian 1% Scotch-Irish 1%
- Foreign-born
- 7% · Canada, China, Vietnam
- Languages at home
- 91% English-only · Spanish 4% Other Indo-European 2% Other Asian/Pacific 1%
Political lean MEDSL · Greene
- 2024 margin
- Strong R (+20.8) · D 38.9% · R 59.7% · Other 1.4%
- 2008→2024 swing
- -5.0pp toward R · 2008: -15.8pp · 2024: -20.8pp
- All cycles
- 2024: R+20.8 2020: R+20.1 2016: R+27.4 2012: R+24.4 2008: R+15.8
Not yet ingested
- Civics
- —
Market trends
- HPI YoY
- ▼ -27.72%
- Current HPI
- 208.8156
- Rent YoY
- ▲ 4.17%
- Metro
- Springfield, MO
- State GDP YoY
- ▲ 1.84%
- F500 in state
- 20
Industry mix (Fortune 500 HQ in MO)
| Industry | F500 HQs | Revenue |
|---|---|---|
| Healthcare | 1 | $163B |
|
||
| Insurance | 1 | $21B |
|
||
| Industrial Technology | 1 | $17B |
|
||
| Retail | 1 | $16B |
|
||
| Industrial Distribution | 1 | $10B |
|
||
| Utilities | 1 | $9B |
|
||
Price history
4 events — show timeline
- 2026-06-09 Listed $79,000 SOMO
- 2026-05-05 Sold (Public Records) — Public Records
- 2006-07-26 Sold (Public Records) — Public Records
- 2003-02-25 Sold (Public Records) — Public Records
Property tax history
+1.9%/yrLatest (2025): $570 · +19.9% YoY. Source: county tax records.
Cash-flow waterfall
monthlySold comps — $/sqft
last 12 mo · ≤1 miLoading sold comps…