 Multi-family
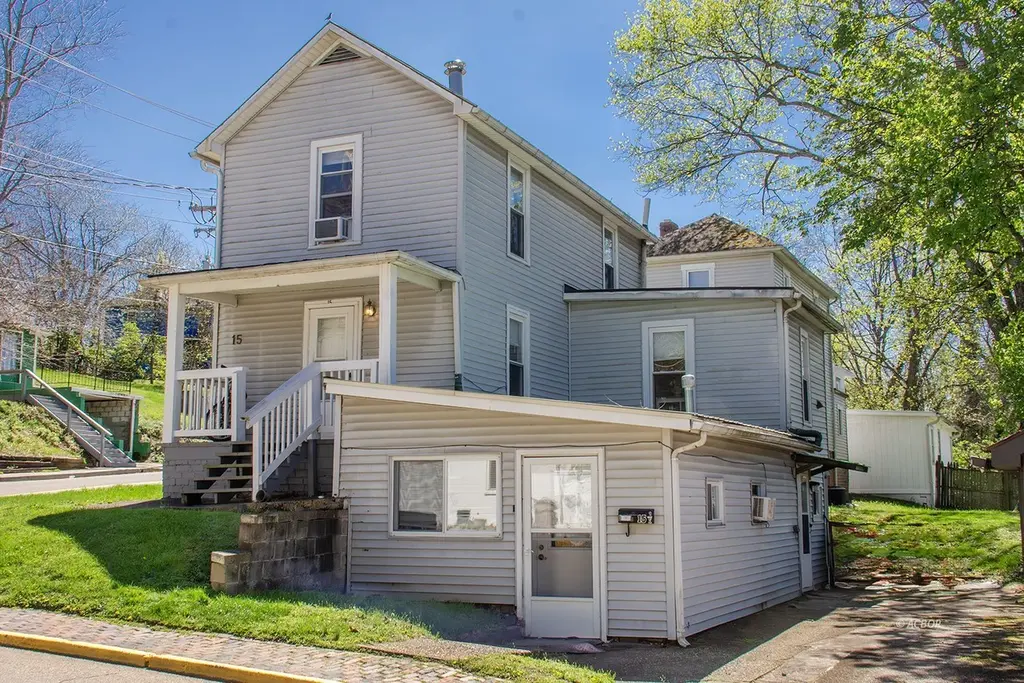
15/151/2 Clark St · Athens, OH
Flood risk 1/10 · Minimal
- FEMA flood zone
- X (unshaded)
- Chance of flooding over 30 yrs
- 0.0%
- Est. flood insurance / yr
- $473 – $860
Fire risk 1/10 · Minimal
- Est. fire insurance / yr
- $713 – $1,323
Heat risk 4/10 · Minor
- Hot days now (above 100°F)
- 7 days/yr
- Hot days in 30 yrs
- 18 days/yr
Wind risk 2/10 · Minimal
- Chance of severe wind over 30 yrs
- 1.0%
Air-quality risk 2/10 · Minimal
- Unhealthy air days now
- 0 days/yr
- Unhealthy air days in 30 yrs
- 1 days/yr
Risk factors via First Street. Map © Google.
Why this score? — see what drove the C- grade
The composite is a weighted blend of 9 inputs, each scored 0–100. Each bar is that input's sub-score; the figure is the points it added to the 100-point composite (weight × sub-score).
- Cash flow +20.6/30.0
- DSCR +6.5/10.0
- 1% rule +5.3/10.0
- Schools +4.5/10.0
- Livability +4.3/5.0
- ARV discount +4.1/15.0
- Rent growth +2.5/5.0
- Condition / age +2.5/5.0
- Appreciation +0.0/10.0
$190,000
🖨 Deal sheet 📄 Offer letter ✓ Due diligence
Multi-family units
County records classify this as Multi-Family (2-4 Unit). Listing-text estimate: 1 unit. estimate disagrees with records
Listing remarks
DUPLEX - They are hard to find!! 2 separate rental units in one building - one 2-bedroom 1 bath house plus a 1 bedroom 1 bath separate apartment. $ 22,200. rental income, parking, fully rented for the school year (May 2 2026 - May 3, 2027) ALL separate utilities paid by tenants. Nice location close to Cider House, Miller Chicken, on city bus route. 2 rentals units only $ 190,000.00. Soo many possibilities; rent both - rent one unit live in the other unit. Leave them both empty (BUT WHY)
Key facts
- City bus route
- Fully rented
- Rental income
Tags
Property features AI
Exterior
- Utilities: Natural gas available
- Home design: Single-family residence; 2 stories; Residential property
- Construction: Aluminum siding; Vinyl siding; Asphalt roof
- Exterior features: Covered porch/patio
Interior
- Kitchen: Refrigerator
- Flooring: Carpet; Concrete
- Bathrooms: 3 full bathrooms
- Heating & cooling: Central air conditioning
- Interior features: Wood-burning fireplace; 11 total rooms
- Laundry & utility: Washer; Dryer
Neighborhood map
What this means for you Summary
Snapshot
- This is a 3-bed/2.0-bath multifamily listed at $190k.
Deal economics
- At list price, monthly cash flow is $253 ($3k/yr) — positive.
- The deal already cash-flows at list — no discount required.
- Meets the 1% rule at list price ($2k rent vs $190k).
- Recommended offer: $184k (3.0% below list) — sets the bar for market timing.
- Cap rate 7.9% vs local median 2.8% in Athens — top-decile yield for the area; either an underpriced asset or a hidden risk that comps aren't pricing in. Stress-test before assuming the spread holds.
Location & tenants
- Location reads 86/100 on livability (#37 in OH, #350 nationally) — a professional / high-income tenant draw. Strengths: crime A+, amenities A+, commute A+; Watch: housing C-, employment F.
- Athens City (town): math 50% / reading 61% proficiency, ranked #393 of 656 in OH (top 60%) — acceptable for families but not a draw, mixed tenant base, ~2y average lease.
- Market conditions: 112 active listings in the ZIP; 2 comparable units currently listed for rent nearby; 5 units permitted in Athens County in 2024 (0 in 5+ unit buildings).
- This rent runs 44% of the median local income ($53k/yr) — at the standard rent-burdened threshold; future hikes will face affordability resistance.
Forward outlook
- Local home prices are declining (-3.0%/yr); year-one equity from $1k of loan paydown is wiped out by about $6k of value loss. Plan a longer hold.
- Athens County population projected at +4% by 2050 — modest demand growth; plan on rents tracking national, not racing it.
Negotiation context
- It's been on market 56 days — a 3% lower offer ($184k) is reasonable based on typical stale-listing flexibility.
Risks & watch-outs
- Watch-outs: built in 1900 — expect roof / HVAC / electrical / plumbing capex.
Questions for the listing agent
- It's been on market 56 days. Have you received any prior offers? Is the seller open to a 3% concession, seller financing, or rate buy-down credit?
- Built in 1900 — when were the roof, HVAC, electrical panel, plumbing, and water heater last replaced?
- Is there a deadline driving the sale (1031 exchange, divorce, estate, relocation)? That informs how much negotiation room exists.
- Schools are A-rated — typically a magnet for longer-tenancy family renters. What's the average tenant stay here, and is there a school-zone premium baked into asking?
- What's the average days-on-market for RENTAL listings here right now (not sales)? A rising rental-DOM trend means longer vacancies and softer asking-rent achievability than the comps imply.
- What's the recent tenant-quality profile in this submarket — average credit score on applications, eviction rate, late-payment / NSF rate, and stable-employment percentage? A property-management company in the area should have these aggregated.
- How much new apartment / multifamily construction is in the pipeline within 1–3 miles? Heavy new supply (>2% of stock underway) typically softens rents 12–24 months out; light construction supports rent growth.
Investment metrics
- 1% rule
- 1.03% ✓
- Cap rate
- 7.89%
- Cash-on-cash
- 5.72%
- DSCR
- 1.25
- GRM
- 8.1
CMA / ARV
- ARV (on-the-fly)
- $176,696
- Comps found
- 1
Show comp detail 1 sale within ~0.75 mi
| Address | Dist | Beds/Ba | Sqft | Sold | Price | $/sf | Match |
|---|---|---|---|---|---|---|---|
| 2 & 2.5 Columbia Ave | 0.45mi | 4/— (+1) | 1,680 (-1%) | 8mo | $174,000 | $104 | 66 |
Match score weights: distance 35% · size 25% · config 20% · recency 20%. Top-matched comps best support the ARV.
Projected returns pro-forma
-3.0% appreciation · 3.0% rent growth · sell at horizon
- IRR
- -7.4%
- Equity multiple
- 0.73×
- Total profit
- $-14,628
- Equity at exit
- $28,330
- IRR
- 2.1%
- Equity multiple
- 1.15×
- Total profit
- $8,116
- Equity at exit
- $16,428
Cash invested: $53,200 (down + closing). Projections, not guarantees.
Landlord ↔ Tenant lean methodology
- Overall (STATE)
- 73 Landlord-Friendly
- State Ohio
- 73 Landlord-Friendly · R+6
- County
- — inherits STATE
- City
- — inherits STATE
ZIP-level market 45701
- Active inventory
- 112
- Price-to-rent
- 15.0×
Monthly cashflow live
- Estimated rent
- $1,955 medium interval (Pro) →
- Mortgage (P&I)
- −$996
- Tax from tax record
- −$215 /mo · $2,585/yr
- Insurance
- −$79
- HOA
- −$0
- Vacancy / Maint / Mgmt
- −$411
- Net cashflow
- $253
Break-even live
2-unit breakdown (identical units grouped — click to expand)
| Units | Beds | Baths | Est. rent |
|---|---|---|---|
| 1× unit | 2 | 1 | $1,053 |
| 1× unit | 1 | 1 | $901 |
| Total (2 units) | $1,955 | ||
UW: 25.0% down · 7.5% · 30yr · 1.5% tax · 5.0% vac · 8.0% maint · 8.0% mgmt
Financing live
Cash to close
- Down payment
- $47,500
- Closing costs
- $5,700
- Reserves months
- —
- Total cash needed
- —
Loan-product check · same deal, 3 products live
Conventional
25% down · 7.5% · 30yr
- Down + closing
- —
- Monthly P&I
- —
- Monthly cashflow
- —
- DSCR
- —
- Eligible?
- —
Personal DTI + credit; lowest rate.
DSCR
20% down · 8.5% · 30yr
- Down + closing
- —
- Monthly P&I
- —
- Monthly cashflow
- —
- DSCR
- —
- Eligible?
- —
No personal income docs; deal must DSCR.
Hard money
10% down · 12.0% · 12mo
- Down + closing
- —
- Monthly P&I
- —
- Monthly cashflow
- —
- DSCR
- —
- Eligible?
- —
Short-term bridge; refi at stabilization.
Rent comps 2 comps
| Address | Beds | Baths | Sqft | Rent | $/sqft | DOM | Units | Dist |
|---|---|---|---|---|---|---|---|---|
| 9327 Saint RTE Athens, OH | 1.0–3.0 | 1.0–2.0 | 901 | $915 | $1.01 | 43d | 7 | 1.14mi |
| 8462 Luhrig Rd Athens, OH | 3.0 | 2.0 | 1118 | $893 | $0.80 | 43d | 1 | 1.16mi |
Listing history 15 events
-
2026-06-19days on market $190,000 Active 56 DOM
-
2026-06-18days on market $190,000 Active 55 DOM
-
2026-06-17days on market $190,000 Active 54 DOM
-
2026-06-16days on market $190,000 Active 53 DOM
-
2026-06-15days on market $190,000 Active 52 DOM
-
2026-06-14days on market $190,000 Active 50 DOM
-
2026-06-12days on market $190,000 Active 49 DOM
-
2026-06-09days on market $190,000 Active 46 DOM
-
2026-06-08days on market $190,000 Active 45 DOM
-
2026-06-07days on market $190,000 Active 44 DOM
-
2026-06-02days on market $190,000 Active 39 DOM
-
2026-06-01days on market $190,000 Active 38 DOM
-
2026-05-31days on market $190,000 Active 37 DOM
-
2026-05-30days on market $190,000 Active 36 DOM
-
2026-04-24$190,000 Active
ⓘ Source: listings_history table (triggers on properties + properties_extension) + one-shot
backfill from property_details.listing_events for pre-trigger history.
Tax reassessment forecast OH · Partial reset (capped growth)
- Current annual tax
- $2,585 · $215/mo
- Projected year-2 tax
- $2,775 · $231/mo
- Expected delta
- +$189/yr (+$16/mo · 7.3%)
ⓘ Screening estimate from a state-policy table — verify with the county assessor before closing.
Climate risk First Street
- Flood 1/10 Low FEMA zone X (unshaded) · 0% chance over 30 yrs
- Wildfire 1/10 Low
- Heat 4/10 Moderate 7 d/yr ≥100°F today · 18 d/yr by 30 yrs out
- Wind 2/10 Low 100% chance of damaging wind over 30 yrs
- Air quality 2/10 Low 0 unhealthy d/yr today · 1 by 30 yrs out
Nearby sold comps map
Loading sold comps map…
Walkable amenities ~0.75 mi
Loading nearby amenities…
Taxation est. · year 1
- Rental income
- $23,460
- − Mortgage interest
- −$10,643
- − Property taxes
- −$2,585
- − Insurance
- −$950
- − Repairs & maintenance
- −$1,877
- − Management
- −$1,877
- − Depreciation
- −$5,527
- Taxable income
- $1
- Est. tax owed @ 24.0%
- −$0
- After-tax cash flow
- $3,042/yr
For passive investors: Depreciation is non-cash, so a rental often shows a tax loss while cash-flowing — sheltering income. Rental losses are passive: they offset passive income freely, and up to $25,000/yr can offset ordinary (W-2) income if you actively participate and your MAGI is under $100k (phasing out to $0 by $150k); unused losses carry forward. On sale, claimed depreciation is recaptured at up to 25%, and gains may owe capital-gains tax (a 1031 exchange can defer both). Figures are a year-1 estimate at your 24.0% rate — not tax advice; consult a CPA.
Schools (NCES district)
- District
- Athens City
- NCES district ID
- 3904352
- Math proficiency
- 50% ▼ -10.00%
- Reading proficiency
- 61% ▼ -5.00%
- Median HH income
- $30,360
- Composite
- 45.43/100
- National rank
- #2620
- State rank
- #393 of 656 in OH
Livability — Athens
- Score
- 86/100
- State rank
- #37
- US rank
- #350
Category grades
Schools grade is shown separately in the Schools card above.
Census & demographics
- Census place
- Athens, OH
- County
- Athens County · 33,329 people
- City population
- 33,329
- Metro
- Athens, OH
- Population (ZIP)
- 33,329
- Household income
- $53,075
- Rent vs Own
- Severe rent burden
- 2145.0
Population outlook (Athens County) Hauer SSP2
- Today (2025)
- 71,867 people
- By 2030
- 73,556 · +2.4%
- By 2040
- 74,528 · +3.7%
- By 2050
- 74,947 · +4.3%
- By 2075
- 77,996 · +8.5%
- By 2100
- 81,619 · +13.6%
Race, ethnicity, and origin ACS 2023
- Neighborhood character
- Predominantly White (84%)
- Race & ethnicity
- White 84% Two or more races 6% Asian 4% Black 3% Hispanic / Latino 3%
- Common ancestry
- Romanian 4% Slovak 3% Serbian 2%
- Foreign-born
- 6% · China, Canada, Vietnam
- Languages at home
- 91% English-only · Spanish 2% Arabic 1% Chinese 1%
Political lean MEDSL · Athens
- 2024 margin
- D (+10.8) · D 54.9% · R 44.2%
- 2008→2024 swing
- -24.5pp toward R · 2008: 35.3pp · 2024: 10.8pp
- All cycles
- 2024: D+10.8 2020: D+15.0 2016: D+16.9 2012: D+35.0 2008: D+35.3
Not yet ingested
- Civics
- —
Market trends
- HPI YoY
- ▼ -157.24%
- Current HPI
- 181.6919
- Rent YoY
- —
- Metro
- Athens, OH
- State GDP YoY
- ▲ 1.98%
- F500 in state
- 48
Industry mix (Fortune 500 HQ in OH)
| Industry | F500 HQs | Revenue |
|---|---|---|
| Insurance | 3 | $145B |
|
||
| Industrial Machinery | 3 | $49B |
|
||
| Financial Services | 3 | $24B |
|
||
| Consumer Goods | 2 | $93B |
|
||
| Aerospace / Defense | 2 | $47B |
|
||
| Utilities | 2 | $33B |
|
||
Price history
1 event — show timeline
- 2026-04-24 Listed $190,000 ACBOR
Property tax history
+4.3%/yrLatest (2025): $2,585 · +0.9% YoY. Source: county tax records.
Cash-flow waterfall
monthlySold comps — $/sqft
last 12 mo · ≤1 miLoading sold comps…