2292 Wheeler Rd · Concord, VA
Flood risk 1/10 · Minimal
- FEMA flood zone
- X (unshaded)
- Chance of flooding over 30 yrs
- 0.0%
- Est. flood insurance / yr
- $473 – $860
Fire risk 5/10 · Moderate
- Est. fire insurance / yr
- $666 – $1,236
Heat risk 5/10 · Moderate
- Hot days now (above 103°F)
- 7 days/yr
- Hot days in 30 yrs
- 18 days/yr
Wind risk 2/10 · Minimal
- Chance of severe wind over 30 yrs
- 3.0%
Air-quality risk 2/10 · Minimal
- Unhealthy air days now
- 1 days/yr
- Unhealthy air days in 30 yrs
- 1 days/yr
Risk factors via First Street. Map © Google.
Why this score? — see what drove the D- grade
The composite is a weighted blend of 9 inputs, each scored 0–100. Each bar is that input's sub-score; the figure is the points it added to the 100-point composite (weight × sub-score).
- ARV discount +12.9/15.0
- Appreciation +9.0/10.0
- Schools +5.2/10.0
- Livability +3.2/5.0
- Cash flow +2.6/30.0
- Rent growth +2.5/5.0
- Condition / age +2.5/5.0
- 1% rule +0.0/10.0
- DSCR +0.0/10.0
$364,900
🖨 Deal sheet 📄 Offer letter ✓ Due diligence
Listing remarks MLS
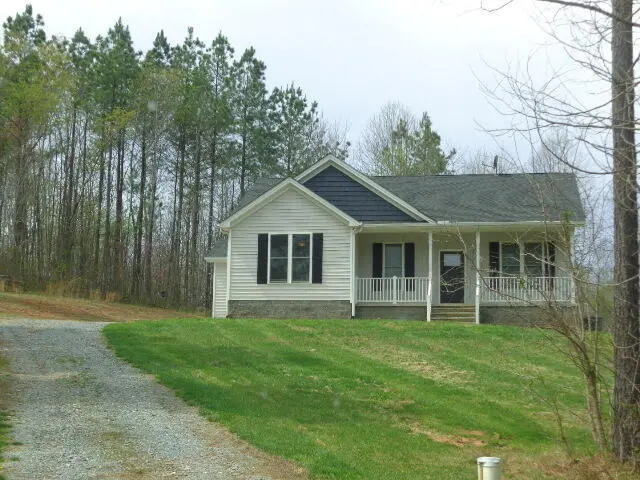
Nearly Five Private Acres with a Five Year Old Move-In Ready Home. Spacious Open Floor Plan. Living Room, Dining Room and Kitchen All in Open Great Room. Three Bedrooms and Two Full Baths. Located in Campbell County Less than a fifteen mi-nute drive to Lynchburg City.
Key facts
- Private acres
- Open floor plan
- Great room
Tags
Neighborhood map
What this means for you Summary
Snapshot
- This is a 3-bed/1.0-bath single-family listed at $365k.
Deal economics
- At list price, monthly cash flow is $-1k ($-15k/yr) — negative.
- To cash-flow at today's rent, offer at most $144k (60.6% below list).
- To meet the 1% rule (rent ≥ 1% of price), the offer needs to be $115k (68.4% below list).
- Recommended offer: $115k (68.4% below list) — sets the bar for 1% rule.
- Cap rate 2.2% vs local median 3.0% in Concord — below-typical yield; the buyer is paying a premium for something (appreciation thesis, condition, location) that the cap rate doesn't capture.
Location & tenants
- Location reads 65/100 on livability (#335 in VA) — a middle-class / working-renter tenant base. Strengths: crime A+, cost of living A+; Watch: employment C-, health & safety C-, amenities F.
- Campbell County Public School District (rural): math 55% / reading 68% proficiency, ranked #55 of 131 in VA (top 42%) — acceptable for families but not a draw, mixed tenant base, ~2y average lease.
- Market conditions: 6 active listings in the ZIP; 315 units permitted in Campbell County in 2024 (51 in 5+ unit buildings).
Forward outlook
- In year one you build about $32k of equity ($3k loan paydown + $29k appreciation (8.0% local appreciation)).
- Campbell County population projected to shrink 6% by 2050 — rents likely to lag national; underwrite the cash flow, not the appreciation.
- By year 2, paydown + projected appreciation supports a ~$51k cash-out refi (75% LTV) — recoverable capital for the next deal without selling this one.
Negotiation context
- It's been on market 71 days — a 6% lower offer ($343k) is reasonable based on typical stale-listing flexibility.
- 6 sale attempts since 5y ago; this cycle's ask has dropped $34k (9%) from the opening price — seller is motivated, your offer sets the floor, not the list.
Risks & watch-outs
- Climate carrying-cost: moderate wildfire risk; extreme-heat days projected 7→18/yr by 2055 (HVAC capex compounding) — expect insurance premiums to compound above CPI over the hold.
Questions for the listing agent
- What do current leases actually rent for vs. the listed asking? Can we see a recent rent roll and the last 12 months of T-12 income?
- It's been on market 71 days. Have you received any prior offers? Is the seller open to a 68% concession, seller financing, or rate buy-down credit?
- Why hasn't it sold? Are there any deal-killer items the seller is aware of (foundation, flood, title, zoning, code violations)?
- Is there a deadline driving the sale (1031 exchange, divorce, estate, relocation)? That informs how much negotiation room exists.
- Schools are B-rated — typically a magnet for longer-tenancy family renters. What's the average tenant stay here, and is there a school-zone premium baked into asking?
- The area grade is low — what's the realistic commute time and amenity access for the typical tenant pool here? Any planned neighborhood developments (good or bad) we should know about?
- What's the average days-on-market for RENTAL listings here right now (not sales)? A rising rental-DOM trend means longer vacancies and softer asking-rent achievability than the comps imply.
- What's the recent tenant-quality profile in this submarket — average credit score on applications, eviction rate, late-payment / NSF rate, and stable-employment percentage? A property-management company in the area should have these aggregated.
- How much new for-sale + rental construction is in the pipeline within 1–3 miles? Heavy new supply typically softens prices + rents 12–24 months out; constrained supply supports both.
Investment metrics
- 1% rule
- 0.32% ✗
- Cap rate
- 2.18%
- Cash-on-cash
- -14.70%
- DSCR
- 0.35
- GRM
- 26.4
CMA / ARV
- ARV (median comp)
- $415,004
- List price
- $364,900
- Delta
- -12.07%
- Verdict
- UNDERPRICED
- Comps
- 10 within 1.0 mi
Show comp detail 2 sales within ~0.75 mi
| Address | Dist | Beds/Ba | Sqft | Sold | Price | $/sf | Match |
|---|---|---|---|---|---|---|---|
| 2164 Wheeler Rd | 0.10mi | 3/2.0 | 1,642 (+8%) | 21mo | $424,000 | $258 | 60 |
| 1385 Wheeler Rd | 0.70mi | 3/2.0 | 1,448 (-5%) | 6mo | $390,000 | $269 | 50 |
Match score weights: distance 35% · size 25% · config 20% · recency 20%. Top-matched comps best support the ARV.
Projected returns pro-forma
7.96% appreciation · 3.0% rent growth · sell at horizon
- IRR
- 9.0%
- Equity multiple
- 1.68×
- Total profit
- $69,554
- Equity at exit
- $276,323
- IRR
- 10.3%
- Equity multiple
- 3.55×
- Total profit
- $260,573
- Equity at exit
- $547,641
Cash invested: $102,172 (down + closing). Projections, not guarantees.
Landlord ↔ Tenant lean methodology
- Overall (STATE)
- 55 Moderately Landlord-Leaning
- State Virginia
- 55 Moderately Landlord-Leaning · D+2
- County
- — inherits STATE
- City
- — inherits STATE
ZIP-level market 24150
- Home prices YoY
- 4.1%
- Active inventory
- 6
- Price-to-rent
- 26.4×
Monthly cashflow live
- Estimated rent
- $1,151 medium interval (Pro) →
- Mortgage (P&I)
- −$1,914
- Tax from tax record
- −$96 /mo · $1,147/yr
- Insurance
- −$152
- HOA
- −$0
- Vacancy / Maint / Mgmt
- −$242
- Net cashflow
- $-1,252
Break-even live
UW: 25.0% down · 7.5% · 30yr · 1.5% tax · 5.0% vac · 8.0% maint · 8.0% mgmt
Financing live
Cash to close
- Down payment
- $91,225
- Closing costs
- $10,947
- Reserves months
- —
- Total cash needed
- —
Loan-product check · same deal, 3 products live
Conventional
25% down · 7.5% · 30yr
- Down + closing
- —
- Monthly P&I
- —
- Monthly cashflow
- —
- DSCR
- —
- Eligible?
- —
Personal DTI + credit; lowest rate.
DSCR
20% down · 8.5% · 30yr
- Down + closing
- —
- Monthly P&I
- —
- Monthly cashflow
- —
- DSCR
- —
- Eligible?
- —
No personal income docs; deal must DSCR.
Hard money
10% down · 12.0% · 12mo
- Down + closing
- —
- Monthly P&I
- —
- Monthly cashflow
- —
- DSCR
- —
- Eligible?
- —
Short-term bridge; refi at stabilization.
Listing history 31 events
-
2026-06-19days on market $364,900 Active 71 DOM
-
2026-06-18days on market $364,900 Active 70 DOM
-
2026-06-17days on market $364,900 Active 69 DOM
-
2026-06-16days on market $364,900 Active 68 DOM
-
2026-06-15days on market $364,900 Active 67 DOM
-
2026-06-14days on market $364,900 Active 65 DOM
-
2026-06-13days on market $364,900 Active 64 DOM
-
2026-06-10days on market $364,900 Active 62 DOM
-
2026-06-09days on market $364,900 Active 61 DOM
-
2026-06-08days on market $364,900 Active 60 DOM
-
2026-06-07days on market $364,900 Active 59 DOM
-
2026-06-05days on market $364,900 Active 56 DOM
-
2026-06-02days on market $364,900 Active 54 DOM
-
2026-06-01days on market $364,900 Active 53 DOM
-
2026-05-31days on market $364,900 Active 52 DOM
-
2026-05-30days on market $364,900 Active 51 DOM
-
2026-04-09$399,000 Active 268-char remark
Show marketing remark (269 chars)
Campbell County Move-In Ready Home Only Five Years Old. Located on a Private Almost Five Acre Lot. Spacious Open Floor Plan. Living Room, Dining Room and Kitchen All in Open Great Room. Three Bedrooms and Two Full Baths. Less than fifteen minute drive to Lynchburg City
-
2026-04-09$399,900 Active 269-char remark
Show marketing remark (269 chars)
Campbell County Move-In Ready Home Only Five Years Old. Located on a Private Almost Five Acre Lot. Spacious Open Floor Plan. Living Room, Dining Room and Kitchen All in Open Great Room. Three Bedrooms and Two Full Baths. Less than fifteen minute drive to Lynchburg City
-
2025-12-02price $385,000
-
2025-08-29price $399,999
-
2025-08-15$410,000 Active
-
2023-06-16soldstatus $360,000
-
2023-06-15soldstatus $360,000 Closed
-
2023-05-06status Pending
-
2023-04-21$349,900 Active
-
2022-05-31soldstatus $339,000
-
2022-05-27soldstatus $339,000 Closed
-
2022-04-10historical
-
2022-03-29$344,900
-
2021-11-22soldstatus $300,000
-
2021-10-20$289,900
ⓘ Source: listings_history table (triggers on properties + properties_extension) + one-shot
backfill from property_details.listing_events for pre-trigger history.
Tax reassessment forecast VA · Resets to sale price
- Current annual tax
- $1,147 · $96/mo
- Projected year-2 tax
- $2,992 · $249/mo
- Expected delta
- +$1,846/yr (+$154/mo · 161.0%)
ⓘ Screening estimate from a state-policy table — verify with the county assessor before closing.
Climate risk First Street
- Flood 1/10 Low FEMA zone X (unshaded) · 0% chance over 30 yrs
- Wildfire 5/10 Major
- Heat 5/10 Major 7 d/yr ≥103°F today · 18 d/yr by 30 yrs out
- Wind 2/10 Low 3% chance of damaging wind over 30 yrs
- Air quality 2/10 Low 1 unhealthy d/yr today · 1 by 30 yrs out
Nearby sold comps map
Loading sold comps map…
Walkable amenities ~0.75 mi
Loading nearby amenities…
Taxation est. · year 1
- Rental income
- $13,817
- − Mortgage interest
- −$20,440
- − Property taxes
- −$1,147
- − Insurance
- −$1,824
- − Repairs & maintenance
- −$1,105
- − Management
- −$1,105
- − Depreciation
- −$10,615
- Taxable loss
- −$22,420
- Est. tax savings @ 24.0%
- +$5,381
- After-tax cash flow
- $-9,638/yr
For passive investors: Depreciation is non-cash, so a rental often shows a tax loss while cash-flowing — sheltering income. Rental losses are passive: they offset passive income freely, and up to $25,000/yr can offset ordinary (W-2) income if you actively participate and your MAGI is under $100k (phasing out to $0 by $150k); unused losses carry forward. On sale, claimed depreciation is recaptured at up to 25%, and gains may owe capital-gains tax (a 1031 exchange can defer both). Figures are a year-1 estimate at your 24.0% rate — not tax advice; consult a CPA.
Schools (NCES district)
- District
- Campbell County Public School District
- NCES district ID
- 5100600
- Math proficiency
- 55% ▼ -29.00%
- Reading proficiency
- 68% ▼ -11.00%
- Median HH income
- $45,915
- Composite
- 51.88/100
- National rank
- #1656
- State rank
- #55 of 131 in VA
Livability — Concord
- Score
- 65/100
- State rank
- #335
- US rank
- #12864
Category grades
Schools grade is shown separately in the Schools card above.
Census & demographics
- Population (ZIP)
- 823
Population outlook (Campbell County) Hauer SSP2
- Today (2025)
- 56,306 people
- By 2030
- 56,366 · +0.1%
- By 2040
- 55,406 · -1.6%
- By 2050
- 53,011 · -5.9%
- By 2075
- 45,932 · -18.4%
- By 2100
- 36,029 · -36.0%
Race, ethnicity, and origin ACS 2023
- Neighborhood character
- Predominantly White (97%)
- Race & ethnicity
- White 97% Hispanic / Latino 3%
- Common ancestry
- Lithuanian 8% Romanian 2%
Political lean MEDSL · Campbell
- 2024 margin
- Solid R (+48.6) · D 25.3% · R 73.9%
- 2008→2024 swing
- -12.3pp toward R · 2008: -36.2pp · 2024: -48.6pp
- All cycles
- 2024: R+48.6 2020: R+44.1 2016: R+47.2 2012: R+39.4 2008: R+36.2
Not yet ingested
- Civics
- —
Market trends
- HPI YoY
- ▲ 7.96%
- Current HPI
- 203.632
- Rent YoY
- —
- Metro
- —
- State GDP YoY
- ▲ 2.40%
- F500 in state
- 50
Industry mix (Fortune 500 HQ in VA)
| Industry | F500 HQs | Revenue |
|---|---|---|
| Aerospace / Defense | 4 | $236B |
|
||
| Technology / Defense | 3 | $32B |
|
||
| Financial Services | 2 | $176B |
|
||
| Utilities | 2 | $27B |
|
||
| Insurance | 2 | $25B |
|
||
| Technology | 2 | $15B |
|
||
Price history
+37.6% since first listed15 events — show timeline
- 2026-04-09 Listed $399,000 LMLS
- 2026-04-09 Listed $399,900 RHR
- 2025-12-02 Price Changed $385,000 LMLS
- 2025-08-29 Price Changed $399,999 LMLS
- 2025-08-15 Listed $410,000 LMLS
- 2023-06-16 Sold (Public Records) $360,000 Public Records
- 2023-06-15 Sold (MLS) $360,000 LMLS
- 2023-05-06 Pending — LMLS
- 2023-04-21 Listed $349,900 LMLS
- 2022-05-31 Sold (Public Records) $339,000 Public Records
- 2022-05-27 Sold (MLS) $339,000 LMLS
- 2022-04-10 Delisted — LMLS
- 2022-03-29 Listed $344,900 LMLS
- 2021-11-22 Sold (MLS) $300,000 LMLS
- 2021-10-20 Listed $289,900 LMLS
Property tax history
+112.5%/yrLatest (2025): $1,147 · +0.0% YoY. Source: county tax records.
Cash-flow waterfall
monthlySold comps — $/sqft
last 12 mo · ≤1 miLoading sold comps…