 🏗️ New Construction
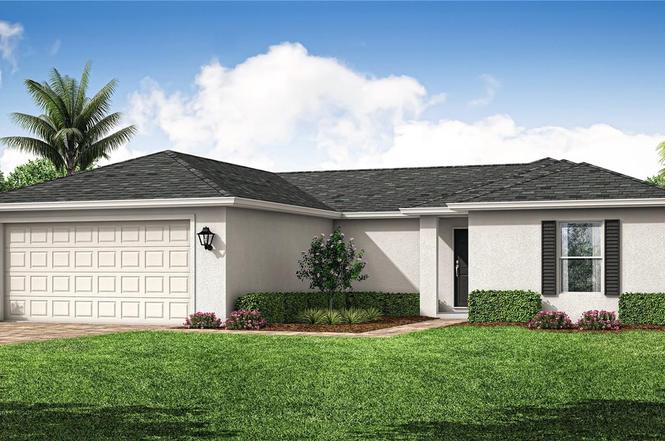
23201 Glory Ave · Port Charlotte, FL
Flood risk 1/10 · Minimal
- FEMA flood zone
- X (unshaded)
- Chance of flooding over 30 yrs
- 0.0%
- Est. flood insurance / yr
- $507 – $1,088
Fire risk 1/10 · Minimal
- Est. fire insurance / yr
- $947 – $1,759
Heat risk 10/10 · Severe
- Hot days now (above 107°F)
- 7 days/yr
- Hot days in 30 yrs
- 28 days/yr
Wind risk 10/10 · Severe
- Chance of severe wind over 30 yrs
- 99.0%
Air-quality risk 3/10 · Minor
- Unhealthy air days now
- 2 days/yr
- Unhealthy air days in 30 yrs
- 2 days/yr
Risk factors via First Street. Map © Google.
Why this score? — see what drove the D grade
The composite is a weighted blend of 9 inputs, each scored 0–100. Each bar is that input's sub-score; the figure is the points it added to the 100-point composite (weight × sub-score).
- Cash flow +14.9/30.0
- ARV discount +7.5/15.0
- DSCR +4.6/10.0
- Schools +4.6/10.0
- Livability +3.2/5.0
- 1% rule +2.8/10.0
- Condition / age +2.5/5.0
- Rent growth +2.2/5.0
- Appreciation +0.0/10.0
$283,990
🖨 Deal sheet 📄 Offer letter ✓ Due diligence
Listing remarks
Under Construction. NEW BUILD - Anticipated completion date is April 24, 2026. WAS $294,990 - NOW $283,990. SPECIAL INCENTIVES: 4.75% fixed rate FHA/VA financing with $5K closing cost assistance OR 3.99% FHA/VA 5-YEAR ARM + UP to $10K in closing cost assistance/ prepaids OR UP to $20K toward closing cost when using a preferred lender. The 1,426 -square-foot (air-conditioned) Windsor plan boasts a well-designed open floor plan that includes four bedrooms, two bathrooms, and a two-car garage. The kitchen boasts upgraded 30” contemporary shaker-style cabinets, a spacious kitchen island with upgraded quartz countertops, Whirlpool dishwasher, microwave, and range, refrigerator, washer &a
Key facts
- Open floor plan
- Private bathroom
- Vaulted ceilings
Tags
Neighborhood map
What this means for you Summary
Snapshot
- This is a 4-bed/2.0-bath land listed at $284k.
Deal economics
- At list price, monthly cash flow is $85 ($1k/yr) — positive.
- The deal already cash-flows at list — no discount required.
- To meet the 1% rule (rent ≥ 1% of price), the offer needs to be $220k (22.4% below list).
- Recommended offer: $220k (22.4% below list) — sets the bar for 1% rule.
- Cap rate 6.7% vs local median 4.4% in Port Charlotte — top-decile yield for the area; either an underpriced asset or a hidden risk that comps aren't pricing in. Stress-test before assuming the spread holds.
Location & tenants
- Location reads 65/100 on livability (#655 in FL) — a middle-class / working-renter tenant base. Strengths: cost of living A+, housing A+; Watch: schools D+, employment D, amenities F.
- Charlotte (suburban): math 54% / reading 54% proficiency, ranked #22 of 73 in FL (top 30%) — acceptable for families but not a draw, mixed tenant base, ~2y average lease.
- Market conditions: Rents soft (-1.4%/yr); 707 active listings in the ZIP; 16 comparable units currently listed for rent nearby; rentals at typical pace (median 21d on market — plan ~3-4 weeks tenant-placement turnaround); 4,585 units permitted in Charlotte County in 2024 (703 in 5+ unit buildings).
- This rent runs 43% of the median local income ($61k/yr) — at the standard rent-burdened threshold; future hikes will face affordability resistance.
Forward outlook
- Local home prices are declining (-3.0%/yr); year-one equity from $2k of loan paydown is wiped out by about $9k of value loss. Plan a longer hold.
- Charlotte County population projected at +24% by 2050 — long-run rental-demand tailwind backs the buy-and-hold thesis.
Negotiation context
- It's been on market 46 days — a 3% lower offer ($275k) is reasonable based on typical stale-listing flexibility.
- Current owner paid $8k; list at $284k implies a 3241% gain — meaningful room to come down on a strong offer.
Risks & watch-outs
- Climate carrying-cost: severe wind risk, 99% chance of damaging wind over 30y; extreme-heat days projected 7→28/yr by 2055 (HVAC capex compounding) — expect insurance premiums to compound above CPI over the hold.
Questions for the listing agent
- It's been on market 46 days. Have you received any prior offers? Is the seller open to a 22% concession, seller financing, or rate buy-down credit?
- Is there a deadline driving the sale (1031 exchange, divorce, estate, relocation)? That informs how much negotiation room exists.
- Schools are D-rated, which usually means shorter tenancies and higher turnover. Who's the typical renter profile here, and what's been the actual vacancy rate?
- The area grade is low — what's the realistic commute time and amenity access for the typical tenant pool here? Any planned neighborhood developments (good or bad) we should know about?
- What's the average days-on-market for RENTAL listings here right now (not sales)? A rising rental-DOM trend means longer vacancies and softer asking-rent achievability than the comps imply.
- What's the recent tenant-quality profile in this submarket — average credit score on applications, eviction rate, late-payment / NSF rate, and stable-employment percentage? A property-management company in the area should have these aggregated.
- How much new for-sale + rental construction is in the pipeline within 1–3 miles? Heavy new supply typically softens prices + rents 12–24 months out; constrained supply supports both.
Investment metrics
- 1% rule
- 0.78% ✗
- Cap rate
- 6.65%
- Cash-on-cash
- 1.28%
- DSCR
- 1.06
- GRM
- 10.7
CMA / ARV
No comps found within radius.
Projected returns pro-forma
-3.0% appreciation · 0.0% rent growth · sell at horizon
- IRR
- -17.2%
- Equity multiple
- 0.41×
- Total profit
- $-47,232
- Equity at exit
- $42,344
- IRR
- -14.9%
- Equity multiple
- 0.25×
- Total profit
- $-59,764
- Equity at exit
- $24,554
Cash invested: $79,517 (down + closing). Projections, not guarantees.
Landlord ↔ Tenant lean methodology
- Overall (STATE)
- 87 Strongly Landlord-Friendly
- State Florida
- 87 Strongly Landlord-Friendly · R+3
- County
- — inherits STATE
- City
- — inherits STATE
ZIP-level market 33952
- Home prices YoY
- -4.8%
- Rents YoY
- -1.4%
- Active inventory
- 707
- Price-to-rent
- 10.7×
Monthly cashflow live
- Estimated rent
- $2,204 high interval (Pro) →
- Mortgage (P&I)
- −$1,489
- Tax from tax record
- −$48 /mo · $582/yr
- Insurance
- −$118
- HOA
- −$0
- Vacancy / Maint / Mgmt
- −$463
- Net cashflow
- $85
Break-even live
UW: 25.0% down · 7.5% · 30yr · 1.5% tax · 5.0% vac · 8.0% maint · 8.0% mgmt
Financing live
Cash to close
- Down payment
- $70,998
- Closing costs
- $8,520
- Reserves months
- —
- Total cash needed
- —
Loan-product check · same deal, 3 products live
Conventional
25% down · 7.5% · 30yr
- Down + closing
- —
- Monthly P&I
- —
- Monthly cashflow
- —
- DSCR
- —
- Eligible?
- —
Personal DTI + credit; lowest rate.
DSCR
20% down · 8.5% · 30yr
- Down + closing
- —
- Monthly P&I
- —
- Monthly cashflow
- —
- DSCR
- —
- Eligible?
- —
No personal income docs; deal must DSCR.
Hard money
10% down · 12.0% · 12mo
- Down + closing
- —
- Monthly P&I
- —
- Monthly cashflow
- —
- DSCR
- —
- Eligible?
- —
Short-term bridge; refi at stabilization.
Rent comps 16 comps
| Address | Beds | Baths | Sqft | Rent | $/sqft | DOM | Units | Dist |
|---|---|---|---|---|---|---|---|---|
| 1314 Beacon Dr Port Charlotte, FL | 3.0 | 2.0 | 1783 | $2,500 | $1.40 | 21d | 1 | 0.25mi |
| 1195 Desmond St Port Charlotte, FL | 3.0 | 2.0 | 1388 | $1,716 | $1.24 | 21d | 1 | 0.50mi |
| 1235 Desmond St Port Charlotte, FL | 4.0 | 2.0 | 1833 | $1,866 | $1.02 | 21d | 1 | 0.51mi |
| 1516 Abel St Port Charlotte, FL | 3.0 | 2.0 | 1874 | $2,200 | $1.17 | 21d | 1 | 0.67mi |
| 1200 Loveland Blvd Punta Gorda, FL | 1.0–3.0 | 1.0–2.0 | 1151 | $2,660 | $2.31 | 13d | 276 | 0.73mi |
| 24151 Beatrix Blvd Port Charlotte, FL | 3.0 | 1.0–2.0 | 990 | $2,272 | $2.29 | 13d | 28 | 0.96mi |
| 1365 Alton Rd Port Charlotte, FL | 3.0 | 2.0 | 1640 | $1,800 | $1.10 | 21d | 1 | 1.01mi |
| 22342 Priscilla Ave Port Charlotte, FL | 3.0 | 2.0 | 1500 | $2,000 | $1.33 | 21d | 1 | 1.01mi |
| 24001 Madaca Ln Port Charlotte, FL | 1.0–3.0 | 1.0–2.0 | 1179 | $1,944 | $1.65 | 13d | 26 | 1.13mi |
| 1138 Presque Isle Dr Port Charlotte, FL | 3.0 | 2.0 | 1739 | $1,891 | $1.09 | 13d | 1 | 1.20mi |
| 1057 Presque Isle Dr Port Charlotte, FL | 3.0 | 2.0 | 1673 | $2,950 | $1.76 | 21d | 1 | 1.26mi |
| 24150 Beatrix Blvd Port Charlotte, FL | 3.0 | 1.0–2.0 | 866 | $1,978 | $2.28 | 13d | 42 | 1.28mi |
| 82 Kenly St Port Charlotte, FL | 3.0 | 2.0 | 1838 | $2,290 | $1.25 | 13d | 1 | 1.30mi |
| 1299 Birchcrest Blvd Port Charlotte, FL | 3.0 | 2.0 | 1176 | $1,800 | $1.53 | 21d | 1 | 1.41mi |
| 22137 Midway Blvd Port Charlotte, FL | 4.0 | 1.0 | 1500 | $1,350 | $0.90 | 21d | 1 | 1.43mi |
| 1867 Nottingham Trl Punta Gorda, FL | 3.0 | 2.0 | 1646 | $2,000 | $1.22 | 21d | 1 | 1.48mi |
Listing history 9 events
-
2026-04-17status Pending
-
2026-04-15price $283,990
-
2026-04-08price $284,990
-
2026-04-01price $285,990
-
2026-03-02$294,990 Active
-
2015-10-08soldstatus $8,500
-
2015-06-05soldstatus $35,200
-
2005-07-25soldstatus $30,000
-
2004-02-18soldstatus $12,000
ⓘ Source: listings_history table (triggers on properties + properties_extension) + one-shot
backfill from property_details.listing_events for pre-trigger history.
Tax reassessment forecast FL · Resets to sale price
- Current annual tax
- $582 · $48/mo
- Projected year-2 tax
- $2,357 · $196/mo
- Expected delta
- +$1,775/yr (+$148/mo · 305.1%)
ⓘ Screening estimate from a state-policy table — verify with the county assessor before closing.
Climate risk First Street
- Flood 1/10 Low FEMA zone X (unshaded) · 0% chance over 30 yrs
- Wildfire 1/10 Low
- Heat 10/10 Extreme 7 d/yr ≥107°F today · 28 d/yr by 30 yrs out
- Wind 10/10 Extreme 99% chance of damaging wind over 30 yrs
- Air quality 3/10 Moderate 2 unhealthy d/yr today · 2 by 30 yrs out
Nearby sold comps map
Loading sold comps map…
Walkable amenities ~0.75 mi
Loading nearby amenities…
Taxation est. · year 1
- Rental income
- $26,444
- − Mortgage interest
- −$15,908
- − Property taxes
- −$582
- − Insurance
- −$1,420
- − Repairs & maintenance
- −$2,115
- − Management
- −$2,115
- − Depreciation
- −$8,262
- Taxable loss
- −$3,959
- Est. tax savings @ 24.0%
- +$950
- After-tax cash flow
- $1,967/yr
For passive investors: Depreciation is non-cash, so a rental often shows a tax loss while cash-flowing — sheltering income. Rental losses are passive: they offset passive income freely, and up to $25,000/yr can offset ordinary (W-2) income if you actively participate and your MAGI is under $100k (phasing out to $0 by $150k); unused losses carry forward. On sale, claimed depreciation is recaptured at up to 25%, and gains may owe capital-gains tax (a 1031 exchange can defer both). Figures are a year-1 estimate at your 24.0% rate — not tax advice; consult a CPA.
Schools (NCES district)
- District
- Charlotte
- NCES district ID
- 1200240
- Math proficiency
- 54% ▼ -6.00%
- Reading proficiency
- 54% ▼ -1.00%
- Median HH income
- $44,864
- Composite
- 45.62/100
- National rank
- #2586
- State rank
- #22 of 73 in FL
Livability — Port Charlotte
- Score
- 65/100
- State rank
- #655
- US rank
- #13081
Category grades
Schools grade is shown separately in the Schools card above.
Census & demographics
- Census place
- Port Charlotte, FL
- County
- Charlotte County · 196,994 people
- City population
- 102,180
- Metro
- Punta Gorda, FL
- Population (ZIP)
- 35,231
- Household income
- $61,382
- Rent vs Own
- Severe rent burden
- 733.0
Population outlook (Charlotte County) Hauer SSP2
- Today (2025)
- 198,646 people
- By 2030
- 210,507 · +6.0%
- By 2040
- 230,857 · +16.2%
- By 2050
- 247,148 · +24.4%
- By 2075
- 281,777 · +41.8%
- By 2100
- 293,609 · +47.8%
Race, ethnicity, and origin ACS 2023
- Neighborhood character
- Predominantly White (76%)
- Race & ethnicity
- White 76% Hispanic / Latino 14% Two or more races 8% Black 6% Asian 2%
- Hispanic origin (detail)
- Mexican 2% Puerto Rican 3% Cuban 2%
- Common ancestry
- Lithuanian 2% Romanian 2% Italian 2%
- Foreign-born
- 12% · Canada, Vietnam
- Languages at home
- 85% English-only · Spanish 10% French/Haitian/Cajun 1% Russian/Polish/Slavic 1%
Political lean MEDSL · Charlotte
- 2024 margin
- Solid R (+34.0) · D 32.7% · R 66.7%
- 2008→2024 swing
- -26.7pp toward R · 2008: -7.2pp · 2024: -34.0pp
- All cycles
- 2024: R+34.0 2020: R+26.6 2016: R+27.8 2012: R+14.3 2008: R+7.2
Not yet ingested
- Civics
- —
Market trends
- HPI YoY
- ▼ -17.18%
- Current HPI
- 339.0932
- Rent YoY
- ▼ -1.35%
- Metro
- Punta Gorda, FL
- State GDP YoY
- ▲ 3.28%
- F500 in state
- 36
Industry mix (Fortune 500 HQ in FL)
| Industry | F500 HQs | Revenue |
|---|---|---|
| Industrial Technology | 2 | $29B |
|
||
| Insurance | 2 | $17B |
|
||
| Retail | 1 | $60B |
|
||
| Technology Distribution | 1 | $58B |
|
||
| Homebuilding | 1 | $35B |
|
||
| Technology Manufacturing | 1 | $35B |
|
||
Price history
+2266.6% since first listed9 events — show timeline
- 2026-04-17 Pending — Stellar MLS as Distributed by MLS Grid
- 2026-04-15 Price Changed $283,990 Stellar MLS as Distributed by MLS Grid
- 2026-04-08 Price Changed $284,990 Stellar MLS as Distributed by MLS Grid
- 2026-04-01 Price Changed $285,990 Stellar MLS as Distributed by MLS Grid
- 2026-03-02 Listed $294,990 Stellar MLS as Distributed by MLS Grid
- 2015-10-08 Sold (Public Records) $8,500 Public Records
- 2015-06-05 Sold (Public Records) $35,200 Public Records
- 2005-07-25 Sold (Public Records) $30,000 Public Records
- 2004-02-18 Sold (Public Records) $12,000 Public Records
Property tax history
+5.1%/yrLatest (2025): $582 · -6.2% YoY. Source: county tax records.
Cash-flow waterfall
monthlySold comps — $/sqft
last 12 mo · ≤1 miLoading sold comps…