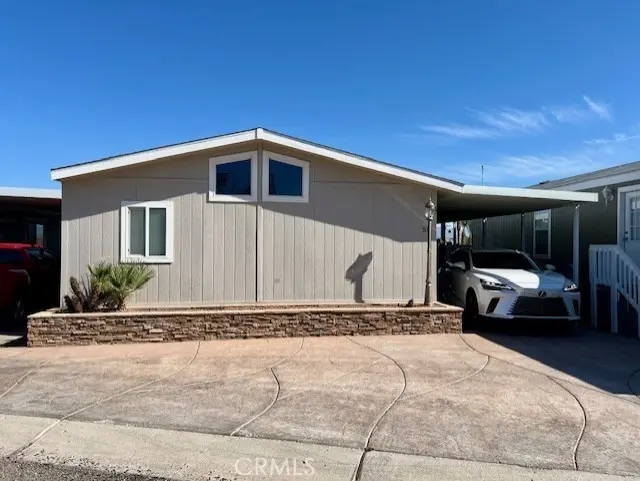
4170 Needles Hwy #55 · Needles, CA
Flood risk No data
- FEMA flood zone
- —
- Chance of flooding over 30 yrs
- —
- Est. flood insurance / yr
- —
Fire risk No data
- Est. fire insurance / yr
- —
Heat risk No data
- Hot days now (above threshold)
- —
- Hot days in 30 yrs
- —
Wind risk No data
- Chance of severe wind over 30 yrs
- —
Air-quality risk No data
- Unhealthy air days now
- —
- Unhealthy air days in 30 yrs
- —
Risk factors via First Street. Map © Google.
Why this score? — see what drove the D grade
The composite is a weighted blend of 9 inputs, each scored 0–100. Each bar is that input's sub-score; the figure is the points it added to the 100-point composite (weight × sub-score).
- Cash flow +11.2/30.0
- ARV discount +7.5/15.0
- Appreciation +5.8/10.0
- Condition / age +3.8/5.0
- 1% rule +3.3/10.0
- DSCR +3.3/10.0
- Livability +3.1/5.0
- Rent growth +2.5/5.0
- Schools +2.3/10.0
$189,000
🖨 Deal sheet 📄 Offer letter ✓ Due diligence
Listing remarks MLS
Wow! Beautiful park model in the impressive gate guarded community of The Palms River Resort. This one comes turnkey, just bring your toothbrush and move on in. Two spacious bedrooms & two full bathrooms. Huge back deck & private hot tub perfect for relaxing after a day on the river. The community is amazing! Two pools plus a kiddie pool and two Jacuzzi's. Boat launch, sandy beach, dock, clubhouse, store, basketball court, fitness center, game room with pool table, shuffleboard & so much more! Be sure and stop in to see this one. Very easy to show.
Key facts
- Hot tub
- Huge back deck
- Kiddie pool
Tags
Neighborhood map
What this means for you Summary
Snapshot
- This is a 2-bed/2.0-bath manufactured listed at $189k. Condition is rated good.
Deal economics
- At list price, monthly cash flow is $-71 ($-854/yr) — negative.
- To cash-flow at today's rent, offer at most $179k (5.4% below list).
- To meet the 1% rule (rent ≥ 1% of price), the offer needs to be $156k (17.3% below list).
- Recommended offer: $156k (17.3% below list) — sets the bar for 1% rule.
Location & tenants
- Location reads 62/100 on livability (#492 in CA) — a middle-class / working-renter tenant base. Strengths: commute A+, cost of living A+, housing A+; Watch: health & safety C-, schools D+, crime F.
- Needles Unified (town): math 22% / reading 28% proficiency, ranked #1,194 of 1,400 in CA (top 85%) — low school quality limits family demand, transient renter base, plan for 1-2y turnover; 68% free/reduced lunch — lower-income household profile, screen leases tightly.
- Market conditions: 151 active listings in the ZIP; 5,458 units permitted in San Bernardino County in 2024 (1,500 in 5+ unit buildings).
Forward outlook
- In year one you build about $4k of equity ($1k loan paydown + $3k appreciation (1.6% local appreciation)).
- San Bernardino County population projected at +15% by 2050 — modest demand growth; plan on rents tracking national, not racing it.
- At projected returns (1.6% appreciation + 3.0% rent growth), your $53k cash investment doubles in ~10 years — after that, you're playing with house money.
- By year 8, paydown + projected appreciation supports a ~$34k cash-out refi (75% LTV) — recoverable capital for the next deal without selling this one.
Negotiation context
- It's been on market 140 days — a 12% lower offer ($166k) is reasonable based on typical stale-listing flexibility.
Questions for the listing agent
- What do current leases actually rent for vs. the listed asking? Can we see a recent rent roll and the last 12 months of T-12 income?
- It's been on market 140 days. Have you received any prior offers? Is the seller open to a 17% concession, seller financing, or rate buy-down credit?
- Why hasn't it sold? Are there any deal-killer items the seller is aware of (foundation, flood, title, zoning, code violations)?
- Is there a deadline driving the sale (1031 exchange, divorce, estate, relocation)? That informs how much negotiation room exists.
- Schools are D-rated, which usually means shorter tenancies and higher turnover. Who's the typical renter profile here, and what's been the actual vacancy rate?
- Crime grade is F in this area — have there been break-ins, vandalism, or insurance claims at this property in the last 3 years? What carrier currently insures it and at what premium?
- The area grade is low — what's the realistic commute time and amenity access for the typical tenant pool here? Any planned neighborhood developments (good or bad) we should know about?
- What's the average days-on-market for RENTAL listings here right now (not sales)? A rising rental-DOM trend means longer vacancies and softer asking-rent achievability than the comps imply.
- What's the recent tenant-quality profile in this submarket — average credit score on applications, eviction rate, late-payment / NSF rate, and stable-employment percentage? A property-management company in the area should have these aggregated.
- How much new for-sale + rental construction is in the pipeline within 1–3 miles? Heavy new supply typically softens prices + rents 12–24 months out; constrained supply supports both.
Investment metrics
- 1% rule
- 0.83% ✗
- Cap rate
- 5.84%
- Cash-on-cash
- -1.61%
- DSCR
- 0.93
- GRM
- 10.1
CMA / ARV
- ARV (median comp)
- $559,105
- List price
- $189,000
- Delta
- -66.20%
- Verdict
- UNDERPRICED
- Comps
- 4 within 2.0 mi
Projected returns pro-forma
1.64% appreciation · 3.0% rent growth · sell at horizon
- IRR
- 1.8%
- Equity multiple
- 1.10×
- Total profit
- $5,059
- Equity at exit
- $70,939
- IRR
- 6.0%
- Equity multiple
- 1.79×
- Total profit
- $41,789
- Equity at exit
- $99,451
Cash invested: $52,920 (down + closing). Projections, not guarantees.
Landlord ↔ Tenant lean methodology
- Overall (STATE)
- 18 Strongly Tenant-Friendly
- State California
- 18 Strongly Tenant-Friendly · D+13
- County
- — inherits STATE
- City
- — inherits STATE
ZIP-level market 92363
- Home prices YoY
- 0.6%
- Active inventory
- 151
- Price-to-rent
- 10.1×
Monthly cashflow live
- Estimated rent
- $1,563 medium interval (Pro) →
- Mortgage (P&I)
- −$991
- Tax est. 1.5%
- −$236 /mo · $2,835/yr
- Insurance
- −$79
- HOA
- −$0
- Vacancy / Maint / Mgmt
- −$328
- Net cashflow
- $-71
Break-even live
UW: 25.0% down · 7.5% · 30yr · 1.5% tax · 5.0% vac · 8.0% maint · 8.0% mgmt
Financing live
Cash to close
- Down payment
- $47,250
- Closing costs
- $5,670
- Reserves months
- —
- Total cash needed
- —
Loan-product check · same deal, 3 products live
Conventional
25% down · 7.5% · 30yr
- Down + closing
- —
- Monthly P&I
- —
- Monthly cashflow
- —
- DSCR
- —
- Eligible?
- —
Personal DTI + credit; lowest rate.
DSCR
20% down · 8.5% · 30yr
- Down + closing
- —
- Monthly P&I
- —
- Monthly cashflow
- —
- DSCR
- —
- Eligible?
- —
No personal income docs; deal must DSCR.
Hard money
10% down · 12.0% · 12mo
- Down + closing
- —
- Monthly P&I
- —
- Monthly cashflow
- —
- DSCR
- —
- Eligible?
- —
Short-term bridge; refi at stabilization.
Listing history 17 events
-
2026-06-19days on market $189,000 Active 140 DOM
-
2026-06-18days on market $189,000 Active 139 DOM
-
2026-06-17days on market $189,000 Active 138 DOM
-
2026-06-16days on market $189,000 Active 137 DOM
-
2026-06-15days on market $189,000 Active 136 DOM
-
2026-06-14days on market $189,000 Active 134 DOM
-
2026-06-13days on market $189,000 Active 133 DOM
-
2026-06-10days on market $189,000 Active 131 DOM
-
2026-06-09days on market $189,000 Active 130 DOM
-
2026-06-08days on market $189,000 Active 129 DOM
-
2026-06-07days on market $189,000 Active 128 DOM
-
2026-06-05days on market $189,000 Active 125 DOM
-
2026-06-02days on market $189,000 Active 123 DOM
-
2026-06-01days on market $189,000 Active 122 DOM
-
2026-05-31days on market $189,000 Active 121 DOM
-
2026-05-30days on market $189,000 Active 120 DOM
-
2026-01-30$189,000 Active 572-char remark
Show marketing remark (572 chars)
Wow! Beautiful park model in the impressive gate guarded community of The Palms River Resort. This one comes turnkey, just bring your toothbrush and move on in. Two spacious bedrooms & two full bathrooms. Huge back deck & private hot tub perfect for relaxing after a day on the river. The community is amazing! Two pools plus a kiddie pool and two Jacuzzi's. Boat launch, sandy beach, dock, clubhouse, store, basketball court, fitness center, game room with pool table, shuffleboard & so much more! Be sure and stop in to see this one. Very easy to show.
ⓘ Source: listings_history table (triggers on properties + properties_extension) + one-shot
backfill from property_details.listing_events for pre-trigger history.
Nearby sold comps map
Loading sold comps map…
Walkable amenities ~0.75 mi
Loading nearby amenities…
Taxation est. · year 1
- Rental income
- $18,759
- − Mortgage interest
- −$10,587
- − Property taxes
- −$2,835
- − Insurance
- −$945
- − Repairs & maintenance
- −$1,501
- − Management
- −$1,501
- − Depreciation
- −$5,498
- Taxable loss
- −$4,107
- Est. tax savings @ 24.0%
- +$986
- After-tax cash flow
- $132/yr
For passive investors: Depreciation is non-cash, so a rental often shows a tax loss while cash-flowing — sheltering income. Rental losses are passive: they offset passive income freely, and up to $25,000/yr can offset ordinary (W-2) income if you actively participate and your MAGI is under $100k (phasing out to $0 by $150k); unused losses carry forward. On sale, claimed depreciation is recaptured at up to 25%, and gains may owe capital-gains tax (a 1031 exchange can defer both). Figures are a year-1 estimate at your 24.0% rate — not tax advice; consult a CPA.
Condition & rehab AI · 1 photo
This manufactured home is in good condition with a turnkey setup, ready for immediate occupancy. A few cosmetic updates can further enhance its curb appeal and value.
Value-add opportunities
- Both Paint the exterior siding — Fresh paint can enhance curb appeal and the home's value.
- Both Replace the small palm tree with a more attractive plant — A more attractive plant can improve the home's curb appeal and rental value.
- Both Clean and organize the back deck — A clean and organized deck can enhance the home's resale and rental value.
- Both Install a new hot tub cover — A new hot tub cover can protect the hot tub and improve the home's curb appeal and rental value.
Renovation cost estimate screening
Value-add ROI direction
- Both Paint the exterior siding — Fresh paint can enhance curb appeal and the home's value. ↑
- Both Replace the small palm tree with a more attractive plant — A more attractive plant can improve the home's curb appeal and rental value. ↑
- Both Clean and organize the back deck — A clean and organized deck can enhance the home's resale and rental value. ↑
- Both Install a new hot tub cover — A new hot tub cover can protect the hot tub and improve the home's curb appeal and rental value. ↑
ⓘ Cost ranges are severity-bucket heuristics (US national rule-of-thumb). Get contractor quotes + a written scope before underwriting a rehab budget.
Schools (NCES district)
- District
- Needles Unified
- NCES district ID
- 0626760
- Math proficiency
- 22% ▼ -2.00%
- Reading proficiency
- 28% ▼ -1.00%
- Median HH income
- $31,795
- Composite
- 23.35/100
- National rank
- #13305
- State rank
- #1194 of 1400 in CA
Livability — Needles
- Score
- 62/100
- State rank
- #492
- US rank
- #16661
Category grades
Schools grade is shown separately in the Schools card above.
Census & demographics
- Census place
- Needles, CA
- Population (ZIP)
- 5,392
Population outlook (San Bernardino County) Hauer SSP2
- Today (2025)
- 2,300,329 people
- By 2030
- 2,378,907 · +3.4%
- By 2040
- 2,523,137 · +9.7%
- By 2050
- 2,642,388 · +14.9%
- By 2075
- 2,880,769 · +25.2%
- By 2100
- 2,909,436 · +26.5%
Race, ethnicity, and origin ACS 2023
- Neighborhood character
- Diverse neighborhood (Simpson 0.63)
- Race & ethnicity
- White 54% Hispanic / Latino 29% Two or more races 16% Native American 11% Black 3%
- Hispanic origin (detail)
- Mexican 24% Puerto Rican 2%
- Common ancestry
- Romanian 3% Iranian 3% Lithuanian 2%
- Foreign-born
- 3% · Canada, China
- Languages at home
- 89% English-only · Spanish 9% Chinese 1%
Political lean MEDSL · San Bernardino
- 2024 margin
- Toss-up / Even · D 47.5% · R 49.7% · Other 2.8%
- 2008→2024 swing
- -8.5pp toward R · 2008: 6.3pp · 2024: -2.1pp
- All cycles
- 2024: R+2.1 2020: D+10.7 2016: D+9.8 2012: D+5.4 2008: D+6.3
Not yet ingested
- Civics
- —
Market trends
- HPI YoY
- ▲ 1.64%
- Current HPI
- 279.7931
- Rent YoY
- —
- Metro
- —
- State GDP YoY
- ▲ 3.21%
- F500 in state
- 116
Industry mix (Fortune 500 HQ in CA)
| Industry | F500 HQs | Revenue |
|---|---|---|
| Technology | 27 | $1,492B |
|
||
| Financial Services | 3 | $174B |
|
||
| Retail | 3 | $44B |
|
||
| Insurance | 3 | $26B |
|
||
| Media / Entertainment | 2 | $115B |
|
||
| Pharmaceuticals / Biotech | 2 | $62B |
|
||
Price history
1 event — show timeline
- 2026-01-30 Listed $189,000 CRMLS
Property tax history
-9.9%/yrLatest (2025): $208 · -0.5% YoY. Source: county tax records.
Cash-flow waterfall
monthlySold comps — $/sqft
last 12 mo · ≤1 miLoading sold comps…