22 Brook Cir · Loudon, NH
Flood risk No data
- FEMA flood zone
- —
- Chance of flooding over 30 yrs
- —
- Est. flood insurance / yr
- —
Fire risk No data
- Est. fire insurance / yr
- —
Heat risk No data
- Hot days now (above threshold)
- —
- Hot days in 30 yrs
- —
Wind risk No data
- Chance of severe wind over 30 yrs
- —
Air-quality risk No data
- Unhealthy air days now
- —
- Unhealthy air days in 30 yrs
- —
Risk factors via First Street. Map © Google.
Why this score? — see what drove the D+ grade
The composite is a weighted blend of 9 inputs, each scored 0–100. Each bar is that input's sub-score; the figure is the points it added to the 100-point composite (weight × sub-score).
- ARV discount +15.0/15.0
- 1% rule +10.0/10.0
- Cash flow +9.8/30.0
- Livability +4.0/5.0
- Schools +2.9/10.0
- DSCR +2.8/10.0
- Rent growth +2.5/5.0
- Condition / age +2.5/5.0
- Appreciation +0.0/10.0
$83,900
🖨 Deal sheet 📄 Offer letter ✓ Due diligence
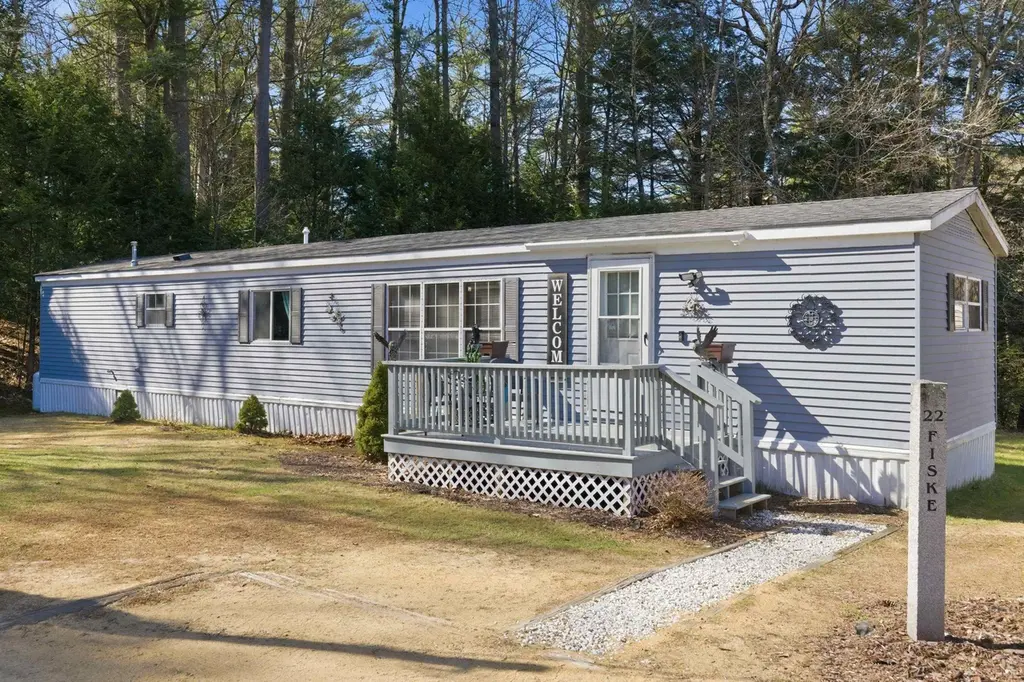
Listing remarks
Welcome to Scotch Pines! This 2-bedroom, 1-bath home is ideally situated on a desirable corner lot in a park neighborhood off Route 106, conveniently located between Concord and the Lakes Region. Enjoy outdoor living with an expansive yard-perfect for summer relaxation and entertaining. The home features a welcoming front deck, ideal for morning coffee or unwinding at the end of the day. A storage shed is included, offering added convenience. Recent updates provide peace of mind, including a roof just 5 years old and a propane furnace replaced 3 years ago. Park approval is required through an application process. Indoor cats only. Monthly lot rent is $550. A great opportunity for affordable
Key facts
- Front deck
- Recent updates
- Expansive yard
Tags
Property features AI
Finance
- HOA & community: Association fee $550 per month; Located in Scotch Pines development; Roads: association/private, paved and privately maintained
Exterior
- Parking: Driveway parking
- Utilities: Community water; Community sewer with leach field; Circuit breaker electrical; Propane (LP/Bottle) gas; High-speed internet available on-site
- Home design: Manufactured/Mobile home; Single-story (main living on one level); Located in Scotch Pines mobile park (park approved)
- Construction: Built in 1983; Aluminum siding; Asphalt shingle roof; Mobile serial number: Serial #20580321-55; Mobile make/model: 1983 Aircraft 14 x 70
- Exterior features: Corner lot; Near golf course; Dirt driveway
Interior
- Kitchen: Stove - Electric; Refrigerator
- Bedrooms: Two bedrooms (both on the main level)
- Flooring: Combination
- Bathrooms: One full bathroom (on the main level)
- Heating & cooling: Propane heating; Forced air
- Interior features: Combination flooring; 4 total rooms
- Laundry & utility: Washer; Dryer
Neighborhood map
What this means for you Summary
Snapshot
- This is a 2-bed/1.0-bath manufactured listed at $84k.
Deal economics
- At list price, monthly cash flow is $-53 ($-639/yr) — negative.
- To cash-flow at today's rent, offer at most $74k (11.2% below list).
- Meets the 1% rule at list price ($1k rent vs $84k).
- Recommended offer: $74k (11.2% below list) — sets the bar for cash-flow.
Location & tenants
- Location reads 80/100 on livability (#15 in NH, #1,714 nationally) — a professional / high-income tenant draw. Strengths: crime A+, employment A+, housing A+; Watch: amenities F, commute F.
- Merrimack Valley School District (town): math 27% / reading 38% proficiency, ranked #79 of 98 in NH (top 81%) — families likely to look elsewhere, expect single-tenant / working-renter base with shorter leases.
- Market conditions: 14 active listings in the ZIP; 380 units permitted in Merrimack County in 2024 (28 in 5+ unit buildings).
Forward outlook
- Local home prices are declining (-3.0%/yr); year-one equity from $580 of loan paydown is wiped out by about $3k of value loss. Plan a longer hold.
- Merrimack County population projected to shrink 5% by 2050 — rents likely to lag national; underwrite the cash flow, not the appreciation.
Negotiation context
- It's been on market 50 days — a 3% lower offer ($81k) is reasonable based on typical stale-listing flexibility.
Risks & watch-outs
- Watch-outs: HOA is 42% of rent.
Questions for the listing agent
- What do current leases actually rent for vs. the listed asking? Can we see a recent rent roll and the last 12 months of T-12 income?
- It's been on market 50 days. Have you received any prior offers? Is the seller open to a 11% concession, seller financing, or rate buy-down credit?
- What does the HOA fee cover, when was the last increase, and are there any pending special assessments or reserve-fund shortfalls?
- Is there a deadline driving the sale (1031 exchange, divorce, estate, relocation)? That informs how much negotiation room exists.
- Schools are B-rated — typically a magnet for longer-tenancy family renters. What's the average tenant stay here, and is there a school-zone premium baked into asking?
- The area grade is low — what's the realistic commute time and amenity access for the typical tenant pool here? Any planned neighborhood developments (good or bad) we should know about?
- What's the average days-on-market for RENTAL listings here right now (not sales)? A rising rental-DOM trend means longer vacancies and softer asking-rent achievability than the comps imply.
- What's the recent tenant-quality profile in this submarket — average credit score on applications, eviction rate, late-payment / NSF rate, and stable-employment percentage? A property-management company in the area should have these aggregated.
- How much new for-sale + rental construction is in the pipeline within 1–3 miles? Heavy new supply typically softens prices + rents 12–24 months out; constrained supply supports both.
Investment metrics
- 1% rule
- 1.56% ✓
- Cap rate
- 5.53%
- Cash-on-cash
- -2.72%
- DSCR
- 0.88
- GRM
- 5.3
CMA / ARV
- ARV (median comp)
- $112,202
- List price
- $83,900
- Delta
- -25.22%
- Verdict
- UNDERPRICED
- Comps
- 7 within 1.0 mi
Show comp detail 5 sales within ~0.75 mi
| Address | Dist | Beds/Ba | Sqft | Sold | Price | $/sf | Match |
|---|---|---|---|---|---|---|---|
| 5 Brook Cir | 0.11mi | 2/1.0 | 924 (-1%) | 7mo | $98,000 | $106 | 87 |
| 18 Brook Cir | 0.03mi | 2/1.5 | 924 (-1%) | 11mo | $103,000 | $111 | 86 |
| 7014 Lake St | 0.19mi | 2/1.0 | 840 (-10%) | 18mo | $130,000 | $155 | 60 |
| 7006 Lake St | 0.25mi | 3/2.0 (+1) | 1,064 (+14%) | 4mo | $123,900 | $116 | 53 |
| 4 Pond St | 0.20mi | 2/2.0 | 1,064 (+14%) | 21mo | $119,000 | $112 | 46 |
Match score weights: distance 35% · size 25% · config 20% · recency 20%. Top-matched comps best support the ARV.
Projected returns pro-forma
-3.0% appreciation · 3.0% rent growth · sell at horizon
- IRR
- -20.3%
- Equity multiple
- 0.29×
- Total profit
- $-16,657
- Equity at exit
- $12,510
- IRR
- -12.4%
- Equity multiple
- 0.25×
- Total profit
- $-17,529
- Equity at exit
- $7,254
Cash invested: $23,492 (down + closing). Projections, not guarantees.
Landlord ↔ Tenant lean methodology
- Overall (STATE)
- 56 Moderately Landlord-Leaning
- State New Hampshire
- 56 Moderately Landlord-Leaning · D+1
- County
- — inherits STATE
- City
- — inherits STATE
ZIP-level market 03307
- Home prices YoY
- -8.7%
- Active inventory
- 14
- Price-to-rent
- 5.3×
Monthly cashflow live
- Estimated rent
- $1,307 medium interval (Pro) →
- Mortgage (P&I)
- −$440
- Tax from tax record
- −$61 /mo · $733/yr
- Insurance
- −$35
- HOA
- −$550
- Vacancy / Maint / Mgmt
- −$275
- Net cashflow
- $-53
Break-even live
UW: 25.0% down · 7.5% · 30yr · 1.5% tax · 5.0% vac · 8.0% maint · 8.0% mgmt
Financing live
Cash to close
- Down payment
- $20,975
- Closing costs
- $2,517
- Reserves months
- —
- Total cash needed
- —
Loan-product check · same deal, 3 products live
Conventional
25% down · 7.5% · 30yr
- Down + closing
- —
- Monthly P&I
- —
- Monthly cashflow
- —
- DSCR
- —
- Eligible?
- —
Personal DTI + credit; lowest rate.
DSCR
20% down · 8.5% · 30yr
- Down + closing
- —
- Monthly P&I
- —
- Monthly cashflow
- —
- DSCR
- —
- Eligible?
- —
No personal income docs; deal must DSCR.
Hard money
10% down · 12.0% · 12mo
- Down + closing
- —
- Monthly P&I
- —
- Monthly cashflow
- —
- DSCR
- —
- Eligible?
- —
Short-term bridge; refi at stabilization.
HOA detail
- Monthly dues
- $550 · $6,600/yr
Listing history 18 events
-
2026-06-19days on market $83,900 Active 50 DOM
-
2026-06-18days on market $83,900 Active 49 DOM
-
2026-06-17days on market $83,900 Active 48 DOM
-
2026-06-16days on market $83,900 Active 47 DOM
-
2026-06-15days on market $83,900 Active 46 DOM
-
2026-06-14days on market $83,900 Active 44 DOM
-
2026-06-13days on market $83,900 Active 43 DOM
-
2026-06-10days on market $83,900 Active 41 DOM
-
2026-06-09days on market $83,900 Active 40 DOM
-
2026-06-08days on market $83,900 Active 39 DOM
-
2026-06-07days on market $83,900 Active 38 DOM
-
2026-06-05pricedays on market $83,900 Active 35 DOM
-
2026-06-02days on market $89,900 Active 33 DOM
-
2026-06-01days on market $89,900 Active 32 DOM
-
2026-05-31days on market $89,900 Active 31 DOM
-
2026-05-30days on market $89,900 Active 30 DOM
-
2026-05-12price $89,900 858-char remark
-
2026-04-30$92,500 Active 858-char remark
ⓘ Source: listings_history table (triggers on properties + properties_extension) + one-shot
backfill from property_details.listing_events for pre-trigger history.
Tax reassessment forecast NH · Partial reset (capped growth)
- Current annual tax
- $733 · $61/mo
- Projected year-2 tax
- $1,281 · $107/mo
- Expected delta
- +$548/yr (+$46/mo · 74.8%)
ⓘ Screening estimate from a state-policy table — verify with the county assessor before closing.
Nearby sold comps map
Loading sold comps map…
Walkable amenities ~0.75 mi
Loading nearby amenities…
Taxation est. · year 1
- Rental income
- $15,687
- − Mortgage interest
- −$4,700
- − Property taxes
- −$733
- − Insurance
- −$420
- − Repairs & maintenance
- −$1,255
- − Management
- −$1,255
- − HOA
- −$6,600
- − Depreciation
- −$2,441
- Taxable loss
- −$1,715
- Est. tax savings @ 24.0%
- +$412
- After-tax cash flow
- $-227/yr
For passive investors: Depreciation is non-cash, so a rental often shows a tax loss while cash-flowing — sheltering income. Rental losses are passive: they offset passive income freely, and up to $25,000/yr can offset ordinary (W-2) income if you actively participate and your MAGI is under $100k (phasing out to $0 by $150k); unused losses carry forward. On sale, claimed depreciation is recaptured at up to 25%, and gains may owe capital-gains tax (a 1031 exchange can defer both). Figures are a year-1 estimate at your 24.0% rate — not tax advice; consult a CPA.
Schools (NCES district)
- District
- Merrimack Valley School District
- NCES district ID
- 3304760
- Math proficiency
- 27% ▼ -15.00%
- Reading proficiency
- 38% ▼ -13.00%
- Median HH income
- $62,967
- Composite
- 29.48/100
- National rank
- #6507
- State rank
- #79 of 98 in NH
Livability — Loudon
- Score
- 80/100
- State rank
- #15
- US rank
- #1714
Category grades
Schools grade is shown separately in the Schools card above.
Census & demographics
- Population (ZIP)
- 5,683
Population outlook (Merrimack County) Hauer SSP2
- Today (2025)
- 151,287 people
- By 2030
- 151,867 · +0.4%
- By 2040
- 149,927 · -0.9%
- By 2050
- 144,081 · -4.8%
- By 2075
- 132,018 · -12.7%
- By 2100
- 111,733 · -26.1%
Race, ethnicity, and origin ACS 2023
- Neighborhood character
- Predominantly White (97%)
- Race & ethnicity
- White 97% Two or more races 2%
- Common ancestry
- Lithuanian 11% Romanian 3% Slovak 2%
- Foreign-born
- 3% · Canada, China
- Languages at home
- 98% English-only · French/Haitian/Cajun 1% Russian/Polish/Slavic 1%
Political lean MEDSL · Merrimack
- 2024 margin
- Lean D (+5.2) · D 52.1% · R 46.9% · Other 1.0%
- 2008→2024 swing
- -8.7pp toward R · 2008: 13.9pp · 2024: 5.2pp
- All cycles
- 2024: D+5.2 2020: D+9.8 2016: D+3.1 2012: D+12.7 2008: D+13.9
Not yet ingested
- Civics
- —
Market trends
- HPI YoY
- ▼ -33.77%
- Current HPI
- 355.9677
- Rent YoY
- —
- Metro
- —
- State GDP YoY
- —
- F500 in state
- 0
Price history
-9.3% since first listed3 events — show timeline
- 2026-06-04 Price Changed $83,900 PrimeMLS
- 2026-05-12 Price Changed $89,900 PrimeMLS
- 2026-04-30 Listed $92,500 PrimeMLS
Property tax history
+2.1%/yrLatest (2025): $733 · -2.1% YoY. Source: county tax records.
Cash-flow waterfall
monthlySold comps — $/sqft
last 12 mo · ≤1 miLoading sold comps…