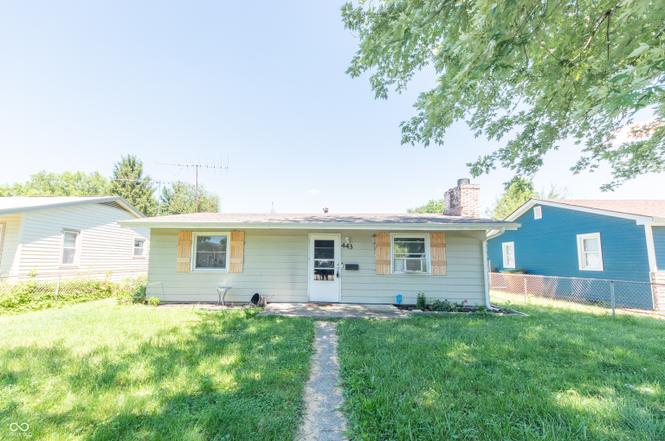
443 Cleveland St · Columbus, IN
Flood risk 1/10 · Minimal
- FEMA flood zone
- X (unshaded)
- Chance of flooding over 30 yrs
- 0.0%
- Est. flood insurance / yr
- $507 – $1,088
Fire risk 1/10 · Minimal
- Est. fire insurance / yr
- $717 – $1,331
Heat risk 4/10 · Minor
- Hot days now (above 103°F)
- 7 days/yr
- Hot days in 30 yrs
- 19 days/yr
Wind risk 2/10 · Minimal
- Chance of severe wind over 30 yrs
- 2.0%
Air-quality risk 2/10 · Minimal
- Unhealthy air days now
- 1 days/yr
- Unhealthy air days in 30 yrs
- 2 days/yr
Risk factors via First Street. Map © Google.
Why this score? — see what drove the F grade
The composite is a weighted blend of 9 inputs, each scored 0–100. Each bar is that input's sub-score; the figure is the points it added to the 100-point composite (weight × sub-score).
- Cash flow +13.8/30.0
- DSCR +4.2/10.0
- Livability +4.0/5.0
- Schools +3.6/10.0
- Rent growth +3.3/5.0
- 1% rule +2.8/10.0
- Condition / age +2.5/5.0
- ARV discount +0.0/15.0
- Appreciation +0.0/10.0
$175,000
🖨 Deal sheet 📄 Offer letter ✓ Due diligence
Listing remarks MLS
Investment opportunity! Well-kept home, with central A/C, fenced yard, nice storage shed and lots of perennials! <P>PROPERTY SELLS AT AUCTION MAY 15 AT 4:30 PM!!!!!!!
Key facts
- 6,750 sq ft lot
- Built 1958
- Listed 3 days
Property features AI
Finance
- Other: Property type: Residential; Lot size approximately 0.16 acre
Exterior
- Parking: Gravel parking
- Utilities: Public water; Municipal sewer; 100 Amp electric service; Cable available; Electricity connected; Natural gas connected
- Home design: Single-family residence; One-story home
- Construction: Aluminum siding; Slab foundation
- Exterior features: Partial fencing; Storage shed
Interior
- Kitchen: Electric oven; Refrigerator; Eat-in kitchen layout
- Bedrooms: Two bedrooms on the main level (sizes approx. 9x11 and 9x12)
- Bathrooms: One full bathroom on the main level
- Heating & cooling: Forced air heating (natural gas); Central air conditioning
- Interior features: Eat-in kitchen; Living room fireplace
- Laundry & utility: Washer; Dryer; Main-level laundry (approx. 11x5)
Neighborhood map
What this means for you Summary
Snapshot
- This is a 2-bed/1.0-bath single-family listed at $175k.
Deal economics
- At list price, monthly cash flow is $17 ($202/yr) — positive.
- The deal already cash-flows at list — no discount required.
- To meet the 1% rule (rent ≥ 1% of price), the offer needs to be $136k (22.5% below list).
- Recommended offer: $136k (22.5% below list) — sets the bar for 1% rule.
- Cap rate 6.4% vs local median 3.5% in Columbus — top-decile yield for the area; either an underpriced asset or a hidden risk that comps aren't pricing in. Stress-test before assuming the spread holds.
Location & tenants
- Location reads 79/100 on livability (#24 in IN, #1,978 nationally) — a middle-class / working-renter tenant base. Strengths: crime A+, cost of living A+, housing A+; Watch: amenities D+, commute F.
- Bartholomew Consolidated School Corporation (urban): math 38% / reading 45% proficiency, ranked #119 of 301 in IN (top 40%) — families likely to look elsewhere, expect single-tenant / working-renter base with shorter leases.
- Market conditions: Rents rising (+3.1%/yr); 340 active listings in the ZIP; 7 comparable units currently listed for rent nearby; rentals lingering (median 44d on market — plan ~5-8 weeks vacancy on turnover, expect pricing pressure); 71% of comp listings sitting > 30 days — soft ceiling on asking rent; solid renter incomes; 195 units permitted in Bartholomew County in 2024 (0 in 5+ unit buildings).
Forward outlook
- Local home prices are declining (-3.0%/yr); year-one equity from $1k of loan paydown is wiped out by about $5k of value loss. Plan a longer hold.
- Bartholomew County population projected at +22% by 2050 — long-run rental-demand tailwind backs the buy-and-hold thesis.
Negotiation context
- Only 4 days on market — expect competitive offers; lowballing is unlikely to land.
- 2 sale attempts since 23y ago with the ask held roughly flat each time — persistent listings suggest the price (not the market) is what's stuck; bring a comps-based counter.
- Current owner paid $39k; list at $175k implies a 349% gain — meaningful room to come down on a strong offer.
Risks & watch-outs
- Watch-outs: built in 1958 — expect roof / HVAC / electrical / plumbing capex.
Questions for the listing agent
- Built in 1958 — when were the roof, HVAC, electrical panel, plumbing, and water heater last replaced?
- Is there a deadline driving the sale (1031 exchange, divorce, estate, relocation)? That informs how much negotiation room exists.
- Schools are B-rated — typically a magnet for longer-tenancy family renters. What's the average tenant stay here, and is there a school-zone premium baked into asking?
- The area grade is low — what's the realistic commute time and amenity access for the typical tenant pool here? Any planned neighborhood developments (good or bad) we should know about?
- What's the average days-on-market for RENTAL listings here right now (not sales)? A rising rental-DOM trend means longer vacancies and softer asking-rent achievability than the comps imply.
- What's the recent tenant-quality profile in this submarket — average credit score on applications, eviction rate, late-payment / NSF rate, and stable-employment percentage? A property-management company in the area should have these aggregated.
- How much new for-sale + rental construction is in the pipeline within 1–3 miles? Heavy new supply typically softens prices + rents 12–24 months out; constrained supply supports both.
Investment metrics
- 1% rule
- 0.78% ✗
- Cap rate
- 6.41%
- Cash-on-cash
- 0.41%
- DSCR
- 1.02
- GRM
- 10.8
CMA / ARV
- ARV (on-the-fly)
- $147,696
- Comps found
- 12
Show comp detail 12 sales within ~0.75 mi
| Address | Dist | Beds/Ba | Sqft | Sold | Price | $/sf | Match |
|---|---|---|---|---|---|---|---|
| 428 Cleveland St | 0.03mi | 2/1.0 | 924 (+13%) | 14mo | $155,000 | $168 | 65 |
| 2612 13th St | 0.62mi | 2/1.0 | 816 (0%) | 8mo | $148,000 | $181 | 64 |
| 2921 10th St | 0.52mi | 2/1.0 | 852 (+4%) | 7mo | $138,900 | $163 | 63 |
| 355 Mcclure Rd | 0.33mi | 2/1.0 | 756 (-7%) | 12mo | $106,500 | $141 | 63 |
| 52 N Ross St | 0.38mi | 2/1.0 | 892 (+9%) | 12mo | $170,000 | $191 | 57 |
| 213 Hege Ave | 0.71mi | 2/1.0 | 848 (+4%) | 4mo | $119,000 | $140 | 57 |
| 2133 10th St | 0.41mi | 2/1.0 | 896 (+10%) | 10mo | $140,000 | $156 | 57 |
| 1305 Court St | 0.64mi | 3/1.0 (+1) | 738 (-10%) | 1mo | $180,000 | $244 | 49 |
| 2905 Kentucky Ave | 0.74mi | 3/1.0 (+1) | 864 (+6%) | 4mo | $173,900 | $201 | 48 |
| 1215 N Gladstone Ave | 0.56mi | 3/1.0 (+1) | 925 (+13%) | 4mo | $102,000 | $110 | 43 |
| 1317 Court St | 0.67mi | 3/1.0 (+1) | 932 (+14%) | 11mo | $170,000 | $182 | 31 |
| 2805 Kentucky Ave | 0.72mi | 3/1.0 (+1) | 936 (+15%) | 7mo | $172,000 | $184 | 31 |
Match score weights: distance 35% · size 25% · config 20% · recency 20%. Top-matched comps best support the ARV.
Projected returns pro-forma
-3.0% appreciation · 3.15% rent growth · sell at horizon
- IRR
- -15.6%
- Equity multiple
- 0.45×
- Total profit
- $-27,157
- Equity at exit
- $26,093
- IRR
- -6.9%
- Equity multiple
- 0.56×
- Total profit
- $-21,728
- Equity at exit
- $15,131
Cash invested: $49,000 (down + closing). Projections, not guarantees.
Landlord ↔ Tenant lean methodology
- Overall (STATE)
- 90 Strongly Landlord-Friendly
- State Indiana
- 90 Strongly Landlord-Friendly · R+11
- County
- — inherits STATE
- City
- — inherits STATE
ZIP-level market 47201
- Rents YoY
- 3.1%
- Active inventory
- 340
- Price-to-rent
- 10.8×
Monthly cashflow live
- Estimated rent
- $1,357 high interval (Pro) →
- Mortgage (P&I)
- −$918
- Tax from tax record
- −$64 /mo · $771/yr
- Insurance
- −$73
- HOA
- −$0
- Vacancy / Maint / Mgmt
- −$285
- Net cashflow
- $17
Break-even live
UW: 25.0% down · 7.5% · 30yr · 1.5% tax · 5.0% vac · 8.0% maint · 8.0% mgmt
Financing live
Cash to close
- Down payment
- $43,750
- Closing costs
- $5,250
- Reserves months
- —
- Total cash needed
- —
Loan-product check · same deal, 3 products live
Conventional
25% down · 7.5% · 30yr
- Down + closing
- —
- Monthly P&I
- —
- Monthly cashflow
- —
- DSCR
- —
- Eligible?
- —
Personal DTI + credit; lowest rate.
DSCR
20% down · 8.5% · 30yr
- Down + closing
- —
- Monthly P&I
- —
- Monthly cashflow
- —
- DSCR
- —
- Eligible?
- —
No personal income docs; deal must DSCR.
Hard money
10% down · 12.0% · 12mo
- Down + closing
- —
- Monthly P&I
- —
- Monthly cashflow
- —
- DSCR
- —
- Eligible?
- —
Short-term bridge; refi at stabilization.
Rent comps 7 comps
| Address | Beds | Baths | Sqft | Rent | $/sqft | DOM | Units | Dist |
|---|---|---|---|---|---|---|---|---|
| 1182 Quail Run Dr Columbus, IN | 1.0–3.0 | 1.0–2.0 | 967 | $1,375 | $1.42 | 43d | 16 | 0.45mi |
| 420 Wint Ln Columbus, IN | 1.0–2.0 | 1.0–2.0 | 950 | $1,450 | $1.53 | 43d | 1 | 0.55mi |
| 275 N Marr Rd Columbus, IN | 1.0–2.0 | 1.0–2.0 | 897 | $1,540 | $1.72 | 43d | 4 | 0.66mi |
| 1001 Ashford Park Pl Columbus, IN | 1.0 | 1.0 | 740 | $935 | $1.26 | 21d | 1 | 0.68mi |
| 3393 Country Brook St Columbus, IN | 1.0–3.0 | 1.5 | 821 | $1,442 | $1.76 | 43d | 10 | 0.71mi |
| 725 Sycamore St Columbus, IN | 1.0–2.0 | 1.0–2.0 | 766 | $1,525 | $1.99 | 21d | 11 | 1.07mi |
| 782 Clifty Ln Columbus, IN | 1.0–2.0 | 1.0–2.0 | 999 | $1,360 | $1.36 | 43d | 1 | 1.12mi |
Listing history 5 events
-
2026-06-19days on market $175,000 Active 4 DOM
-
2026-06-18days on market $175,000 Active 3 DOM
-
2026-06-17days on market $175,000 Active 2 DOM
-
2026-06-15remarks 346-char remark
-
2026-06-15$175,000 Active 1 DOM
ⓘ Source: listings_history table (triggers on properties + properties_extension) + one-shot
backfill from property_details.listing_events for pre-trigger history.
Tax reassessment forecast IN · Partial reset (capped growth)
- Current annual tax
- $771 · $64/mo
- Projected year-2 tax
- $1,129 · $94/mo
- Expected delta
- +$358/yr (+$30/mo · 46.5%)
ⓘ Screening estimate from a state-policy table — verify with the county assessor before closing.
Climate risk First Street
- Flood 1/10 Low FEMA zone X (unshaded) · 0% chance over 30 yrs
- Wildfire 1/10 Low
- Heat 4/10 Moderate 7 d/yr ≥103°F today · 19 d/yr by 30 yrs out
- Wind 2/10 Low 2% chance of damaging wind over 30 yrs
- Air quality 2/10 Low 1 unhealthy d/yr today · 2 by 30 yrs out
Nearby sold comps map
Loading sold comps map…
Walkable amenities ~0.75 mi
Loading nearby amenities…
Taxation est. · year 1
- Rental income
- $16,278
- − Mortgage interest
- −$9,803
- − Property taxes
- −$771
- − Insurance
- −$875
- − Repairs & maintenance
- −$1,302
- − Management
- −$1,302
- − Depreciation
- −$5,091
- Taxable loss
- −$2,865
- Est. tax savings @ 24.0%
- +$688
- After-tax cash flow
- $889/yr
For passive investors: Depreciation is non-cash, so a rental often shows a tax loss while cash-flowing — sheltering income. Rental losses are passive: they offset passive income freely, and up to $25,000/yr can offset ordinary (W-2) income if you actively participate and your MAGI is under $100k (phasing out to $0 by $150k); unused losses carry forward. On sale, claimed depreciation is recaptured at up to 25%, and gains may owe capital-gains tax (a 1031 exchange can defer both). Figures are a year-1 estimate at your 24.0% rate — not tax advice; consult a CPA.
Schools (NCES district)
- District
- Bartholomew Consolidated School Corporation
- NCES district ID
- 1800360
- Math proficiency
- 38% ▼ -11.00%
- Reading proficiency
- 45% ▼ -7.00%
- Median HH income
- $54,685
- Composite
- 36.16/100
- National rank
- #4736
- State rank
- #119 of 301 in IN
Livability — Columbus
- Score
- 79/100
- State rank
- #24
- US rank
- #1978
Category grades
Schools grade is shown separately in the Schools card above.
Census & demographics
- Census place
- Columbus, IN
- County
- Bartholomew County · 74,100 people
- City population
- 74,100
- Metro
- Columbus, IN
- Population (ZIP)
- 47,900
- Household income
- $83,958
- Rent vs Own
- Severe rent burden
- 1455.0
Population outlook (Bartholomew County) Hauer SSP2
- Today (2025)
- 90,162 people
- By 2030
- 94,432 · +4.7%
- By 2040
- 102,659 · +13.9%
- By 2050
- 109,794 · +21.8%
- By 2075
- 123,419 · +36.9%
- By 2100
- 121,047 · +34.3%
Race, ethnicity, and origin ACS 2023
- Neighborhood character
- Predominantly White (75%)
- Race & ethnicity
- White 75% Hispanic / Latino 10% Asian 9% Two or more races 6% Black 2%
- Hispanic origin (detail)
- Mexican 8% Puerto Rican 1%
- Common ancestry
- Italian 3% Slovak 2% Serbian 1%
- Foreign-born
- 14% · Canada, China
- Languages at home
- 83% English-only · Spanish 8% Other Indo-European 5% Other Asian/Pacific 2%
Political lean MEDSL · Bartholomew
- 2024 margin
- Strong R (+27.3) · D 35.3% · R 62.7% · Other 2.0%
- 2008→2024 swing
- -16.1pp toward R · 2008: -11.3pp · 2024: -27.3pp
- All cycles
- 2024: R+27.3 2020: R+26.2 2016: R+33.3 2012: R+25.4 2008: R+11.3
Not yet ingested
- Civics
- —
Market trends
- HPI YoY
- ▼ -204.94%
- Current HPI
- 150.2246
- Rent YoY
- ▲ 3.15%
- Metro
- Columbus, IN
- State GDP YoY
- ▲ 2.90%
- F500 in state
- 18
Industry mix (Fortune 500 HQ in IN)
| Industry | F500 HQs | Revenue |
|---|---|---|
| Industrial Machinery | 2 | $37B |
|
||
| Healthcare | 1 | $177B |
|
||
| Pharmaceuticals | 1 | $45B |
|
||
| Metals / Steel | 1 | $18B |
|
||
| Agriculture | 1 | $17B |
|
||
| Packaging | 1 | $12B |
|
||
Price history
+348.7% since first listed3 events — show timeline
- 2026-06-12 Listed $175,000 MIBOR as Distributed by MLS Grid
- 2003-06-24 Sold (MLS) $39,000 MIBOR as Distributed by MLS Grid
- 2003-04-28 Listed $39,000 MIBOR as Distributed by MLS Grid
Property tax history
-2.8%/yrLatest (2025): $771 · -7.5% YoY. Source: county tax records.
Cash-flow waterfall
monthlySold comps — $/sqft
last 12 mo · ≤1 miLoading sold comps…