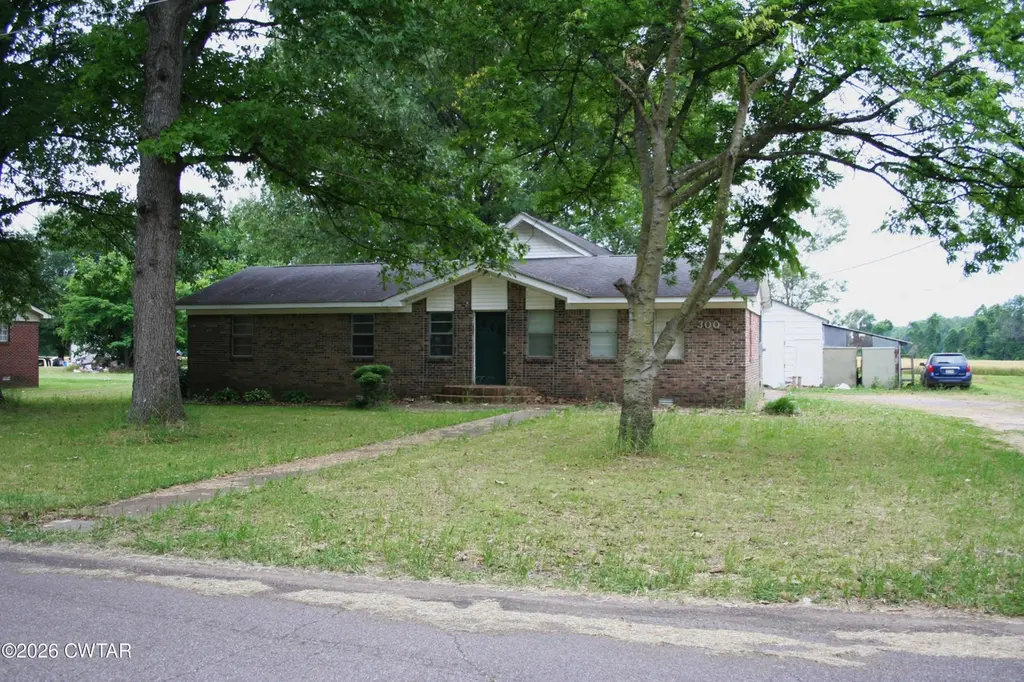
300 Jo Cir · Dyersburg, TN
Flood risk 1/10 · Minimal
- FEMA flood zone
- X (unshaded)
- Chance of flooding over 30 yrs
- 0.0%
- Est. flood insurance / yr
- $507 – $1,088
Fire risk 1/10 · Minimal
- Est. fire insurance / yr
- $949 – $1,763
Heat risk 5/10 · Moderate
- Hot days now (above 107°F)
- 7 days/yr
- Hot days in 30 yrs
- 20 days/yr
Wind risk 4/10 · Minor
- Chance of severe wind over 30 yrs
- 13.0%
Air-quality risk 2/10 · Minimal
- Unhealthy air days now
- 0 days/yr
- Unhealthy air days in 30 yrs
- 1 days/yr
Risk factors via First Street. Map © Google.
Why this score? — see what drove the C grade
The composite is a weighted blend of 9 inputs, each scored 0–100. Each bar is that input's sub-score; the figure is the points it added to the 100-point composite (weight × sub-score).
- Cash flow +20.4/30.0
- ARV discount +15.0/15.0
- DSCR +6.5/10.0
- 1% rule +4.3/10.0
- Schools +3.3/10.0
- Livability +3.2/5.0
- Rent growth +2.5/5.0
- Condition / age +2.5/5.0
- Appreciation +0.0/10.0
$135,000
🖨 Deal sheet 📄 Offer letter ✓ Due diligence
Listing remarks
Spacious home is a small subdivision! With your touch you can turn this into your dream home! This property has a 1/2-acre lot and mature trees that are a valuable asset!
Key facts
- 1/2-acre lot
- Mature trees
- 0.57 acre lot
Tags
Property features AI
Finance
- Financial info: Annual tax amount listed
Exterior
- Parking: Two covered carport spaces; Three open parking spaces; Total of 2 parking spaces listed (note: carport and open parking counts provided)
- Home design: Single-family residence; One story / single level
- Construction: One-story construction
- Exterior features: Gravel and open parking areas; Lot measures approximately 0.57 acres (about 110 x 225); Located in the Reaves subdivision; Directions: On highway 51 headed south, turn right onto Drew Road, go approximately 0.65 mile and turn left; the home is on the right
Interior
- Bedrooms: One bedroom on the main level
- Bathrooms: One full bathroom on the main level
- Heating & cooling: Central air conditioning; Electric heating
- Interior features: Four total rooms
Neighborhood map
What this means for you Summary
Snapshot
- This is a 3-bed/1.0-bath single-family listed at $135k.
Deal economics
- At list price, monthly cash flow is $175 ($2k/yr) — positive.
- The deal already cash-flows at list — no discount required.
- To meet the 1% rule (rent ≥ 1% of price), the offer needs to be $126k (6.9% below list).
- Recommended offer: $126k (6.9% below list) — sets the bar for 1% rule.
Location & tenants
- Location reads 64/100 on livability (#177 in TN) — a middle-class / working-renter tenant base. Strengths: cost of living A+, housing A+, health & safety A+; Watch: schools D, crime F, amenities F.
- Dyer County (rural): math 40% / reading 38% proficiency, ranked #16 of 139 in TN (top 12%) — families likely to look elsewhere, expect single-tenant / working-renter base with shorter leases.
- Market conditions: 66 active listings in the ZIP; 74 units permitted in Dyer County in 2024 (6 in 5+ unit buildings).
Forward outlook
- Local home prices are declining (-3.0%/yr); year-one equity from $933 of loan paydown is wiped out by about $4k of value loss. Plan a longer hold.
- Dyer County population projected at -13% by 2050 — secular population decline; favor cash flow + early exit over multi-decade hold.
Negotiation context
- It's been on market 34 days — a 3% lower offer ($131k) is reasonable based on typical stale-listing flexibility.
Risks & watch-outs
- Climate carrying-cost: extreme-heat days projected 7→20/yr by 2055 (HVAC capex compounding) — expect insurance premiums to compound above CPI over the hold.
Questions for the listing agent
- It's been on market 34 days. Have you received any prior offers? Is the seller open to a 7% concession, seller financing, or rate buy-down credit?
- Built in 1979 — when were the roof, HVAC, electrical panel, plumbing, and water heater last replaced?
- Is there a deadline driving the sale (1031 exchange, divorce, estate, relocation)? That informs how much negotiation room exists.
- Schools are D-rated, which usually means shorter tenancies and higher turnover. Who's the typical renter profile here, and what's been the actual vacancy rate?
- Crime grade is F in this area — have there been break-ins, vandalism, or insurance claims at this property in the last 3 years? What carrier currently insures it and at what premium?
- What's the average days-on-market for RENTAL listings here right now (not sales)? A rising rental-DOM trend means longer vacancies and softer asking-rent achievability than the comps imply.
- What's the recent tenant-quality profile in this submarket — average credit score on applications, eviction rate, late-payment / NSF rate, and stable-employment percentage? A property-management company in the area should have these aggregated.
- How much new for-sale + rental construction is in the pipeline within 1–3 miles? Heavy new supply typically softens prices + rents 12–24 months out; constrained supply supports both.
Investment metrics
- 1% rule
- 0.93% ✗
- Cap rate
- 7.85%
- Cash-on-cash
- 5.56%
- DSCR
- 1.25
- GRM
- 9.0
CMA / ARV
- ARV (on-the-fly)
- $210,675
- Comps found
- 3
Show comp detail 3 sales within ~0.75 mi
| Address | Dist | Beds/Ba | Sqft | Sold | Price | $/sf | Match |
|---|---|---|---|---|---|---|---|
| 166 Jo Cir | 0.13mi | 3/2.0 | 1,340 (+1%) | 20mo | $214,500 | $160 | 71 |
| 618 Drew Rd | 0.06mi | 3/1.0 | 1,151 (-13%) | 14mo | $145,000 | $126 | 63 |
| 265 Jo Cir | 0.05mi | 3/1.5 | 1,164 (-12%) | 19mo | $185,000 | $159 | 59 |
Match score weights: distance 35% · size 25% · config 20% · recency 20%. Top-matched comps best support the ARV.
Projected returns pro-forma
-3.0% appreciation · 3.0% rent growth · sell at horizon
- IRR
- -7.7%
- Equity multiple
- 0.71×
- Total profit
- $-10,783
- Equity at exit
- $20,129
- IRR
- 1.8%
- Equity multiple
- 1.13×
- Total profit
- $4,750
- Equity at exit
- $11,672
Cash invested: $37,800 (down + closing). Projections, not guarantees.
Landlord ↔ Tenant lean methodology
- Overall (STATE)
- 87 Strongly Landlord-Friendly
- State Tennessee
- 87 Strongly Landlord-Friendly · R+13
- County
- — inherits STATE
- City
- — inherits STATE
ZIP-level market 38024
- Home prices YoY
- -28.5%
- Active inventory
- 66
- Price-to-rent
- 9.0×
Monthly cashflow live
- Estimated rent
- $1,256 medium interval (Pro) →
- Mortgage (P&I)
- −$708
- Tax from tax record
- −$53 /mo · $640/yr
- Insurance
- −$56
- HOA
- −$0
- Vacancy / Maint / Mgmt
- −$264
- Net cashflow
- $175
Break-even live
UW: 25.0% down · 7.5% · 30yr · 1.5% tax · 5.0% vac · 8.0% maint · 8.0% mgmt
Financing live
Cash to close
- Down payment
- $33,750
- Closing costs
- $4,050
- Reserves months
- —
- Total cash needed
- —
Loan-product check · same deal, 3 products live
Conventional
25% down · 7.5% · 30yr
- Down + closing
- —
- Monthly P&I
- —
- Monthly cashflow
- —
- DSCR
- —
- Eligible?
- —
Personal DTI + credit; lowest rate.
DSCR
20% down · 8.5% · 30yr
- Down + closing
- —
- Monthly P&I
- —
- Monthly cashflow
- —
- DSCR
- —
- Eligible?
- —
No personal income docs; deal must DSCR.
Hard money
10% down · 12.0% · 12mo
- Down + closing
- —
- Monthly P&I
- —
- Monthly cashflow
- —
- DSCR
- —
- Eligible?
- —
Short-term bridge; refi at stabilization.
Listing history 17 events
-
2026-06-19days on market $135,000 Active 34 DOM
-
2026-06-18days on market $135,000 Active 33 DOM
-
2026-06-17days on market $135,000 Active 32 DOM
-
2026-06-16days on market $135,000 Active 31 DOM
-
2026-06-15days on market $135,000 Active 30 DOM
-
2026-06-14pricedays on market $135,000 Active 28 DOM
-
2026-06-12days on market $149,900 Active 27 DOM
-
2026-06-09days on market $149,900 Active 24 DOM
-
2026-06-08days on market $149,900 Active 23 DOM
-
2026-06-07days on market $149,900 Active 22 DOM
-
2026-06-07days on market $149,900 Active 21 DOM
-
2026-06-03days on market $149,900 Active 18 DOM
-
2026-06-02days on market $149,900 Active 17 DOM
-
2026-06-01days on market $149,900 Active 16 DOM
-
2026-05-31days on market $149,900 Active 15 DOM
-
2026-05-30days on market $149,900 Active 14 DOM
-
2026-05-16$149,900 Active
ⓘ Source: listings_history table (triggers on properties + properties_extension) + one-shot
backfill from property_details.listing_events for pre-trigger history.
Tax reassessment forecast TN · Resets to sale price
- Current annual tax
- $640 · $53/mo
- Projected year-2 tax
- $958 · $80/mo
- Expected delta
- +$318/yr (+$27/mo · 49.8%)
ⓘ Screening estimate from a state-policy table — verify with the county assessor before closing.
Climate risk First Street
- Flood 1/10 Low FEMA zone X (unshaded) · 0% chance over 30 yrs
- Wildfire 1/10 Low
- Heat 5/10 Major 7 d/yr ≥107°F today · 20 d/yr by 30 yrs out
- Wind 4/10 Moderate 13% chance of damaging wind over 30 yrs
- Air quality 2/10 Low 0 unhealthy d/yr today · 1 by 30 yrs out
Nearby sold comps map
Loading sold comps map…
Walkable amenities ~0.75 mi
Loading nearby amenities…
Taxation est. · year 1
- Rental income
- $15,076
- − Mortgage interest
- −$7,562
- − Property taxes
- −$640
- − Insurance
- −$675
- − Repairs & maintenance
- −$1,206
- − Management
- −$1,206
- − Depreciation
- −$3,927
- Taxable loss
- −$140
- Est. tax savings @ 24.0%
- +$34
- After-tax cash flow
- $2,133/yr
For passive investors: Depreciation is non-cash, so a rental often shows a tax loss while cash-flowing — sheltering income. Rental losses are passive: they offset passive income freely, and up to $25,000/yr can offset ordinary (W-2) income if you actively participate and your MAGI is under $100k (phasing out to $0 by $150k); unused losses carry forward. On sale, claimed depreciation is recaptured at up to 25%, and gains may owe capital-gains tax (a 1031 exchange can defer both). Figures are a year-1 estimate at your 24.0% rate — not tax advice; consult a CPA.
Schools (NCES district)
- District
- Dyer County
- NCES district ID
- 4701050
- Math proficiency
- 40% ▼ -14.00%
- Reading proficiency
- 38% ▼ -1.00%
- Median HH income
- $44,865
- Composite
- 33.19/100
- National rank
- #5536
- State rank
- #16 of 139 in TN
Livability — Dyersburg
- Score
- 64/100
- State rank
- #177
- US rank
- #14658
Category grades
Schools grade is shown separately in the Schools card above.
Census & demographics
- County
- Dyer County · 25,952 people
- City population
- 25,952
- Metro
- Dyersburg, TN
- Population (ZIP)
- 25,952
- Household income
- $57,061
- Rent vs Own
- Severe rent burden
- 939.0
Population outlook (Dyer County) Hauer SSP2
- Today (2025)
- 36,770 people
- By 2030
- 35,863 · -2.5%
- By 2040
- 33,989 · -7.6%
- By 2050
- 32,124 · -12.6%
- By 2075
- 28,702 · -21.9%
- By 2100
- 25,745 · -30.0%
Race, ethnicity, and origin ACS 2023
- Neighborhood character
- Predominantly White (74%)
- Race & ethnicity
- White 74% Black 19% Two or more races 4% Hispanic / Latino 3%
- Common ancestry
- Italian 2% Romanian 2% Serbian 2%
- Foreign-born
- 2% · Canada
- Languages at home
- 97% English-only · Spanish 2%
Political lean MEDSL · Dyer
- 2024 margin
- Solid R (+61.8) · D 18.8% · R 80.6%
- 2008→2024 swing
- -24.1pp toward R · 2008: -37.7pp · 2024: -61.8pp
- All cycles
- 2024: R+61.8 2020: R+57.1 2016: R+55.4 2012: R+44.7 2008: R+37.7
Not yet ingested
- Civics
- —
Market trends
- HPI YoY
- ▼ -64.52%
- Current HPI
- 162.1695
- Rent YoY
- —
- Metro
- Dyersburg, TN
- State GDP YoY
- ▲ 2.78%
- F500 in state
- 22
Industry mix (Fortune 500 HQ in TN)
| Industry | F500 HQs | Revenue |
|---|---|---|
| Healthcare | 3 | $91B |
|
||
| Retail | 3 | $72B |
|
||
| Transportation / Logistics | 1 | $88B |
|
||
| Paper / Packaging | 1 | $19B |
|
||
| Insurance | 1 | $13B |
|
||
| Energy | 1 | $12B |
|
||
Price history
1 event — show timeline
- 2026-05-16 Listed $149,900 CWTAR
Property tax history
+4.2%/yrLatest (2025): $640 · +17.0% YoY. Source: county tax records.
Cash-flow waterfall
monthlySold comps — $/sqft
last 12 mo · ≤1 miLoading sold comps…