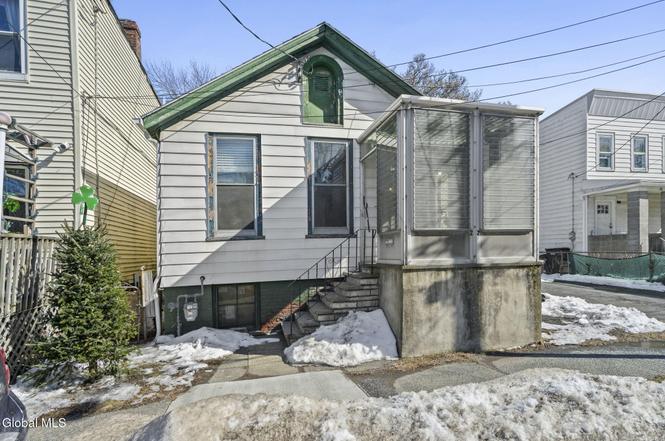
22 Orr St · Troy, NY
Flood risk 5/10 · Moderate
- FEMA flood zone
- X
- Chance of flooding over 30 yrs
- 0.38%
- Est. flood insurance / yr
- $473 – $860
Fire risk 3/10 · Minor
- Est. fire insurance / yr
- $691 – $1,283
Heat risk 4/10 · Minor
- Hot days now (above 95°F)
- 7 days/yr
- Hot days in 30 yrs
- 17 days/yr
Wind risk 3/10 · Minor
- Chance of severe wind over 30 yrs
- 6.0%
Air-quality risk 2/10 · Minimal
- Unhealthy air days now
- 0 days/yr
- Unhealthy air days in 30 yrs
- 1 days/yr
Risk factors via First Street. Map © Google.
Why this score? — see what drove the B+ grade
The composite is a weighted blend of 9 inputs, each scored 0–100. Each bar is that input's sub-score; the figure is the points it added to the 100-point composite (weight × sub-score).
- Cash flow +30.0/30.0
- ARV discount +15.0/15.0
- 1% rule +10.0/10.0
- DSCR +10.0/10.0
- Livability +4.0/5.0
- Schools +3.8/10.0
- Rent growth +3.7/5.0
- Condition / age +2.5/5.0
- Appreciation +0.0/10.0
$99,000
🖨 Deal sheet 📄 Offer letter ✓ Due diligence
Listing remarks
Welcome to 22 Orr Street -- a single-level bungalow set on an oversized . 16-acre lot in the City of Troy, offering flexibility, functionality, and serious upside. Previously configured as a 3-bedroom, 1-bath home with a formal dining room, this property features a layout that works for today while presenting exciting possibilities for tomorrow. The listing photos include both the current floor plan and a sample reimagined layout, illustrating just one of many ways an investor or owner could unlock additional value. Whether you maintain the existing footprint or pursue a thoughtful redesign, the potential here is undeniable. Originally comprised of three separate parcels that have since bee
Key facts
- Oversized lot
- Off-street parking
- 6,969 sq ft lot
Tags
Neighborhood map
What this means for you Summary
Snapshot
- This is a 3-bed/1.0-bath single-family listed at $99k.
Deal economics
- At list price, monthly cash flow is $402 ($5k/yr) — positive.
- The deal already cash-flows at list — no discount required.
- Meets the 1% rule at list price ($2k rent vs $99k).
- Cap rate 11.2% vs local median 5.3% in Troy — top-decile yield for the area; either an underpriced asset or a hidden risk that comps aren't pricing in. Stress-test before assuming the spread holds.
Location & tenants
- Location reads 81/100 on livability (#88 in NY, #1,350 nationally) — a professional / high-income tenant draw. Strengths: amenities A+, commute A+, housing A+; Watch: schools C-, employment C-, crime F.
- Troy City School District (urban): math 44% / reading 46% proficiency, ranked #467 of 590 in NY (top 79%) — families likely to look elsewhere, expect single-tenant / working-renter base with shorter leases; 62% free/reduced lunch — lower-income household profile, screen leases tightly.
- Market conditions: Rents rising fast (+4.9%/yr); 220 active listings in the ZIP; 23 comparable units currently listed for rent nearby; rentals at typical pace (median 14d on market — plan ~3-4 weeks tenant-placement turnaround); solid renter incomes; 405 units permitted in Rensselaer County in 2024 (224 in 5+ unit buildings).
Forward outlook
- Local home prices are declining (-3.0%/yr); year-one equity from $684 of loan paydown is wiped out by about $3k of value loss. Plan a longer hold.
- Rensselaer County population projected to shrink 6% by 2050 — rents likely to lag national; underwrite the cash flow, not the appreciation.
- At projected returns (-3.0% appreciation + 4.9% rent growth), your $28k cash investment doubles in ~7 years — after that, you're playing with house money.
Negotiation context
- Only 11 days on market — expect competitive offers; lowballing is unlikely to land.
- 2 sale attempts with the ask held roughly flat each time — persistent listings suggest the price (not the market) is what's stuck; bring a comps-based counter.
Risks & watch-outs
- Watch-outs: property tax is 3.3% of price; built in 1910 — expect roof / HVAC / electrical / plumbing capex.
- Climate carrying-cost: moderate flood risk — expect insurance premiums to compound above CPI over the hold.
Questions for the listing agent
- Built in 1910 — when were the roof, HVAC, electrical panel, plumbing, and water heater last replaced?
- Property tax is high relative to price — has the assessment been appealed recently, and will the sale trigger a re-assessment?
- Is there a deadline driving the sale (1031 exchange, divorce, estate, relocation)? That informs how much negotiation room exists.
- Crime grade is F in this area — have there been break-ins, vandalism, or insurance claims at this property in the last 3 years? What carrier currently insures it and at what premium?
- What's the average days-on-market for RENTAL listings here right now (not sales)? A rising rental-DOM trend means longer vacancies and softer asking-rent achievability than the comps imply.
- What's the recent tenant-quality profile in this submarket — average credit score on applications, eviction rate, late-payment / NSF rate, and stable-employment percentage? A property-management company in the area should have these aggregated.
- How much new for-sale + rental construction is in the pipeline within 1–3 miles? Heavy new supply typically softens prices + rents 12–24 months out; constrained supply supports both.
Investment metrics
- 1% rule
- 1.58% ✓
- Cap rate
- 11.16%
- Cash-on-cash
- 17.38%
- DSCR
- 1.77
- GRM
- 5.3
CMA / ARV
- ARV (on-the-fly)
- $160,720
- Comps found
- 7
Show comp detail 7 sales within ~0.75 mi
| Address | Dist | Beds/Ba | Sqft | Sold | Price | $/sf | Match |
|---|---|---|---|---|---|---|---|
| 372 9th St | 0.25mi | 3/1.0 | 1,038 (+6%) | 5mo | $170,000 | $164 | 75 |
| 429 10th St | 0.31mi | 4/1.0 (+1) | 912 (-7%) | 8mo | $124,000 | $136 | 62 |
| 60 Oakwood Ave | 0.37mi | 2/1.5 (-1) | 1,042 (+6%) | 20mo | $195,000 | $187 | 49 |
| 24 Summit Ave | 0.22mi | 2/1.0 (-1) | 1,116 (+14%) | 17mo | $225,000 | $202 | 48 |
| 1 Center St | 0.69mi | 3/2.0 | 1,100 (+12%) | 2mo | $84,000 | $76 | 42 |
| 154 George St | 0.61mi | 3/1.0 | 1,107 (+13%) | 13mo | $145,000 | $131 | 39 |
| 22 Centerview Dr | 0.73mi | 3/1.0 | 1,092 (+11%) | 23mo | $280,000 | $256 | 28 |
Match score weights: distance 35% · size 25% · config 20% · recency 20%. Top-matched comps best support the ARV.
Projected returns pro-forma
-3.0% appreciation · 4.88% rent growth · sell at horizon
- IRR
- 11.2%
- Equity multiple
- 1.46×
- Total profit
- $12,659
- Equity at exit
- $14,761
- IRR
- 21.9%
- Equity multiple
- 3.07×
- Total profit
- $57,268
- Equity at exit
- $8,560
Cash invested: $27,720 (down + closing). Projections, not guarantees.
Landlord ↔ Tenant lean methodology
- Overall (STATE)
- 15 Strongly Tenant-Friendly
- State New York
- 15 Strongly Tenant-Friendly · D+10
- County
- — inherits STATE
- City
- — inherits STATE
ZIP-level market 12180
- Home prices YoY
- -33.3%
- Rents YoY
- 4.9%
- Active inventory
- 220
- Price-to-rent
- 5.3×
Monthly cashflow live
- Estimated rent
- $1,563 high interval (Pro) →
- Mortgage (P&I)
- −$519
- Tax from tax record
- −$273 /mo · $3,276/yr
- Insurance
- −$41
- HOA
- −$0
- Vacancy / Maint / Mgmt
- −$328
- Net cashflow
- $402
Break-even live
UW: 25.0% down · 7.5% · 30yr · 1.5% tax · 5.0% vac · 8.0% maint · 8.0% mgmt
Financing live
Cash to close
- Down payment
- $24,750
- Closing costs
- $2,970
- Reserves months
- —
- Total cash needed
- —
Loan-product check · same deal, 3 products live
Conventional
25% down · 7.5% · 30yr
- Down + closing
- —
- Monthly P&I
- —
- Monthly cashflow
- —
- DSCR
- —
- Eligible?
- —
Personal DTI + credit; lowest rate.
DSCR
20% down · 8.5% · 30yr
- Down + closing
- —
- Monthly P&I
- —
- Monthly cashflow
- —
- DSCR
- —
- Eligible?
- —
No personal income docs; deal must DSCR.
Hard money
10% down · 12.0% · 12mo
- Down + closing
- —
- Monthly P&I
- —
- Monthly cashflow
- —
- DSCR
- —
- Eligible?
- —
Short-term bridge; refi at stabilization.
Rent comps 23 comps
| Address | Beds | Baths | Sqft | Rent | $/sqft | DOM | Units | Dist |
|---|---|---|---|---|---|---|---|---|
| 3132-3134 6th Ave Troy, NY | 2.0 | 1.0 | 950 | $1,300 | $1.37 | 23d | 1 | 0.12mi |
| 3132-3134 6th Ave Troy, NY | 3.0 | 1.0 | 950 | $1,350 | $1.42 | 14d | 1 | 0.12mi |
| 3134 6th Ave Troy, NY | 2.0 | 1.0 | 950 | $1,280 | $1.35 | 14d | 1 | 0.12mi |
| 40 102nd St Apt 6 Troy, NY | 2.0 | 1.0 | 1000 | $1,200 | $1.20 | 23d | 1 | 0.56mi |
| 159 Hoosick St Unit 1R Troy, NY | 2.0 | 1.0 | 1050 | $795 | $0.76 | 19d | 1 | 0.63mi |
| 169 Hutton St Unit 2 Troy, NY | 2.0 | 1.0 | 1000 | $795 | $0.80 | 14d | 1 | 0.76mi |
| 2420 21st St Troy, NY | 1.0–2.0 | 1.0 | 775 | $1,410 | $1.82 | 19d | 1 | 0.78mi |
| 50 Paine St Unit Second floor Green Island, NY | 2.0 | 1.0 | 800 | $1,200 | $1.50 | 43d | 1 | 0.87mi |
| 2209 15th St Troy, NY | 3.0 | 1.0 | 950 | $2,595 | $2.73 | 23d | 1 | 0.94mi |
| 3 25th St Troy, NY | 1.0–2.0 | 1.0 | 805 | $1,555 | $1.93 | 14d | 1 | 1.00mi |
| 2002 Federal St Troy, NY | 2.0 | 1.0–2.0 | 830 | $3,450 | $4.16 | 14d | 51 | 1.01mi |
| 2001 5th Ave Troy, NY | 2.0 | 1.0–2.0 | 865 | $2,650 | $3.06 | 14d | 10 | 1.04mi |
| 5 Alden St Unit b Watervliet, NY | 2.0 | 1.0 | 1100 | $1,299 | $1.18 | 43d | 1 | 1.22mi |
| 5 Alden St Watervliet, NY | 2.0 | 1.0 | 1000 | $1,299 | $1.30 | 19d | 1 | 1.22mi |
| 386 3rd Ave #1 Troy, NY | 3.0 | 1.0 | 1024 | $1,700 | $1.66 | 14d | 1 | 1.34mi |
| 104 4th St Unit 2 Troy, NY | 3.0 | 1.0 | 950 | $1,800 | $1.89 | 14d | 1 | 1.36mi |
| 17 State St Troy, NY | 4.0 | 1.0–1.5 | 1810 | $2,996 | $1.66 | 14d | 7 | 1.36mi |
| 415 7th Ave Unit 2 Troy, NY | 3.0 | 1.0 | 850 | $1,675 | $1.97 | 14d | 1 | 1.38mi |
| 1611 6th Ave Troy, NY | 1.0–2.0 | 1.0–2.0 | 976 | $3,000 | $3.07 | 14d | 28 | 1.38mi |
| 1520 6th Ave Troy, NY | 2.0–4.0 | 2.0–4.0 | 1209 | $1,224 | $1.01 | 23d | 8 | 1.44mi |
| 151 4th St Troy, NY | 4.0 | 1.0 | 1000 | $1,400 | $1.40 | 23d | 1 | 1.48mi |
| 155 River St Unit 5D Troy, NY | 2.0 | 1.0 | 900 | $2,000 | $2.22 | 43d | 1 | 1.48mi |
| 155 River St Unit 3C Troy, NY | 2.0 | 1.0 | 1100 | $2,000 | $1.82 | 14d | 1 | 1.48mi |
Listing history 2 events
-
2026-06-16remarks 699-char remark
-
2026-06-16$99,000 Pending 11 DOM
ⓘ Source: listings_history table (triggers on properties + properties_extension) + one-shot
backfill from property_details.listing_events for pre-trigger history.
Tax reassessment forecast NY · Partial reset (capped growth)
- Current annual tax
- $3,276 · $273/mo
- Projected year-2 tax
- $3,276 · $273/mo
- Expected delta
- $0/yr ($0/mo · 0.0%)
ⓘ Screening estimate from a state-policy table — verify with the county assessor before closing.
Climate risk First Street
- Flood 5/10 Major FEMA zone X · 38% chance over 30 yrs
- Wildfire 3/10 Moderate
- Heat 4/10 Moderate 7 d/yr ≥95°F today · 17 d/yr by 30 yrs out
- Wind 3/10 Moderate 6% chance of damaging wind over 30 yrs
- Air quality 2/10 Low 0 unhealthy d/yr today · 1 by 30 yrs out
Nearby sold comps map
Loading sold comps map…
Walkable amenities ~0.75 mi
Loading nearby amenities…
Taxation est. · year 1
- Rental income
- $18,758
- − Mortgage interest
- −$5,546
- − Property taxes
- −$3,276
- − Insurance
- −$495
- − Repairs & maintenance
- −$1,501
- − Management
- −$1,501
- − Depreciation
- −$2,880
- Taxable income
- $3,561
- Est. tax owed @ 24.0%
- −$855
- After-tax cash flow
- $3,964/yr
For passive investors: Depreciation is non-cash, so a rental often shows a tax loss while cash-flowing — sheltering income. Rental losses are passive: they offset passive income freely, and up to $25,000/yr can offset ordinary (W-2) income if you actively participate and your MAGI is under $100k (phasing out to $0 by $150k); unused losses carry forward. On sale, claimed depreciation is recaptured at up to 25%, and gains may owe capital-gains tax (a 1031 exchange can defer both). Figures are a year-1 estimate at your 24.0% rate — not tax advice; consult a CPA.
Schools (NCES district)
- District
- Troy City School District
- NCES district ID
- 3628950
- Math proficiency
- 44% ▲ 6.00%
- Reading proficiency
- 46% ▲ 6.00%
- Median HH income
- $42,143
- Composite
- 37.89/100
- National rank
- #4318
- State rank
- #467 of 590 in NY
Livability — Troy
- Score
- 81/100
- State rank
- #88
- US rank
- #1350
Category grades
Schools grade is shown separately in the Schools card above.
Census & demographics
- Census place
- Troy, NY
- County
- Rensselaer County · 75,590 people
- City population
- 53,479
- Metro
- Albany-Schenectady-Troy, NY
- Population (ZIP)
- 53,479
- Household income
- $75,851
- Rent vs Own
- Severe rent burden
- 2698.0
Population outlook (Rensselaer County) Hauer SSP2
- Today (2025)
- 162,400 people
- By 2030
- 161,746 · -0.4%
- By 2040
- 158,095 · -2.7%
- By 2050
- 152,966 · -5.8%
- By 2075
- 140,767 · -13.3%
- By 2100
- 124,727 · -23.2%
Race, ethnicity, and origin ACS 2023
- Neighborhood character
- Predominantly White (70%)
- Race & ethnicity
- White 70% Black 12% Hispanic / Latino 8% Two or more races 8% Asian 5%
- Hispanic origin (detail)
- Mexican 1% Puerto Rican 4%
- Common ancestry
- Romanian 5% Lithuanian 5% Slovak 1%
- Foreign-born
- 10% · Canada, China
- Languages at home
- 88% English-only · Spanish 4% Other Indo-European 2% Arabic 2%
Political lean MEDSL · Rensselaer
- 2024 margin
- Toss-up / Even · D 50.7% · R 49.3%
- 2008→2024 swing
- -8.0pp toward R · 2008: 9.3pp · 2024: 1.4pp
- All cycles
- 2024: D+1.4 2020: D+5.6 2016: R+2.9 2012: D+11.8 2008: D+9.3
Not yet ingested
- Civics
- —
Market trends
- HPI YoY
- ▼ -142.53%
- Current HPI
- 285.0762
- Rent YoY
- ▲ 4.88%
- Metro
- Albany-Schenectady-Troy, NY
- State GDP YoY
- ▲ 2.60%
- F500 in state
- 92
Industry mix (Fortune 500 HQ in NY)
| Industry | F500 HQs | Revenue |
|---|---|---|
| Financial Services | 10 | $950B |
|
||
| Consumer Goods | 9 | $162B |
|
||
| Insurance | 4 | $225B |
|
||
| Telecommunications | 2 | $144B |
|
||
| Pharmaceuticals | 2 | $112B |
|
||
| Media / Entertainment | 2 | $69B |
|
||
Price history
-40.0% since first listed5 events — show timeline
- 2026-03-22 Pending — Global MLS
- 2026-03-12 Listed $99,000 Global MLS
- 2025-08-07 Listing Removed — Global MLS
- 2025-07-02 Price Changed $140,000 Global MLS
- 2025-04-11 Listed $165,000 Global MLS
Property tax history
+16.4%/yrLatest (2025): $3,276 · -5.2% YoY. Source: county tax records.
Cash-flow waterfall
monthlySold comps — $/sqft
last 12 mo · ≤1 miLoading sold comps…