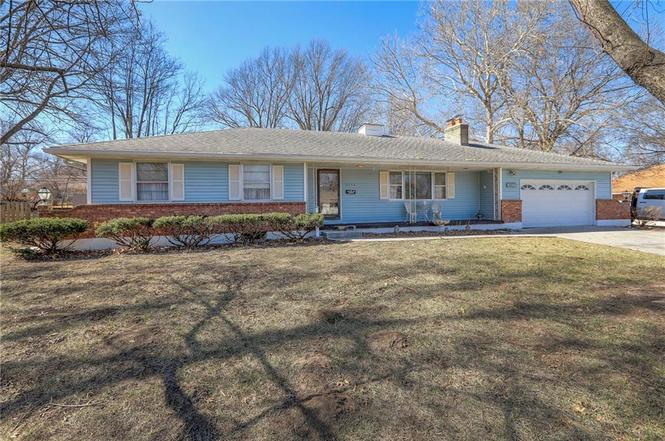
8428 James A Reed Rd · Raytown, MO
Flood risk 1/10 · Minimal
- FEMA flood zone
- X (unshaded)
- Chance of flooding over 30 yrs
- 0.0%
- Est. flood insurance / yr
- $473 – $860
Fire risk 1/10 · Minimal
- Est. fire insurance / yr
- $1,054 – $1,958
Heat risk 4/10 · Minor
- Hot days now (above 106°F)
- 7 days/yr
- Hot days in 30 yrs
- 16 days/yr
Wind risk 2/10 · Minimal
- Chance of severe wind over 30 yrs
- —
Air-quality risk 3/10 · Minor
- Unhealthy air days now
- 3 days/yr
- Unhealthy air days in 30 yrs
- 5 days/yr
Risk factors via First Street. Map © Google.
Why this score? — see what drove the B grade
The composite is a weighted blend of 9 inputs, each scored 0–100. Each bar is that input's sub-score; the figure is the points it added to the 100-point composite (weight × sub-score).
- Cash flow +27.7/30.0
- ARV discount +15.0/15.0
- DSCR +9.8/10.0
- 1% rule +8.4/10.0
- Rent growth +3.3/5.0
- Livability +3.2/5.0
- Condition / age +2.5/5.0
- Schools +1.8/10.0
- Appreciation +0.0/10.0
$115,000
🖨 Deal sheet (PDF) 📄 Offer letter ✓ Due diligence
Listing remarks
This is a must-see real estate auction opportunity where motivated bidding can truly pay off. This property presents an exceptional opportunity to bid, compete, and win at auction. Situated on a generous 0.43-acre lot with a large, fenced backyard in the established Blue Ridge Ranch Estates, this single-owner ranch-style home delivers easy, single-level living with excellent accessibility throughout Raytown and quick connections to I-435 and beyond. Just minutes from major corridors, shopping, dining, and key Kansas City areas, the location combines convenient suburban appeal with straightforward commuting. The functional ranch layout keeps primary living spaces all on one level for effortl
Key facts
- 0.43 acre lot
- 2 garage spots
- Listed 35 days
Neighborhood map
What this means for you Summary
Snapshot
- This is a 3-bed/1.5-bath single-family listed at $115k.
Deal economics
- At list price, monthly cash flow is $349 ($4k/yr) — positive.
- The deal already cash-flows at list — no discount required.
- Meets the 1% rule at list price ($2k rent vs $115k).
- Recommended offer: $112k (3.0% below list) — sets the bar for market timing.
- Cap rate 9.9% vs local median 5.0% in Raytown — top-decile yield for the area; either an underpriced asset or a hidden risk that comps aren't pricing in. Stress-test before assuming the spread holds.
Location & tenants
- Location reads 65/100 on livability (#281 in MO) — a middle-class / working-renter tenant base. Strengths: cost of living A+, housing A+, health & safety B+; Watch: crime F, amenities F, commute F.
- Raytown C-2 (suburban): math 12% / reading 28% proficiency, ranked #302 of 324 in MO (top 93%) — low school quality limits family demand, transient renter base, plan for 1-2y turnover.
- Zoned schools: Spring Valley Elem. (math 2% / reading 17%, grade F, #1,037 of 1,115 statewide, top 94%, 380 students, 74% FRL); South Middle (math 6% / reading 25%, grade F, #359 of 391 statewide, top 92%, 522 students, 73% FRL); Raytown South Sr. High (math 8% / reading 32%, grade F, #475 of 521 statewide, top 92%, 1,185 students, 68% FRL) — zoned schools average 72% FRL vs 54% district-wide (18 pts higher); higher-poverty schools than district average — tighter screening recommended.
- Market conditions: Rents rising (+3.1%/yr); 140 active listings in the ZIP; 37 comparable units currently listed for rent nearby; rentals at typical pace (median 20d on market — plan ~3-4 weeks tenant-placement turnaround); 4,002 units permitted in Jackson County in 2024 (2,271 in 5+ unit buildings).
- This rent runs 32% of the median local income ($59k/yr) — at the standard rent-burdened threshold; future hikes will face affordability resistance.
Forward outlook
- Local home prices are declining (-3.0%/yr); year-one equity from $795 of loan paydown is wiped out by about $3k of value loss. Plan a longer hold.
- Jackson County population projected at +4% by 2050 — modest demand growth; plan on rents tracking national, not racing it.
- At projected returns (-3.0% appreciation + 3.1% rent growth), your $32k cash investment doubles in ~9 years — after that, you're playing with house money.
Negotiation context
- It's been on market 35 days — a 3% lower offer ($112k) is reasonable based on typical stale-listing flexibility.
Questions for the listing agent
- It's been on market 35 days. Have you received any prior offers? Is the seller open to a 3% concession, seller financing, or rate buy-down credit?
- Built in 1960 — when were the roof, HVAC, electrical panel, plumbing, and water heater last replaced?
- Is there a deadline driving the sale (1031 exchange, divorce, estate, relocation)? That informs how much negotiation room exists.
- Schools are D-rated, which usually means shorter tenancies and higher turnover. Who's the typical renter profile here, and what's been the actual vacancy rate?
- Crime grade is F in this area — have there been break-ins, vandalism, or insurance claims at this property in the last 3 years? What carrier currently insures it and at what premium?
- What's the average days-on-market for RENTAL listings here right now (not sales)? A rising rental-DOM trend means longer vacancies and softer asking-rent achievability than the comps imply.
- What's the recent tenant-quality profile in this submarket — average credit score on applications, eviction rate, late-payment / NSF rate, and stable-employment percentage? A property-management company in the area should have these aggregated.
- How much new for-sale + rental construction is in the pipeline within 1–3 miles? Heavy new supply typically softens prices + rents 12–24 months out; constrained supply supports both.
Investment metrics
- 1% rule
- 1.34% ✓
- Cap rate
- 9.93%
- Cash-on-cash
- 13.00%
- DSCR
- 1.58
- GRM
- 6.2
CMA / ARV
- ARV (on-the-fly)
- $195,708
- Comps found
- 12
Show comp detail 12 sales within ~0.75 mi
| Address | Dist | Beds/Ba | Sqft | Sold | Price | $/sf | Match |
|---|---|---|---|---|---|---|---|
| 8428 James A Reed Rd | 0.00mi | 3/2.5 | 1,388 (0%) | 0mo | $115,000 | $83 | 96 |
| 8608 E 84th Ter | 0.35mi | 3/2.0 | 1,342 (-3%) | 4mo | $189,000 | $141 | 73 |
| 8512 Greenwood Rd | 0.10mi | 3/2.0 | 1,520 (+10%) | 10mo | $250,000 | $164 | 69 |
| 8818 James A Reed Rd | 0.46mi | 3/1.5 | 1,421 (+2%) | 8mo | $180,000 | $127 | 68 |
| 9004 Manchester Ave | 0.66mi | 3/1.5 | 1,400 (+1%) | 2mo | $175,000 | $125 | 66 |
| 8608 Spring Valley Rd | 0.51mi | 3/2.0 | 1,301 (-6%) | 3mo | $200,000 | $154 | 62 |
| 7804 E 90th Ter | 0.71mi | 3/2.0 | 1,440 (+4%) | 10mo | $199,900 | $139 | 51 |
| 8301 Spring Valley Rd | 0.56mi | 3/1.0 | 1,251 (-10%) | 10mo | $210,000 | $168 | 47 |
| 7224 E 84th St | 0.56mi | 2/2.5 (-1) | 1,476 (+6%) | 10mo | $237,500 | $161 | 46 |
| 8007 Blue Ridge Blvd | 0.61mi | 4/2.5 (+1) | 1,592 (+15%) | 1mo | $274,000 | $172 | 37 |
| 7000 E 86th St | 0.72mi | 4/2.0 (+1) | 1,220 (-12%) | 4mo | $109,900 | $90 | 36 |
| 7901 E 90th Ter | 0.73mi | 3/2.0 | 1,560 (+12%) | 10mo | $139,900 | $90 | 35 |
Match score weights: distance 35% · size 25% · config 20% · recency 20%. Top-matched comps best support the ARV.
Projected returns pro-forma
-3.0% appreciation · 3.07% rent growth · sell at horizon
- IRR
- 3.0%
- Equity multiple
- 1.12×
- Total profit
- $3,753
- Equity at exit
- $17,147
- IRR
- 12.7%
- Equity multiple
- 2.01×
- Total profit
- $32,596
- Equity at exit
- $9,943
Cash invested: $32,200 (down + closing). Projections, not guarantees.
Landlord ↔ Tenant lean methodology
- Overall (STATE)
- 81 Strongly Landlord-Friendly
- State Missouri
- 81 Strongly Landlord-Friendly · R+10
- County
- — inherits STATE
- City
- — inherits STATE
ZIP-level market 64138
- Rents YoY
- 3.1%
- Active inventory
- 140
- Price-to-rent
- 6.2×
Monthly cashflow live
- Estimated rent
- $1,542 high interval (Pro) →
- Mortgage (P&I)
- −$603
- Tax from tax record
- −$219 /mo · $2,624/yr
- Insurance
- −$48
- HOA
- −$0
- Lot rent
- −$0
- Vacancy / Maint / Mgmt
- −$324
- Net cashflow
- $349
Break-even live
Sensitivity live
| Price | -10% $414 | -5% $381 | +0% $349 | +5% $316 | +10% $284 |
|---|---|---|---|---|---|
| Rent | -10% $227 | -5% $288 | +0% $349 | +5% $410 | +10% $471 |
| Rate | -1.0pp $407 | -0.5pp $378 | base $349 | +0.5pp $319 | +1.0pp $289 |
UW: 25.0% down · 7.5% · 30yr · 1.5% tax · 5.0% vac · 8.0% maint · 8.0% mgmt
Financing live
Cash to close
- Down payment
- $28,750
- Closing costs
- $3,450
- Reserves months
- —
- Total cash needed
- —
Loan-product check · same deal, 3 products live
Conventional
25% down · 7.5% · 30yr
- Down + closing
- —
- Monthly P&I
- —
- Monthly cashflow
- —
- DSCR
- —
- Eligible?
- —
Personal DTI + credit; lowest rate.
DSCR
20% down · 8.5% · 30yr
- Down + closing
- —
- Monthly P&I
- —
- Monthly cashflow
- —
- DSCR
- —
- Eligible?
- —
No personal income docs; deal must DSCR.
Hard money
10% down · 12.0% · 12mo
- Down + closing
- —
- Monthly P&I
- —
- Monthly cashflow
- —
- DSCR
- —
- Eligible?
- —
Short-term bridge; refi at stabilization.
Rent comps 37 comps
| Address | Beds | Baths | Sqft | Rent | $/sqft | DOM | Units | Dist |
|---|---|---|---|---|---|---|---|---|
| 7510 E 85th Ter Kansas City, MO | 1.0–2.0 | 1.0 | 852 | $1,300 | $1.53 | 46d | 1 | 0.26mi |
| 8600 Everett St Raytown, MO | 3.0 | 1.5 | 956 | $1,550 | $1.62 | 46d | 1 | 0.41mi |
| 8002 E 88th Pl Kansas City, MO | 3.0 | 2.0 | 984 | $1,495 | $1.52 | 46d | 1 | 0.45mi |
| 8812 Manchester Ave Kansas City, MO | 3.0 | 1.0 | 1066 | $1,586 | $1.49 | 14d | 1 | 0.49mi |
| 8700 E 87th St Raytown, MO | 3.0 | 2.0 | 1032 | $1,481 | $1.44 | 19d | 1 | 0.52mi |
| 7902 E 89th Ter Kansas City, MO | 3.0 | 1.5 | 1068 | $1,516 | $1.42 | 19d | 1 | 0.57mi |
| 8001 E 89th Ter Kansas City, MO | 3.0 | 2.0 | 1014 | $1,545 | $1.52 | 46d | 1 | 0.58mi |
| 8607 Corrington Ave Kansas City, MO | 4.0 | 2.5 | 1754 | $1,720 | $0.98 | 46d | 1 | 0.61mi |
| 7211 E 87th St Kansas City, MO | 2.0 | 1.0 | 988 | $1,306 | $1.32 | 6d | 1 | 0.62mi |
| 7929 Sycamore Ave Kansas City, MO | 1.0–2.0 | 1.0 | 926 | $1,200 | $1.30 | 0d | 5 | 0.69mi |
| 8951 E 83rd St Raytown, MO | 4.0 | 2.0 | 926 | $1,516 | $1.64 | 26d | 1 | 0.75mi |
| 8620 E Utopia Dr Raytown, MO | 1.0–3.0 | 1.0–2.0 | 854 | $1,249 | $1.46 | 4d | 10 | 0.76mi |
| 7800 E 91st St Kansas City, MO | 3.0 | 3.0 | 1747 | $1,895 | $1.08 | 46d | 1 | 0.79mi |
| 9000 E 85th Pl Raytown, MO | 3.0 | 2.0 | 1580 | $1,375 | $0.87 | 46d | 1 | 0.83mi |
| 8509 E 91st St Kansas City, MO | 3.0 | 1.5 | 1350 | $1,350 | $1.00 | 46d | 1 | 0.85mi |
| 8506 E 91st Ter Kansas City, MO | 3.0 | 1.5 | 1020 | $1,450 | $1.42 | 18d | 1 | 0.88mi |
| 8501 E 92nd St Kansas City, MO | 3.0 | 1.5 | 1107 | $1,745 | $1.58 | 26d | 1 | 0.94mi |
| 9115 E 85 St Unit 9115 Raytown, MO | 2.0 | 1.0 | 892 | $800 | $0.90 | 46d | 1 | 0.95mi |
| 8500 Elm Ave Raytown, MO | 3.0 | 2.0 | 1250 | $1,550 | $1.24 | 46d | 1 | 1.03mi |
| 8921 E 90th Ter Kansas City, MO | 4.0 | 2.5 | 1298 | $1,831 | $1.41 | 26d | 1 | 1.04mi |
| 8713 E 77th Ter Kansas City, MO | 3.0 | 2.0 | 1124 | $1,800 | $1.60 | 46d | 1 | 1.04mi |
| 9302 Fairwood Dr Kansas City, MO | 3.0 | 1.0 | 1526 | $1,585 | $1.04 | 26d | 1 | 1.05mi |
| 9214 Farley Ave Kansas City, MO | 3.0 | 2.0 | 1060 | $1,686 | $1.59 | 14d | 1 | 1.08mi |
| 820 E 93rd Ter Kansas City, MO | 1.0–2.0 | 1.0–2.0 | 1040 | $1,165 | $1.12 | 6d | 1 | 1.11mi |
| 8713 E 92nd Pl Kansas City, MO | 3.0 | 2.0 | 1073 | $1,550 | $1.44 | 46d | 1 | 1.11mi |
| 7917 Ditzler Ave Raytown, MO | 3.0 | 1.0 | 912 | $1,450 | $1.59 | 5d | 1 | 1.20mi |
| 9307 Stark Ave Kansas City, MO | 3.0 | 2.0 | 1073 | $1,385 | $1.29 | 46d | 1 | 1.21mi |
| 7704 E 75th Ter Kansas City, MO | 3.0 | 1.0 | 1016 | $1,325 | $1.30 | 18d | 1 | 1.22mi |
| 9400 E 82nd St Raytown, MO | 3.0 | 2.0 | 1396 | $1,606 | $1.15 | 5d | 1 | 1.22mi |
| 9309 Farley Ave Kansas City, MO | 3.0 | 2.0 | 999 | $1,411 | $1.41 | 6d | 1 | 1.25mi |
| 8806 Crescent Ave Kansas City, MO | 3.0 | 2.5 | 1148 | $1,795 | $1.56 | 6d | 1 | 1.30mi |
| 7905 Elm Ave Raytown, MO | 3.0 | 1.5 | 1104 | $1,700 | $1.54 | 4d | 1 | 1.32mi |
| 7720 Elm Ave Kansas City, MO | 3.0 | 1.5 | 1400 | $1,700 | $1.21 | 46d | 1 | 1.41mi |
| 9444 Newton Ave Kansas City, MO | 1.0–2.0 | 1.0–1.5 | 957 | $1,300 | $1.36 | 4d | 26 | 1.41mi |
| 9444 Newton Ave Unit 9400A Kansas City, MO | 2.0 | 1.0 | 1008 | $1,155 | $1.15 | 19d | 1 | 1.47mi |
| 9444 Newton Ave Unit 9329C Kansas City, MO | 2.0 | 1.5 | 954 | $1,155 | $1.21 | 19d | 1 | 1.47mi |
| 9444 Newton Ave Unit 9446D Kansas City, MO | 2.0 | 1.0 | 882 | $1,025 | $1.16 | 19d | 1 | 1.48mi |
Listing history 4 events
-
2026-04-04status Pending
-
2026-02-27$115,000 Active
-
2026-01-29historical $115,000
-
1976-05-13soldstatus
ⓘ Source: listings_history table (triggers on properties + properties_extension) + one-shot
backfill from property_details.listing_events for pre-trigger history.
Tax reassessment forecast MO · Resets to sale price
- Current annual tax
- $2,624 · $219/mo
- Projected year-2 tax
- $2,624 · $219/mo
- Expected delta
- $0/yr ($0/mo · 0.0%)
ⓘ Screening estimate from a state-policy table — verify with the county assessor before closing.
Climate risk First Street
- Flood 1/10 Low FEMA zone X (unshaded) · 0% chance over 30 yrs
- Wildfire 1/10 Low
- Heat 4/10 Moderate 7 d/yr ≥106°F today · 16 d/yr by 30 yrs out
- Wind 2/10 Low
- Air quality 3/10 Moderate 3 unhealthy d/yr today · 5 by 30 yrs out
Nearby sold comps map
Loading sold comps map…
Walkable amenities ~0.75 mi
Loading nearby amenities…
Taxation est. · year 1
- Rental income
- $18,507
- − Mortgage interest
- −$6,442
- − Property taxes
- −$2,624
- − Insurance
- −$575
- − Repairs & maintenance
- −$1,481
- − Management
- −$1,481
- − Depreciation
- −$3,345
- Taxable income
- $2,560
- Est. tax owed @ 24.0%
- −$614
- After-tax cash flow
- $3,570/yr
For passive investors: Depreciation is non-cash, so a rental often shows a tax loss while cash-flowing — sheltering income. Rental losses are passive: they offset passive income freely, and up to $25,000/yr can offset ordinary (W-2) income if you actively participate and your MAGI is under $100k (phasing out to $0 by $150k); unused losses carry forward. On sale, claimed depreciation is recaptured at up to 25%, and gains may owe capital-gains tax (a 1031 exchange can defer both). Figures are a year-1 estimate at your 24.0% rate — not tax advice; consult a CPA.
Schools (NCES district)
- District
- Raytown C-2
- NCES district ID
- 2926070
- Math proficiency
- 12% ▼ -11.00%
- Reading proficiency
- 28% ▼ -9.00%
- Median HH income
- $47,215
- Composite
- 17.59/100
- National rank
- #9039
- State rank
- #302 of 324 in MO
Livability — Raytown
- Score
- 65/100
- State rank
- #281
- US rank
- #13079
Category grades
Schools grade is shown separately in the Schools card above.
Census & demographics
- Census place
- Raytown, MO
- County
- Jackson County · 687,798 people
- City population
- 60,054
- Metro
- Kansas City, MO-KS
- Population (ZIP)
- 23,805
- Household income
- $58,638
- Rent vs Own
- Severe rent burden
- 810.0
Population outlook (Jackson County) Hauer SSP2
- Today (2025)
- 719,589 people
- By 2030
- 731,456 · +1.6%
- By 2040
- 746,689 · +3.8%
- By 2050
- 749,289 · +4.1%
- By 2075
- 736,227 · +2.3%
- By 2100
- 668,210 · -7.1%
Race, ethnicity, and origin ACS 2023
- Neighborhood character
- Diverse neighborhood (Simpson 0.61)
- Race & ethnicity
- Black 46% White 42% Two or more races 6% Hispanic / Latino 5% Asian 2%
- Common ancestry
- Slovak 2% Ukrainian 1% Italian 1%
- Foreign-born
- 6% · Canada, China
- Languages at home
- 91% English-only · Spanish 4% Arabic 3% Other Indo-European 1%
Political lean MEDSL · Jackson
- 2024 margin
- D (+19.3) · D 58.9% · R 39.5% · Other 1.6%
- 2008→2024 swing
- -6.1pp toward R · 2008: 25.4pp · 2024: 19.3pp
- All cycles
- 2024: D+19.3 2020: D+22.0 2016: D+16.6 2012: D+19.0 2008: D+25.4
Not yet ingested
- Civics
- —
Market trends
- HPI YoY
- ▼ -186.34%
- Current HPI
- 274.681
- Rent YoY
- ▲ 3.07%
- Metro
- Kansas City, MO-KS
- State GDP YoY
- ▲ 1.84%
- F500 in state
- 20
Industry mix (Fortune 500 HQ in MO)
| Industry | F500 HQs | Revenue |
|---|---|---|
| Healthcare | 1 | $163B |
|
||
| Insurance | 1 | $21B |
|
||
| Industrial Technology | 1 | $17B |
|
||
| Retail | 1 | $16B |
|
||
| Industrial Distribution | 1 | $10B |
|
||
| Utilities | 1 | $9B |
|
||
Price history
+0.0% since first listed4 events — show timeline
- 2026-04-04 Pending — Heartland MLS as Distributed by MLS Grid
- 2026-02-27 Listed $115,000 Heartland MLS as Distributed by MLS Grid
- 2026-01-29 Coming Soon $115,000 Heartland MLS as Distributed by MLS Grid
- 1976-05-13 Sold (Public Records) — Public Records
Property tax history
+5.6%/yrLatest (2025): $2,624 · -12.7% YoY. Source: county tax records.
Cash-flow waterfall
monthlySold comps — $/sqft
last 12 mo · ≤1 miLoading sold comps…