95 Haven St · New Haven, CT
Flood risk 6/10 · Moderate
- FEMA flood zone
- AE
- Chance of flooding over 30 yrs
- 0.55%
- Est. flood insurance / yr
- $2,026 – $9,024
Fire risk 1/10 · Minimal
- Est. fire insurance / yr
- $829 – $1,539
Heat risk 7/10 · Major
- Hot days now (above 99°F)
- 7 days/yr
- Hot days in 30 yrs
- 16 days/yr
Wind risk 6/10 · Moderate
- Chance of severe wind over 30 yrs
- 56.0%
Air-quality risk 5/10 · Moderate
- Unhealthy air days now
- 6 days/yr
- Unhealthy air days in 30 yrs
- 8 days/yr
Risk factors via First Street. Map © Google.
Why this score? — see what drove the B- grade
The composite is a weighted blend of 9 inputs, each scored 0–100. Each bar is that input's sub-score; the figure is the points it added to the 100-point composite (weight × sub-score).
- Cash flow +30.0/30.0
- 1% rule +10.0/10.0
- DSCR +10.0/10.0
- ARV discount +7.5/15.0
- Livability +4.0/5.0
- Rent growth +3.2/5.0
- Condition / age +2.5/5.0
- Schools +1.5/10.0
- Appreciation +0.0/10.0
$185,000
🖨 Deal sheet (PDF) 📄 Offer letter ✓ Due diligence
Listing remarks
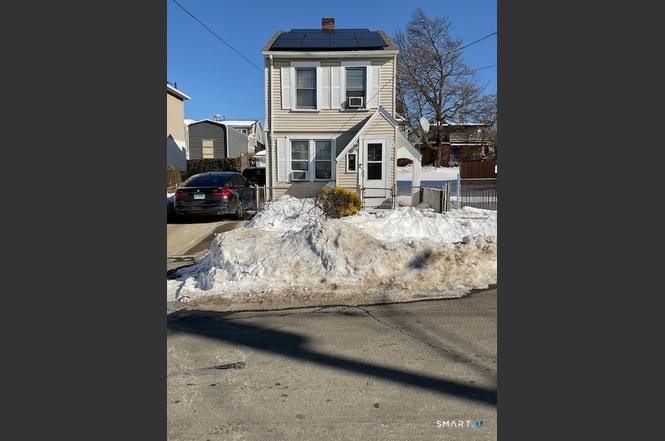
Opportunity Knocks! This charming, four bedroom colonial home with a detached two car garage located in a quiet desirable neighborhood and is bursting with potential this property does need TLC and updates and some renovations making a perfect opportunity for investor, first time homebuyer or someone ready to create their dream home this property is your chance to build instant equity. Major upgrades are already in place, including a brand, new roof and solar panels. Giving you peace of mind and long term energy savings. One of the home most exciting features is the unfinished walk up attic waiting to be transformed into a vibrant game room, a cozy reading nook, or peaceful relaxation/medit
Key facts
- Solar panels
- New roof
- 3,484 sq ft lot
Tags
Neighborhood map
What this means for you Summary
Snapshot
- This is a 4-bed/1.0-bath single-family listed at $185k.
Deal economics
- At list price, monthly cash flow is $314 ($4k/yr) — positive.
- The deal already cash-flows at list — no discount required.
- Meets the 1% rule at list price ($3k rent vs $185k).
- Recommended offer: $179k (3.0% below list) — sets the bar for market timing.
- Cap rate 11.3% vs local median 4.5% in New Haven — top-decile yield for the area; either an underpriced asset or a hidden risk that comps aren't pricing in. Stress-test before assuming the spread holds.
Location & tenants
- Location reads 79/100 on livability (#31 in CT, #2,190 nationally) — a middle-class / working-renter tenant base. Strengths: amenities A+, commute A+, health & safety A+; Watch: employment D, crime F.
- New Haven School District (urban): math 12% / reading 25% proficiency, ranked #147 of 153 in CT (top 96%) — low school quality limits family demand, transient renter base, plan for 1-2y turnover; 66% free/reduced lunch — lower-income household profile, screen leases tightly.
- Zoned schools: Betsy Ross Arts Magnet School (math 12% / reading 27%, grade F, #161 of 175 statewide, top 93%, 327 students, 70% FRL) — zoned schools at 70% FRL track the district average.
- Market conditions: Rents rising (+2.6%/yr); 140 active listings in the ZIP; 40 comparable units currently listed for rent nearby; rentals at typical pace (median 25d on market — plan ~3-4 weeks tenant-placement turnaround); 48% of comp listings sitting > 30 days — soft ceiling on asking rent; 1,059 units permitted in South Central Connecticut Planning Region in 2024 (779 in 5+ unit buildings).
- At $2,803/mo this rent would consume 56% of the median local household income ($60k/yr) (locally 4999% of renters already pay >50% of income on rent) — very limited rent-growth headroom before tenants either downsize or default.
Forward outlook
- Local home prices are declining (-3.0%/yr); year-one equity from $1k of loan paydown is wiped out by about $6k of value loss. Plan a longer hold.
Negotiation context
- It's been on market 36 days — a 3% lower offer ($179k) is reasonable based on typical stale-listing flexibility.
Risks & watch-outs
- Watch-outs: property tax is 2.5% of price; flood insurance adds $460/mo; built in 1900 — expect roof / HVAC / electrical / plumbing capex.
- Climate carrying-cost: in FEMA flood zone AE (mandatory federal flood insurance); major wind risk, 56% chance of damaging wind over 30y; extreme-heat days projected 7→16/yr by 2055 (HVAC capex compounding) — expect insurance premiums to compound above CPI over the hold.
Questions for the listing agent
- It's been on market 36 days. Have you received any prior offers? Is the seller open to a 3% concession, seller financing, or rate buy-down credit?
- Built in 1900 — when were the roof, HVAC, electrical panel, plumbing, and water heater last replaced?
- Property tax is high relative to price — has the assessment been appealed recently, and will the sale trigger a re-assessment?
- What's the actual annual flood-insurance premium (NFIP or private), and is the property in a SFHA with mandatory coverage?
- Is there a deadline driving the sale (1031 exchange, divorce, estate, relocation)? That informs how much negotiation room exists.
- Schools are D-rated, which usually means shorter tenancies and higher turnover. Who's the typical renter profile here, and what's been the actual vacancy rate?
- Crime grade is F in this area — have there been break-ins, vandalism, or insurance claims at this property in the last 3 years? What carrier currently insures it and at what premium?
- What's the average days-on-market for RENTAL listings here right now (not sales)? A rising rental-DOM trend means longer vacancies and softer asking-rent achievability than the comps imply.
- What's the recent tenant-quality profile in this submarket — average credit score on applications, eviction rate, late-payment / NSF rate, and stable-employment percentage? A property-management company in the area should have these aggregated.
- How much new for-sale + rental construction is in the pipeline within 1–3 miles? Heavy new supply typically softens prices + rents 12–24 months out; constrained supply supports both.
Investment metrics
- 1% rule
- 1.52% ✓
- Cap rate
- 11.32%
- Cash-on-cash
- 17.94%
- DSCR
- 1.80
- GRM
- 5.5
CMA / ARV
- ARV (on-the-fly)
- $514,808
- Comps found
- 6
Show comp detail 6 sales within ~0.75 mi
| Address | Dist | Beds/Ba | Sqft | Sold | Price | $/sf | Match |
|---|---|---|---|---|---|---|---|
| 14 Eld St | 0.67mi | 3/1.5 (-1) | 1,628 (+0%) | 1mo | $900,000 | $553 | 61 |
| 23 Market St | 0.19mi | 3/1.5 (-1) | 1,452 (-11%) | 12mo | $300,000 | $207 | 57 |
| 111 Pine St | 0.57mi | 4/2.0 | 1,728 (+6%) | 2mo | $289,000 | $167 | 56 |
| 24 Eld St | 0.70mi | 3/2.0 (-1) | 1,644 (+1%) | 23mo | $660,000 | $401 | 37 |
| 64 Clark St | 0.67mi | 3/1.5 (-1) | 1,497 (-8%) | 20mo | $475,000 | $317 | 32 |
| 25 Warren Pl | 0.69mi | 3/2.0 (-1) | 1,384 (-15%) | 17mo | $220,000 | $159 | 20 |
Match score weights: distance 35% · size 25% · config 20% · recency 20%. Top-matched comps best support the ARV.
Projected returns pro-forma
-3.0% appreciation · 2.6% rent growth · sell at horizon
- IRR
- -5.6%
- Equity multiple
- 0.79×
- Total profit
- $-10,669
- Equity at exit
- $27,584
- IRR
- 3.7%
- Equity multiple
- 1.26×
- Total profit
- $13,624
- Equity at exit
- $15,995
Cash invested: $51,800 (down + closing). Projections, not guarantees.
Landlord ↔ Tenant lean methodology
- Overall (STATE)
- 27 Tenant-Leaning
- State Connecticut
- 27 Tenant-Leaning · D+7
- County
- — inherits STATE
- City
- — inherits STATE
ZIP-level market 06511
- Home prices YoY
- -20.8%
- Rents YoY
- 2.6%
- Active inventory
- 140
- Price-to-rent
- 5.5×
Monthly cashflow live
- Estimated rent
- $2,803 high interval (Pro) →
- Mortgage (P&I)
- −$970
- Tax from tax record
- −$393 /mo · $4,713/yr
- Insurance
- −$77
- Flood insurance flood zone
- −$460 /mo · $5,525/yr
- HOA
- −$0
- Vacancy / Maint / Mgmt
- −$589
- Net cashflow
- $314
Break-even live
Sensitivity live
| Price | -10% $419 | -5% $367 | +0% $314 | +5% $262 | +10% $209 |
|---|---|---|---|---|---|
| Rent | -10% $93 | -5% $203 | +0% $314 | +5% $425 | +10% $536 |
| Rate | -1.0pp $407 | -0.5pp $361 | base $314 | +0.5pp $266 | +1.0pp $217 |
UW: 25.0% down · 7.5% · 30yr · 1.5% tax · 5.0% vac · 8.0% maint · 8.0% mgmt
Financing live
Cash to close
- Down payment
- $46,250
- Closing costs
- $5,550
- Reserves months
- —
- Total cash needed
- —
Loan-product check · same deal, 3 products live
Conventional
25% down · 7.5% · 30yr
- Down + closing
- —
- Monthly P&I
- —
- Monthly cashflow
- —
- DSCR
- —
- Eligible?
- —
Personal DTI + credit; lowest rate.
DSCR
20% down · 8.5% · 30yr
- Down + closing
- —
- Monthly P&I
- —
- Monthly cashflow
- —
- DSCR
- —
- Eligible?
- —
No personal income docs; deal must DSCR.
Hard money
10% down · 12.0% · 12mo
- Down + closing
- —
- Monthly P&I
- —
- Monthly cashflow
- —
- DSCR
- —
- Eligible?
- —
Short-term bridge; refi at stabilization.
Rent comps 40 comps
| Address | Beds | Baths | Sqft | Rent | $/sqft | DOM | Units | Dist |
|---|---|---|---|---|---|---|---|---|
| 20 Maltby Pl New Haven, CT | 3.0 | 1.0 | 1100 | $1,900 | $1.73 | 5d | 1 | 0.10mi |
| 262 Lloyd St Unit 1 New Haven, CT | 3.0 | 2.0 | 1460 | $2,400 | $1.64 | 5d | 1 | 0.14mi |
| 342 Exchange St Unit 2 New Haven, CT | 3.0 | 2.0 | 1200 | $2,300 | $1.92 | 45d | 1 | 0.24mi |
| 302 Exchange St Unit 2 New Haven, CT | 5.0 | 2.0 | 1800 | $2,500 | $1.39 | 45d | 1 | 0.27mi |
| 18 Woolsey St New Haven, CT | 5.0 | 2.0 | 1446 | $2,900 | $2.01 | 13d | 1 | 0.35mi |
| 426 Poplar St Unit 2 New Haven, CT | 4.0 | 2.0 | 1405 | $1,800 | $1.28 | 4d | 1 | 0.37mi |
| 426 Poplar St New Haven, CT | 3.0 | 1.0 | 1658 | $1,800 | $1.09 | 45d | 1 | 0.37mi |
| 115 Lloyd St #2 New Haven, CT | 4.0 | 2.0 | 2100 | $2,500 | $1.19 | 45d | 1 | 0.43mi |
| 132 Saltonstall Ave Unit 3 New Haven, CT | 3.0 | 1.0 | 1160 | $1,850 | $1.59 | 16d | 1 | 0.44mi |
| 483 Ferry St #1 New Haven, CT | 4.0 | 1.0 | 1100 | $2,310 | $2.10 | 45d | 1 | 0.45mi |
| 34 Wolcott St #3 New Haven, CT | 3.0 | 1.0 | 1115 | $1,700 | $1.52 | 25d | 1 | 0.48mi |
| 1050 State St New Haven, CT | 3.0 | 1.0–2.0 | 919 | $4,854 | $5.28 | 4d | 21 | 0.51mi |
| 902 State St #2 New Haven, CT | 3.0 | 2.5 | 1950 | $3,750 | $1.92 | 25d | 1 | 0.51mi |
| 28 Edwards St Unit 2 New Haven, CT | 4.0 | 2.0 | 1800 | $3,850 | $2.14 | 16d | 1 | 0.54mi |
| 54 Mechanic St Unit 2nd floor New Haven, CT | 4.0 | 2.0 | 1412 | $3,600 | $2.55 | 45d | 1 | 0.58mi |
| 60 Mechanic St Unit 2 New Haven, CT | 4.0 | 2.0 | 1050 | $3,195 | $3.04 | 45d | 1 | 0.58mi |
| 47 Edwards St Unit 2 New Haven, CT | 3.0 | 1.0 | 1170 | $2,200 | $1.88 | 45d | 1 | 0.59mi |
| 31 Clark St New Haven, CT | 4.0 | 2.0 | 1694 | $4,200 | $2.48 | 5d | 1 | 0.60mi |
| 74 Mechanic St Unit 1L New Haven, CT | 3.0 | 1.0 | 1100 | $2,095 | $1.90 | 16d | 1 | 0.60mi |
| 122 Atwater St New Haven, CT | 3.0 | 1.0 | 1274 | $2,300 | $1.81 | 5d | 1 | 0.61mi |
| 441 Chapel St Unit 2A1 (shared) New Haven, CT | 4.0 | 4.0 | 2151 | $3,600 | $1.67 | 4d | 1 | 0.61mi |
| 641 Ferry St New Haven, CT | 4.0 | 1.0 | 1200 | $2,100 | $1.75 | 45d | 1 | 0.61mi |
| 59 Clark St New Haven, CT | 4.0 | 1.0 | 1541 | $3,250 | $2.11 | 25d | 1 | 0.65mi |
| 86 Edwards St Unit 1 New Haven, CT | 4.0 | 2.0 | 1080 | $4,500 | $4.17 | 45d | 1 | 0.65mi |
| 48 Lyon St Unit 1 New Haven, CT | 3.0 | 1.0 | 1402 | $2,950 | $2.10 | 20d | 1 | 0.67mi |
| 239 Saint John St Unit 2 New Haven, CT | 3.0 | 2.0 | 1350 | $3,295 | $2.44 | 45d | 1 | 0.68mi |
| 37 E Pearl St New Haven, CT | 3.0 | 1.0 | 1600 | $2,595 | $1.62 | 45d | 1 | 0.70mi |
| 28 Eld St New Haven, CT | 3.0 | 1.0 | 1100 | $3,500 | $3.18 | 5d | 1 | 0.71mi |
| 106 Lawrence St Unit 1 New Haven, CT | 3.0 | 1.0 | 1200 | $3,295 | $2.75 | 45d | 1 | 0.71mi |
| 526 Chapel St Unit B New Haven, CT | 3.0 | 2.0 | 1450 | $3,500 | $2.41 | 23d | 1 | 0.78mi |
| 506 Orange St Unit 2 New Haven, CT | 3.0 | 1.5 | 1553 | $3,600 | $2.32 | 45d | 1 | 0.79mi |
| 399 Orange St New Haven, CT | 4.0 | 1.5 | 1650 | $3,200 | $1.94 | 13d | 1 | 0.81mi |
| 395 Orange St Unit 2 New Haven, CT | 4.0 | 1.5 | 1650 | $3,000 | $1.82 | 45d | 1 | 0.82mi |
| 367 Orange St New Haven, CT | 3.0 | 1.0–2.0 | 1075 | $4,973 | $4.63 | 4d | 43 | 0.82mi |
| 23 Brown St Unit 3 New Haven, CT | 3.0 | 1.0 | 1300 | $2,650 | $2.04 | 16d | 1 | 0.85mi |
| 23 Brown St New Haven, CT | 3.0 | 2.0 | 1350 | $2,650 | $1.96 | 5d | 1 | 0.85mi |
| 751 Orange St Unit 1ST New Haven, CT | 3.0 | 1.0 | 1344 | $3,200 | $2.38 | 45d | 1 | 0.86mi |
| 751 Orange St Unit 2nd floor New Haven, CT | 3.0 | 1.0 | 1090 | $3,000 | $2.75 | 45d | 1 | 0.86mi |
| 239 Bradley St Unit 2 New Haven, CT | 3.0 | 1.0 | 1384 | $3,500 | $2.53 | 45d | 1 | 0.86mi |
| 239 Bradley St Unit 1 New Haven, CT | 3.0 | 1.0 | 1982 | $3,650 | $1.84 | 45d | 1 | 0.86mi |
Listing history 3 events
-
2026-03-28status Under Contract
-
2026-03-19price $185,000
-
2026-02-20$289,000 Active
ⓘ Source: listings_history table (triggers on properties + properties_extension) + one-shot
backfill from property_details.listing_events for pre-trigger history.
Tax reassessment forecast CT · Partial reset (capped growth)
- Current annual tax
- $4,713 · $393/mo
- Projected year-2 tax
- $4,713 · $393/mo
- Expected delta
- $0/yr ($0/mo · 0.0%)
ⓘ Screening estimate from a state-policy table — verify with the county assessor before closing.
Climate risk First Street
- Flood 6/10 Major FEMA zone AE · 55% chance over 30 yrs
- Wildfire 1/10 Low
- Heat 7/10 Severe 7 d/yr ≥99°F today · 16 d/yr by 30 yrs out
- Wind 6/10 Major 56% chance of damaging wind over 30 yrs
- Air quality 5/10 Major 6 unhealthy d/yr today · 8 by 30 yrs out
Nearby sold comps map
Loading sold comps map…
Walkable amenities ~0.75 mi
Loading nearby amenities…
Taxation est. · year 1
- Rental income
- $33,639
- − Mortgage interest
- −$10,363
- − Property taxes
- −$4,713
- − Insurance
- −$6,450
- − Repairs & maintenance
- −$2,691
- − Management
- −$2,691
- − Depreciation
- −$5,382
- Taxable income
- $1,349
- Est. tax owed @ 24.0%
- −$324
- After-tax cash flow
- $3,446/yr
For passive investors: Depreciation is non-cash, so a rental often shows a tax loss while cash-flowing — sheltering income. Rental losses are passive: they offset passive income freely, and up to $25,000/yr can offset ordinary (W-2) income if you actively participate and your MAGI is under $100k (phasing out to $0 by $150k); unused losses carry forward. On sale, claimed depreciation is recaptured at up to 25%, and gains may owe capital-gains tax (a 1031 exchange can defer both). Figures are a year-1 estimate at your 24.0% rate — not tax advice; consult a CPA.
Schools (NCES district)
- District
- New Haven School District
- NCES district ID
- 0902790
- Math proficiency
- 12% ▼ -10.00%
- Reading proficiency
- 25% ▼ -10.00%
- Median HH income
- $38,058
- Composite
- 15.48/100
- National rank
- #9308
- State rank
- #147 of 153 in CT
Livability — New Haven
- Score
- 79/100
- State rank
- #31
- US rank
- #2190
Category grades
Schools grade is shown separately in the Schools card above.
Census & demographics
- Census place
- New Haven, CT
- County
- New Haven County · 688,236 people
- City population
- 132,813
- Metro
- New Haven-Milford, CT
- Population (ZIP)
- 54,730
- Household income
- $59,969
- Rent vs Own
- Severe rent burden
- 4999.0
Population outlook (South Central Connecticut County) Hauer SSP2
- By 2040
- 608,362
Race, ethnicity, and origin ACS 2023
- Neighborhood character
- Highly diverse neighborhood (Simpson 0.73)
- Race & ethnicity
- Black 34% White 32% Hispanic / Latino 21% Two or more races 8% Asian 7%
- Hispanic origin (detail)
- Mexican 4% Puerto Rican 10% Dominican 2%
- Common ancestry
- Romanian 2% Lithuanian 1% Russian 1%
- Foreign-born
- 17% · Canada, China, South Korea
- Languages at home
- 74% English-only · Spanish 15% Chinese 3% Other Indo-European 2%
Political lean MEDSL · South Central Connecticut
- 2024 margin
- Strong D (+20.1) · D 59.0% · R 38.9% · Other 2.1%
- All cycles
- 2024: D+20.1
Not yet ingested
- Civics
- —
Market trends
- HPI YoY
- ▼ -86.05%
- Current HPI
- 328.1353
- Rent YoY
- ▲ 2.60%
- Metro
- New Haven-Milford, CT
- State GDP YoY
- ▲ 1.06%
- F500 in state
- 38
Industry mix (Fortune 500 HQ in CT)
| Industry | F500 HQs | Revenue |
|---|---|---|
| Industrial Machinery | 4 | $38B |
|
||
| Insurance | 3 | $71B |
|
||
| Financial Services | 2 | $25B |
|
||
| Transportation / Logistics | 2 | $18B |
|
||
| Healthcare | 1 | $247B |
|
||
| Telecommunications | 1 | $55B |
|
||
Price history
-36.0% since first listed3 events — show timeline
- 2026-03-28 Pending — Smart MLS
- 2026-03-19 Price Changed $185,000 Smart MLS
- 2026-02-20 Listed $289,000 Smart MLS
Property tax history
+4.4%/yrLatest (2023): $4,713 · -6.4% YoY. Source: county tax records.
Cash-flow waterfall
monthlySold comps — $/sqft
last 12 mo · ≤1 miLoading sold comps…