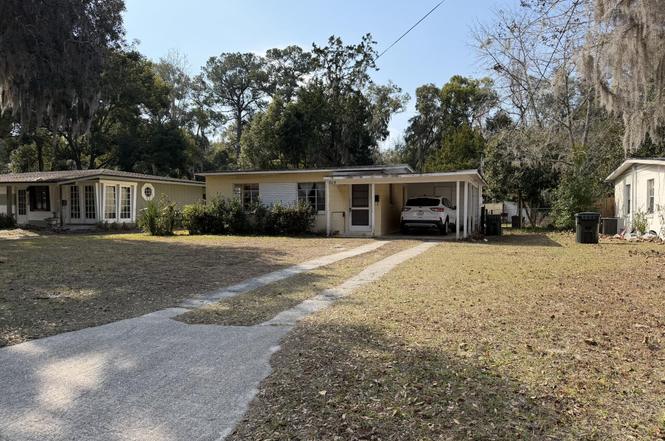
809 N Cypress Ave · Green Cove Springs, FL
Flood risk 1/10 · Minimal
- FEMA flood zone
- X (unshaded)
- Chance of flooding over 30 yrs
- 0.0%
- Est. flood insurance / yr
- $507 – $1,088
Fire risk 4/10 · Minor
- Est. fire insurance / yr
- $947 – $1,759
Heat risk 9/10 · Severe
- Hot days now (above 107°F)
- 7 days/yr
- Hot days in 30 yrs
- 20 days/yr
Wind risk 10/10 · Severe
- Chance of severe wind over 30 yrs
- 99.0%
Air-quality risk 3/10 · Minor
- Unhealthy air days now
- 3 days/yr
- Unhealthy air days in 30 yrs
- 3 days/yr
Risk factors via First Street. Map © Google.
Why this score? — see what drove the C grade
The composite is a weighted blend of 9 inputs, each scored 0–100. Each bar is that input's sub-score; the figure is the points it added to the 100-point composite (weight × sub-score).
- Cash flow +18.2/30.0
- ARV discount +15.0/15.0
- DSCR +5.7/10.0
- Schools +5.1/10.0
- 1% rule +4.7/10.0
- Livability +3.8/5.0
- Rent growth +2.6/5.0
- Condition / age +2.5/5.0
- Appreciation +0.0/10.0
$199,000
🖨 Deal sheet 📄 Offer letter ✓ Due diligence
Listing remarks
Seller is offering $5,000 buyer incentives with approved offer! Solid concrete block home with some unique features. Very deep back yard. Two car ports. Back carport has two swings. Large yard includes multiple sheds. Within walking distance to most of historic Green Cove Springs. Only two blocks from the Clay County Courthouse.
Key facts
- Two car ports
- Multiple sheds
- Deep back yard
Tags
Property features AI
Exterior
- Parking: Attached covered carport; 2 carport spaces
- Security: Smoke detectors
- Utilities: Public sewer; Water connected; Electricity connected; Cable available; Sewer connected
- Home design: Single family residence; One story; Accessible entrance with grip-accessible features
- Construction: Block and concrete construction; Membrane roof
- Exterior features: Covered side porch; Chain link fenced backyard; Shed(s)
Interior
- Kitchen: Electric oven; Refrigerator
- Bedrooms: 3 bedrooms
- Flooring: Laminate flooring; Stone flooring
- Bathrooms: 2 full bathrooms
- Heating & cooling: Central heating (electric); Central air; Split system cooling
- Interior features: Eat-in kitchen; Primary bathroom with tub and shower
- Laundry & utility: Washer; Dryer; Washer and dryer hookups (electric dryer hookup); Laundry located in carport and lower level
Neighborhood map
What this means for you Summary
Snapshot
- This is a 3-bed/1.0-bath single-family listed at $199k.
Deal economics
- At list price, monthly cash flow is $177 ($2k/yr) — positive.
- The deal already cash-flows at list — no discount required.
- To meet the 1% rule (rent ≥ 1% of price), the offer needs to be $193k (2.9% below list).
- Recommended offer: $181k (9.0% below list) — sets the bar for market timing.
- Cap rate 7.4% vs local median 4.2% in Green Cove Springs — top-decile yield for the area; either an underpriced asset or a hidden risk that comps aren't pricing in. Stress-test before assuming the spread holds.
Location & tenants
- Location reads 75/100 on livability (#245 in FL, #3,868 nationally) — a middle-class / working-renter tenant base. Strengths: cost of living A+, housing A+, health & safety A+; Watch: schools C-, amenities F, commute F.
- Clay (suburban): math 58% / reading 59% proficiency, ranked #14 of 73 in FL (top 19%) — acceptable for families but not a draw, mixed tenant base, ~2y average lease.
- Market conditions: Rents flat; 885 active listings in the ZIP; 12 comparable units currently listed for rent nearby; rentals leasing fast (median 4d on market — plan ~1-2 weeks tenant-placement turnaround); solid renter incomes; 1,876 units permitted in Clay County in 2024 (14 in 5+ unit buildings).
Forward outlook
- Local home prices are declining (-3.0%/yr); year-one equity from $1k of loan paydown is wiped out by about $6k of value loss. Plan a longer hold.
- Clay County population projected at +19% by 2050 — long-run rental-demand tailwind backs the buy-and-hold thesis.
Negotiation context
- It's been on market 92 days — a 9% lower offer ($181k) is reasonable based on typical stale-listing flexibility.
- Current owner paid $10k; list at $199k implies a 1995% gain — meaningful room to come down on a strong offer.
Risks & watch-outs
- Watch-outs: built in 1959 — expect roof / HVAC / electrical / plumbing capex.
- Climate carrying-cost: severe wind risk, 99% chance of damaging wind over 30y; extreme-heat days projected 7→20/yr by 2055 (HVAC capex compounding) — expect insurance premiums to compound above CPI over the hold.
Questions for the listing agent
- It's been on market 92 days. Have you received any prior offers? Is the seller open to a 9% concession, seller financing, or rate buy-down credit?
- Built in 1959 — when were the roof, HVAC, electrical panel, plumbing, and water heater last replaced?
- Why hasn't it sold? Are there any deal-killer items the seller is aware of (foundation, flood, title, zoning, code violations)?
- Is there a deadline driving the sale (1031 exchange, divorce, estate, relocation)? That informs how much negotiation room exists.
- What's the average days-on-market for RENTAL listings here right now (not sales)? A rising rental-DOM trend means longer vacancies and softer asking-rent achievability than the comps imply.
- What's the recent tenant-quality profile in this submarket — average credit score on applications, eviction rate, late-payment / NSF rate, and stable-employment percentage? A property-management company in the area should have these aggregated.
- How much new for-sale + rental construction is in the pipeline within 1–3 miles? Heavy new supply typically softens prices + rents 12–24 months out; constrained supply supports both.
Investment metrics
- 1% rule
- 0.97% ✗
- Cap rate
- 7.36%
- Cash-on-cash
- 3.82%
- DSCR
- 1.17
- GRM
- 8.6
CMA / ARV
- ARV (on-the-fly)
- $284,928
- Comps found
- 12
Show comp detail 12 sales within ~0.75 mi
| Address | Dist | Beds/Ba | Sqft | Sold | Price | $/sf | Match |
|---|---|---|---|---|---|---|---|
| 804 N Cypress Ave | 0.05mi | 3/1.0 | 1,299 (-3%) | 0mo | $170,000 | $131 | 92 |
| 1105 Buccaneer Blvd | 0.13mi | 3/2.0 | 1,386 (+3%) | 6mo | $255,000 | $184 | 80 |
| 1178 Buccaneer Blvd | 0.34mi | 3/2.0 | 1,408 (+5%) | 5mo | $285,000 | $202 | 68 |
| 203 Walburg St | 0.46mi | 3/2.0 | 1,396 (+4%) | 2mo | $350,000 | $251 | 67 |
| 524 N Cypress Ave | 0.38mi | 3/2.0 | 1,438 (+7%) | 0mo | $318,999 | $222 | 66 |
| 1162 Buccaneer Blvd | 0.31mi | 3/2.0 | 1,248 (-7%) | 6mo | $265,000 | $212 | 65 |
| 716 N Pine Ave | 0.17mi | 3/2.0 | 1,514 (+13%) | 4mo | $261,000 | $172 | 64 |
| 3413 Gator Bay Rd | 0.35mi | 3/2.0 | 1,516 (+13%) | 0mo | $330,000 | $218 | 58 |
| 1217 Spruce St | 0.62mi | 4/2.0 (+1) | 1,380 (+3%) | 3mo | $259,000 | $188 | 55 |
| 1290 Spruce St | 0.64mi | 3/2.0 | 1,258 (-6%) | 2mo | $275,000 | $219 | 54 |
| 611 Gum St | 0.64mi | 3/2.0 | 1,513 (+13%) | 1mo | $249,000 | $165 | 45 |
| 532 N Cypress Ave N | 0.68mi | 3/2.0 | 1,523 (+13%) | 6mo | $323,000 | $212 | 37 |
Match score weights: distance 35% · size 25% · config 20% · recency 20%. Top-matched comps best support the ARV.
Projected returns pro-forma
-3.0% appreciation · 0.46% rent growth · sell at horizon
- IRR
- -13.2%
- Equity multiple
- 0.54×
- Total profit
- $-25,754
- Equity at exit
- $29,672
- IRR
- -8.6%
- Equity multiple
- 0.52×
- Total profit
- $-26,612
- Equity at exit
- $17,206
Cash invested: $55,720 (down + closing). Projections, not guarantees.
Landlord ↔ Tenant lean methodology
- Overall (STATE)
- 87 Strongly Landlord-Friendly
- State Florida
- 87 Strongly Landlord-Friendly · R+3
- County
- — inherits STATE
- City
- — inherits STATE
ZIP-level market 32043
- Home prices YoY
- -26.3%
- Rents YoY
- 0.5%
- Active inventory
- 885
- Price-to-rent
- 8.6×
Monthly cashflow live
- Estimated rent
- $1,933 high interval (Pro) →
- Mortgage (P&I)
- −$1,044
- Tax from tax record
- −$223 /mo · $2,674/yr
- Insurance
- −$83
- HOA
- −$0
- Vacancy / Maint / Mgmt
- −$406
- Net cashflow
- $177
Break-even live
UW: 25.0% down · 7.5% · 30yr · 1.5% tax · 5.0% vac · 8.0% maint · 8.0% mgmt
Financing live
Cash to close
- Down payment
- $49,750
- Closing costs
- $5,970
- Reserves months
- —
- Total cash needed
- —
Loan-product check · same deal, 3 products live
Conventional
25% down · 7.5% · 30yr
- Down + closing
- —
- Monthly P&I
- —
- Monthly cashflow
- —
- DSCR
- —
- Eligible?
- —
Personal DTI + credit; lowest rate.
DSCR
20% down · 8.5% · 30yr
- Down + closing
- —
- Monthly P&I
- —
- Monthly cashflow
- —
- DSCR
- —
- Eligible?
- —
No personal income docs; deal must DSCR.
Hard money
10% down · 12.0% · 12mo
- Down + closing
- —
- Monthly P&I
- —
- Monthly cashflow
- —
- DSCR
- —
- Eligible?
- —
Short-term bridge; refi at stabilization.
Rent comps 12 comps
| Address | Beds | Baths | Sqft | Rent | $/sqft | DOM | Units | Dist |
|---|---|---|---|---|---|---|---|---|
| 4019 Pine Ave Unit 1 Green Cove Springs, FL | 3.0 | 2.5 | 1304 | $1,850 | $1.42 | 2d | 1 | 0.54mi |
| 4028 Pine Ave Unit 1 Green Cove Springs, FL | 3.0 | 2.5 | 1304 | $1,850 | $1.42 | 2d | 1 | 0.54mi |
| 1408 N Orange Ave Green Cove Springs, FL | 1.0–3.0 | 1.0 | 840 | $1,375 | $1.64 | 3d | 36 | 0.56mi |
| 104 Saint Elmo Rd Green Cove Springs, FL | 2.0 | 1.0 | 1120 | $1,850 | $1.65 | 23d | 1 | 0.72mi |
| 410 Center St Green Cove Springs, FL | 3.0 | 1.0 | 1100 | $1,600 | $1.45 | 23d | 1 | 0.80mi |
| 212 Saint Johns Ave Unit 212 Green Cove Springs, FL | 3.0 | 2.0 | 1560 | $2,300 | $1.47 | 23d | 1 | 0.90mi |
| 806 Oak St Unit 14 Green Cove Springs, FL | 2.0 | 2.0 | 1200 | $1,600 | $1.33 | 3d | 1 | 1.07mi |
| 806 Oak St Unit 10 Green Cove Springs, FL | 2.0 | 1.0 | 1000 | $1,400 | $1.40 | 2d | 1 | 1.07mi |
| 806 Oak St Unit 10 Green Cove Springs, FL | 2.0 | 1.0 | 1000 | $1,400 | $1.40 | 3d | 1 | 1.07mi |
| 806 Oak St Unit 14 Green Cove Springs, FL | 2.0 | 2.0 | 1200 | $1,600 | $1.33 | 2d | 1 | 1.07mi |
| 2996 Majestic Oaks Ln Green Cove Springs, FL | 4.0 | 2.0 | 1684 | $1,951 | $1.16 | 23d | 1 | 1.11mi |
| 1507 Julia St Green Cove Springs, FL | 3.0 | 2.0 | 1621 | $2,020 | $1.25 | 1d | 1 | 1.43mi |
Listing history 6 events
-
2026-06-02status $199,000 Pending 92 DOM
-
2026-06-01days on market $199,000 Active 92 DOM
-
2026-05-31days on market $199,000 Active 91 DOM
-
2026-05-21price $199,000
-
2026-03-01$215,000 Active
-
2000-10-24soldstatus $9,500
ⓘ Source: listings_history table (triggers on properties + properties_extension) + one-shot
backfill from property_details.listing_events for pre-trigger history.
Tax reassessment forecast FL · Resets to sale price
- Current annual tax
- $2,674 · $223/mo
- Projected year-2 tax
- $2,674 · $223/mo
- Expected delta
- $0/yr ($0/mo · 0.0%)
ⓘ Screening estimate from a state-policy table — verify with the county assessor before closing.
Climate risk First Street
- Flood 1/10 Low FEMA zone X (unshaded) · 0% chance over 30 yrs
- Wildfire 4/10 Moderate
- Heat 9/10 Extreme 7 d/yr ≥107°F today · 20 d/yr by 30 yrs out
- Wind 10/10 Extreme 99% chance of damaging wind over 30 yrs
- Air quality 3/10 Moderate 3 unhealthy d/yr today · 3 by 30 yrs out
Nearby sold comps map
Loading sold comps map…
Walkable amenities ~0.75 mi
Loading nearby amenities…
Taxation est. · year 1
- Rental income
- $23,191
- − Mortgage interest
- −$11,147
- − Property taxes
- −$2,674
- − Insurance
- −$995
- − Repairs & maintenance
- −$1,855
- − Management
- −$1,855
- − Depreciation
- −$5,789
- Taxable loss
- −$1,125
- Est. tax savings @ 24.0%
- +$270
- After-tax cash flow
- $2,398/yr
For passive investors: Depreciation is non-cash, so a rental often shows a tax loss while cash-flowing — sheltering income. Rental losses are passive: they offset passive income freely, and up to $25,000/yr can offset ordinary (W-2) income if you actively participate and your MAGI is under $100k (phasing out to $0 by $150k); unused losses carry forward. On sale, claimed depreciation is recaptured at up to 25%, and gains may owe capital-gains tax (a 1031 exchange can defer both). Figures are a year-1 estimate at your 24.0% rate — not tax advice; consult a CPA.
Schools (NCES district)
- District
- Clay
- NCES district ID
- 1200300
- Math proficiency
- 58% ▼ -8.00%
- Reading proficiency
- 59% ▼ -3.00%
- Median HH income
- $59,379
- Composite
- 50.73/100
- National rank
- #1815
- State rank
- #14 of 73 in FL
Livability — Green Cove Springs
- Score
- 75/100
- State rank
- #245
- US rank
- #3868
Category grades
Schools grade is shown separately in the Schools card above.
Census & demographics
- Census place
- Green Cove Springs, FL
- County
- Clay County · 208,450 people
- City population
- 34,562
- Metro
- Jacksonville, FL
- Population (ZIP)
- 34,562
- Household income
- $84,145
- Rent vs Own
- Severe rent burden
- 449.0
Population outlook (Clay County) Hauer SSP2
- Today (2025)
- 230,495 people
- By 2030
- 242,427 · +5.2%
- By 2040
- 262,244 · +13.8%
- By 2050
- 275,148 · +19.4%
- By 2075
- 295,397 · +28.2%
- By 2100
- 287,592 · +24.8%
Race, ethnicity, and origin ACS 2023
- Neighborhood character
- Predominantly White (77%)
- Race & ethnicity
- White 77% Black 10% Two or more races 7% Hispanic / Latino 6% Asian 2%
- Hispanic origin (detail)
- Mexican 2% Puerto Rican 1%
- Common ancestry
- Slovak 3% Romanian 2% Lithuanian 2%
- Foreign-born
- 5% · Canada
- Languages at home
- 92% English-only · Spanish 5% French/Haitian/Cajun 1% Other Indo-European 1%
Political lean MEDSL · Clay
- 2024 margin
- Solid R (+39.3) · D 29.9% · R 69.2%
- 2008→2024 swing
- +3.6pp toward D · 2008: -42.8pp · 2024: -39.3pp
- All cycles
- 2024: R+39.3 2020: R+37.1 2016: R+44.3 2012: R+45.8 2008: R+42.8
Not yet ingested
- Civics
- —
Market trends
- HPI YoY
- ▼ -107.34%
- Current HPI
- 301.3212
- Rent YoY
- ▲ 0.46%
- Metro
- Jacksonville, FL
- State GDP YoY
- ▲ 3.28%
- F500 in state
- 36
Industry mix (Fortune 500 HQ in FL)
| Industry | F500 HQs | Revenue |
|---|---|---|
| Industrial Technology | 2 | $29B |
|
||
| Insurance | 2 | $17B |
|
||
| Retail | 1 | $60B |
|
||
| Technology Distribution | 1 | $58B |
|
||
| Homebuilding | 1 | $35B |
|
||
| Technology Manufacturing | 1 | $35B |
|
||
Price history
+1994.7% since first listed3 events — show timeline
- 2026-05-21 Price Changed $199,000 realMLS
- 2026-03-01 Listed $215,000 realMLS
- 2000-10-24 Sold (Public Records) $9,500 Public Records
Property tax history
+18.9%/yrLatest (2025): $2,674 · +7.9% YoY. Source: county tax records.
Cash-flow waterfall
monthlySold comps — $/sqft
last 12 mo · ≤1 miLoading sold comps…