840 N Fort Ave #52 · Sierra Vista, AZ
Flood risk 1/10 · Minimal
- FEMA flood zone
- X (unshaded)
- Chance of flooding over 30 yrs
- 0.0%
- Est. flood insurance / yr
- $507 – $1,088
Fire risk 7/10 · Major
- Est. fire insurance / yr
- $610 – $1,132
Heat risk 5/10 · Moderate
- Hot days now (above 97°F)
- 5 days/yr
- Hot days in 30 yrs
- 14 days/yr
Wind risk 1/10 · Minimal
- Chance of severe wind over 30 yrs
- —
Air-quality risk 1/10 · Minimal
- Unhealthy air days now
- 0 days/yr
- Unhealthy air days in 30 yrs
- 0 days/yr
Risk factors via First Street. Map © Google.
Why this score? — see what drove the B grade
The composite is a weighted blend of 9 inputs, each scored 0–100. Each bar is that input's sub-score; the figure is the points it added to the 100-point composite (weight × sub-score).
- Cash flow +30.0/30.0
- 1% rule +10.0/10.0
- DSCR +10.0/10.0
- ARV discount +7.8/15.0
- Livability +4.0/5.0
- Condition / age +3.8/5.0
- Schools +2.9/10.0
- Rent growth +2.5/5.0
- Appreciation +0.0/10.0
$60,000
🖨 Deal sheet (PDF) 📄 Offer letter ✓ Due diligence
Listing remarks MLS
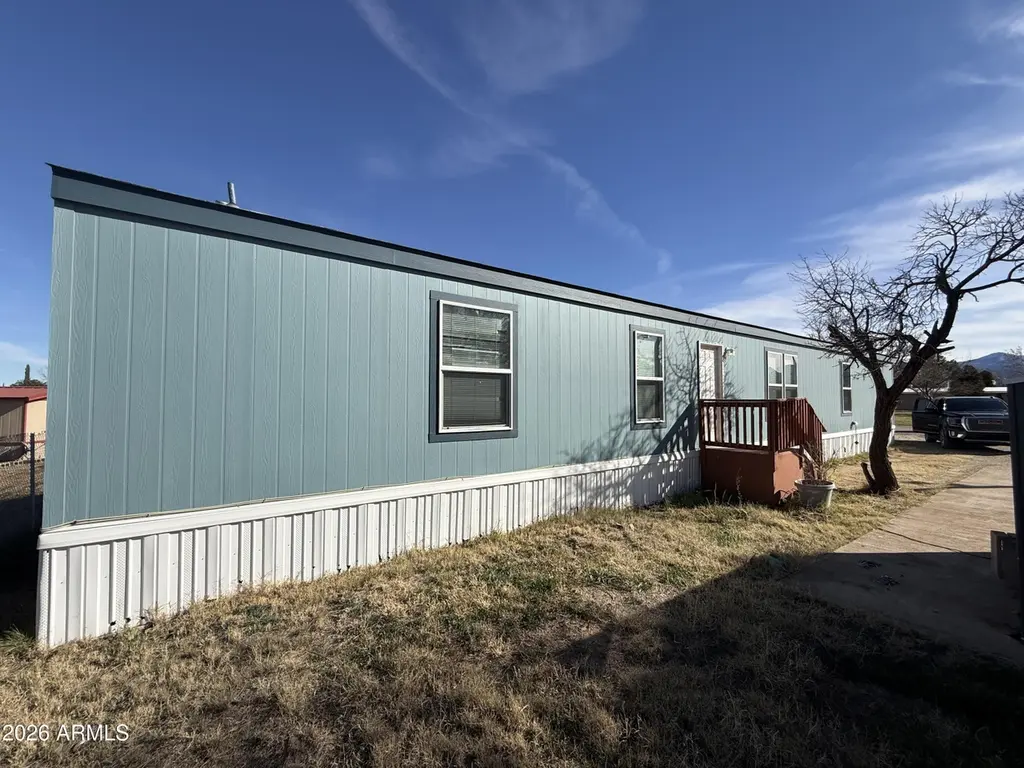
2017 built home in the Central Park Estates community with split floorpan, central heat and air. This property has been upgraded by its owner and looks amazing. Walking distance to shopping and restaurants, quiet community with views of the mountains. Space rental feee includes trash, water, sewer and road maintenance. Plenty of parking or space for relaxing. Concrete pad for a patio or shed.
Key facts
- Split floorpan
- Plenty of parking
- Upgraded by owner
Tags
Neighborhood map
What this means for you Summary
Snapshot
- This is a 3-bed/2.0-bath manufactured listed at $60k. Condition is rated good.
Deal economics
- At list price, monthly cash flow is $538 ($6k/yr) — positive.
- The deal already cash-flows at list — no discount required.
- Meets the 1% rule at list price ($1k rent vs $60k).
- Recommended offer: $53k (12.0% below list) — sets the bar for market timing.
- Cap rate 17.1% vs local median 4.2% in Sierra Vista — top-decile yield for the area; either an underpriced asset or a hidden risk that comps aren't pricing in. Stress-test before assuming the spread holds.
Location & tenants
- Location reads 80/100 on livability (#5 in AZ, #1,805 nationally) — a professional / high-income tenant draw. Strengths: commute A+, housing A+, health & safety A+; Watch: amenities F.
- Sierra Vista Unified District (4175) (urban): math 27% / reading 39% proficiency, ranked #93 of 249 in AZ (top 37%) — families likely to look elsewhere, expect single-tenant / working-renter base with shorter leases.
- Zoned schools: Carmichael Elementary School (math 12% / reading 22%, grade F, #814 of 1,109 statewide, top 76%, 299 students, 75% FRL); Joyce Clark Middle School (math 26% / reading 39%, grade F, #70 of 218 statewide, top 32%, 670 students, 46% FRL); Buena High School (math 19% / reading 29%, grade F, #202 of 381 statewide, top 54%, 1,836 students, 32% FRL) — zoned schools average 51% FRL vs 36% district-wide (15 pts higher); higher-poverty schools than district average — tighter screening recommended.
- Market conditions: Rents flat; 180 active listings in the ZIP; 14 comparable units currently listed for rent nearby; rentals lingering (median 46d on market — plan ~5-8 weeks vacancy on turnover, expect pricing pressure); 64% of comp listings sitting > 30 days — soft ceiling on asking rent; 437 units permitted in Cochise County in 2024 (6 in 5+ unit buildings).
Forward outlook
- Local home prices are declining (-3.0%/yr); year-one equity from $415 of loan paydown is wiped out by about $2k of value loss. Plan a longer hold.
- Cochise County population projected at -30% by 2050 — secular population decline; favor cash flow + early exit over multi-decade hold.
- At projected returns (-3.0% appreciation + 0.0% rent growth), your $17k cash investment doubles in ~4 years — after that, you're playing with house money.
Negotiation context
- It's been on market 151 days — a 12% lower offer ($53k) is reasonable based on typical stale-listing flexibility.
Risks & watch-outs
- Climate carrying-cost: major wildfire risk; extreme-heat days projected 5→14/yr by 2055 (HVAC capex compounding) — expect insurance premiums to compound above CPI over the hold.
Questions for the listing agent
- It's been on market 151 days. Have you received any prior offers? Is the seller open to a 12% concession, seller financing, or rate buy-down credit?
- Why hasn't it sold? Are there any deal-killer items the seller is aware of (foundation, flood, title, zoning, code violations)?
- Is there a deadline driving the sale (1031 exchange, divorce, estate, relocation)? That informs how much negotiation room exists.
- What's the average days-on-market for RENTAL listings here right now (not sales)? A rising rental-DOM trend means longer vacancies and softer asking-rent achievability than the comps imply.
- What's the recent tenant-quality profile in this submarket — average credit score on applications, eviction rate, late-payment / NSF rate, and stable-employment percentage? A property-management company in the area should have these aggregated.
- How much new for-sale + rental construction is in the pipeline within 1–3 miles? Heavy new supply typically softens prices + rents 12–24 months out; constrained supply supports both.
Investment metrics
- 1% rule
- 2.01% ✓
- Cap rate
- 17.06%
- Cash-on-cash
- 38.44%
- DSCR
- 2.71
- GRM
- 4.1
CMA / ARV
- ARV (median comp)
- $60,428
- List price
- $60,000
- Delta
- -0.71%
- Verdict
- FAIR
- Comps
- 2 within 2.0 mi
Projected returns pro-forma
-3.0% appreciation · 0.0% rent growth · sell at horizon
- IRR
- 31.1%
- Equity multiple
- 2.25×
- Total profit
- $21,036
- Equity at exit
- $8,946
- IRR
- 36.6%
- Equity multiple
- 3.91×
- Total profit
- $48,867
- Equity at exit
- $5,188
Cash invested: $16,800 (down + closing). Projections, not guarantees.
Landlord ↔ Tenant lean methodology
- Overall (STATE)
- 87 Strongly Landlord-Friendly
- State Arizona
- 87 Strongly Landlord-Friendly · R+3
- County
- — inherits STATE
- City
- — inherits STATE
ZIP-level market 85635
- Home prices YoY
- -32.3%
- Rents YoY
- 0.0%
- Active inventory
- 180
- Price-to-rent
- 4.1×
Monthly cashflow live
- Estimated rent
- $1,206 high interval (Pro) →
- Mortgage (P&I)
- −$315
- Tax est. 1.5%
- −$75 /mo · $900/yr
- Insurance
- −$25
- HOA
- −$0
- Vacancy / Maint / Mgmt
- −$253
- Net cashflow
- $538
Break-even live
Sensitivity live
| Price | -10% $580 | -5% $559 | +0% $538 | +5% $517 | +10% $497 |
|---|---|---|---|---|---|
| Rent | -10% $443 | -5% $491 | +0% $538 | +5% $586 | +10% $633 |
| Rate | -1.0pp $568 | -0.5pp $553 | base $538 | +0.5pp $523 | +1.0pp $507 |
UW: 25.0% down · 7.5% · 30yr · 1.5% tax · 5.0% vac · 8.0% maint · 8.0% mgmt
Financing live
Cash to close
- Down payment
- $15,000
- Closing costs
- $1,800
- Reserves months
- —
- Total cash needed
- —
Loan-product check · same deal, 3 products live
Conventional
25% down · 7.5% · 30yr
- Down + closing
- —
- Monthly P&I
- —
- Monthly cashflow
- —
- DSCR
- —
- Eligible?
- —
Personal DTI + credit; lowest rate.
DSCR
20% down · 8.5% · 30yr
- Down + closing
- —
- Monthly P&I
- —
- Monthly cashflow
- —
- DSCR
- —
- Eligible?
- —
No personal income docs; deal must DSCR.
Hard money
10% down · 12.0% · 12mo
- Down + closing
- —
- Monthly P&I
- —
- Monthly cashflow
- —
- DSCR
- —
- Eligible?
- —
Short-term bridge; refi at stabilization.
Rent comps 14 comps
| Address | Beds | Baths | Sqft | Rent | $/sqft | DOM | Units | Dist |
|---|---|---|---|---|---|---|---|---|
| 270 W Tacoma St Sierra Vista, AZ | 3.0 | 2.0 | 1120 | $995 | $0.89 | 45d | 1 | 0.25mi |
| 604 Graham Dr Sierra Vista, AZ | 3.0 | 2.0 | 1120 | $995 | $0.89 | 45d | 1 | 0.35mi |
| 557 Graham Dr Sierra Vista, AZ | 2.0 | 1.0 | 678 | $900 | $1.33 | 45d | 1 | 0.38mi |
| 540 North Ave Unit A Sierra Vista, AZ | 3.0 | 1.0 | 800 | $950 | $1.19 | 45d | 1 | 0.41mi |
| 600 Charles Dr Sierra Vista, AZ | 1.0–2.0 | 1.0 | 637 | $1,589 | $2.49 | 3d | 15 | 0.80mi |
| 1125 N 7th St Sierra Vista, AZ | 2.0–3.0 | 2.0 | 1000 | $1,391 | $1.39 | 4d | 1 | 0.99mi |
| 355 N 7th St Sierra Vista, AZ | 2.0 | 1.0–2.0 | 600 | $965 | $1.61 | 3d | 9 | 1.06mi |
| 555 N 7th St Sierra Vista, AZ | 2.0 | 1.0–2.0 | 521 | $919 | $1.76 | 45d | 1 | 1.07mi |
| 499 S Carmichael Ave Sierra Vista, AZ | 3.0–4.0 | 2.0 | 1163 | $1,675 | $1.44 | 3d | 5 | 1.09mi |
| 420 Camino Mojado Sierra Vista, AZ | 2.0 | 2.0 | 1120 | $1,300 | $1.16 | 45d | 1 | 1.19mi |
| 1205 Cottonwood Dr Sierra Vista, AZ | 3.0 | 2.0 | 1051 | $1,400 | $1.33 | 46d | 1 | 1.27mi |
| 500 S 7th St Sierra Vista, AZ | 3.0 | 2.0 | 924 | $999 | $1.08 | 45d | 1 | 1.38mi |
| 800 N Lenzner Ave Sierra Vista, AZ | 3.0 | 2.0 | 1050 | $1,070 | $1.02 | 45d | 1 | 1.44mi |
| 800 S Carmichael Ave Sierra Vista, AZ | 1.0–2.0 | 1.0 | 637 | $965 | $1.51 | 3d | 16 | 1.46mi |
Listing history 18 events
-
2026-06-21days on market $60,000 Active 151 DOM
-
2026-06-19days on market $60,000 Active 149 DOM
-
2026-06-18days on market $60,000 Active 148 DOM
-
2026-06-17days on market $60,000 Active 147 DOM
-
2026-06-16days on market $60,000 Active 146 DOM
-
2026-06-15days on market $60,000 Active 145 DOM
-
2026-06-14days on market $60,000 Active 143 DOM
-
2026-06-12days on market $60,000 Active 142 DOM
-
2026-06-09days on market $60,000 Active 139 DOM
-
2026-06-08days on market $60,000 Active 138 DOM
-
2026-06-07days on market $60,000 Active 137 DOM
-
2026-06-05days on market $60,000 Active 134 DOM
-
2026-06-03days on market $60,000 Active 133 DOM
-
2026-06-02days on market $60,000 Active 132 DOM
-
2026-06-01days on market $60,000 Active 131 DOM
-
2026-05-31days on market $60,000 Active 130 DOM
-
2026-05-30days on market $60,000 Active 129 DOM
-
2026-01-20$60,000 Active 395-char remark
Show marketing remark (395 chars)
2017 built home in the Central Park Estates community with split floorpan, central heat and air. This property has been upgraded by its owner and looks amazing. Walking distance to shopping and restaurants, quiet community with views of the mountains. Space rental feee includes trash, water, sewer and road maintenance. Plenty of parking or space for relaxing. Concrete pad for a patio or shed.
ⓘ Source: listings_history table (triggers on properties + properties_extension) + one-shot
backfill from property_details.listing_events for pre-trigger history.
Climate risk First Street
- Flood 1/10 Low FEMA zone X (unshaded) · 0% chance over 30 yrs
- Wildfire 7/10 Severe
- Heat 5/10 Major 5 d/yr ≥97°F today · 14 d/yr by 30 yrs out
- Wind 1/10 Low
- Air quality 1/10 Low 0 unhealthy d/yr today · 0 by 30 yrs out
Nearby sold comps map
Loading sold comps map…
Walkable amenities ~0.75 mi
Loading nearby amenities…
Taxation est. · year 1
- Rental income
- $14,473
- − Mortgage interest
- −$3,361
- − Property taxes
- −$900
- − Insurance
- −$300
- − Repairs & maintenance
- −$1,158
- − Management
- −$1,158
- − Depreciation
- −$1,745
- Taxable income
- $5,851
- Est. tax owed @ 24.0%
- −$1,404
- After-tax cash flow
- $5,054/yr
For passive investors: Depreciation is non-cash, so a rental often shows a tax loss while cash-flowing — sheltering income. Rental losses are passive: they offset passive income freely, and up to $25,000/yr can offset ordinary (W-2) income if you actively participate and your MAGI is under $100k (phasing out to $0 by $150k); unused losses carry forward. On sale, claimed depreciation is recaptured at up to 25%, and gains may owe capital-gains tax (a 1031 exchange can defer both). Figures are a year-1 estimate at your 24.0% rate — not tax advice; consult a CPA.
Condition & rehab AI · 12 photos
This 2017-built manufactured home in Sierra Vista, AZ, is in good condition with cosmetic updates. It offers a split floorpan, central heat and air, and is located in a quiet community with mountain views. The property is move-in ready with minor maintenance needed.
Value-add opportunities
- Both Paint exterior siding — Enhances curb appeal and value
- Both Landscaping improvements — Improves curb appeal and rental value
Renovation cost estimate screening
Value-add ROI direction
- Both Paint exterior siding — Enhances curb appeal and value ↑
- Both Landscaping improvements — Improves curb appeal and rental value ↑
ⓘ Cost ranges are severity-bucket heuristics (US national rule-of-thumb). Get contractor quotes + a written scope before underwriting a rehab budget.
Schools (NCES district)
- District
- Sierra Vista Unified District (4175)
- NCES district ID
- 0401460
- Math proficiency
- 27% ▼ -19.00%
- Reading proficiency
- 39% ▼ -10.00%
- Median HH income
- $55,463
- Composite
- 29.17/100
- National rank
- #6573
- State rank
- #93 of 249 in AZ
Livability — Sierra Vista
- Score
- 80/100
- State rank
- #5
- US rank
- #1805
Category grades
Schools grade is shown separately in the Schools card above.
Census & demographics
- Census place
- Sierra Vista, AZ
- County
- Cochise County · 49,069 people
- City population
- 49,069
- Metro
- Sierra Vista-Douglas, AZ
- Population (ZIP)
- 34,193
- Household income
- $61,580
- Rent vs Own
- Severe rent burden
- 1129.0
Population outlook (Cochise County) Hauer SSP2
- Today (2025)
- 113,402 people
- By 2030
- 106,197 · -6.4%
- By 2040
- 92,166 · -18.7%
- By 2050
- 79,805 · -29.6%
- By 2075
- 56,831 · -49.9%
- By 2100
- 35,103 · -69.0%
Race, ethnicity, and origin ACS 2023
- Neighborhood character
- Diverse neighborhood (Simpson 0.60)
- Race & ethnicity
- White 58% Hispanic / Latino 25% Two or more races 17% Black 6% Asian 4%
- Hispanic origin (detail)
- Mexican 19% Puerto Rican 1%
- Common ancestry
- Romanian 3% Lithuanian 3% Italian 2%
- Foreign-born
- 11% · Canada, South Korea
- Languages at home
- 80% English-only · Spanish 14% Korean 2% German/W. Germanic 1%
Political lean MEDSL · Cochise
- 2024 margin
- Strong R (+23.1) · D 37.8% · R 61.0% · Other 1.2%
- 2008→2024 swing
- -2.5pp toward R · 2008: -20.7pp · 2024: -23.1pp
- All cycles
- 2024: R+23.1 2020: R+19.6 2016: R+22.6 2012: R+24.0 2008: R+20.7
Not yet ingested
- Civics
- —
Market trends
- HPI YoY
- ▼ -83.93%
- Current HPI
- 175.5821
- Rent YoY
- ▬ 0.00%
- Metro
- Sierra Vista-Douglas, AZ
- State GDP YoY
- ▲ 4.54%
- F500 in state
- 20
Industry mix (Fortune 500 HQ in AZ)
| Industry | F500 HQs | Revenue |
|---|---|---|
| Technology | 2 | $13B |
|
||
| Mining / Metals | 1 | $23B |
|
||
| Environmental Services | 1 | $16B |
|
||
| Metals / Steel | 1 | $14B |
|
||
| Technology Distribution | 1 | $9B |
|
||
| Homebuilding | 1 | $8B |
|
||
Price history
1 event — show timeline
- 2026-01-20 Listed $60,000 ARMLS
Cash-flow waterfall
monthlySold comps — $/sqft
last 12 mo · ≤1 miLoading sold comps…