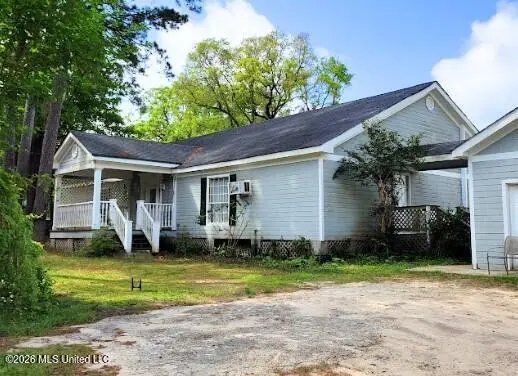
10517 Huckleberry Cv · Gulfport, MS
Flood risk 3/10 · Minor
- FEMA flood zone
- X (unshaded)
- Chance of flooding over 30 yrs
- 0.1%
- Est. flood insurance / yr
- $507 – $1,088
Fire risk 4/10 · Minor
- Est. fire insurance / yr
- $1,241 – $2,305
Heat risk 10/10 · Severe
- Hot days now (above 107°F)
- 7 days/yr
- Hot days in 30 yrs
- 21 days/yr
Wind risk 9/10 · Severe
- Chance of severe wind over 30 yrs
- 99.0%
Air-quality risk 2/10 · Minimal
- Unhealthy air days now
- 1 days/yr
- Unhealthy air days in 30 yrs
- 2 days/yr
Risk factors via First Street. Map © Google.
Why this score? — see what drove the B grade
The composite is a weighted blend of 9 inputs, each scored 0–100. Each bar is that input's sub-score; the figure is the points it added to the 100-point composite (weight × sub-score).
- Cash flow +30.0/30.0
- 1% rule +10.0/10.0
- DSCR +10.0/10.0
- ARV discount +7.5/15.0
- Rent growth +4.2/5.0
- Schools +4.2/10.0
- Livability +3.7/5.0
- Condition / age +2.5/5.0
- Appreciation +0.0/10.0
$128,500
🖨 Deal sheet 📄 Offer letter ✓ Due diligence
Listing remarks MLS
This property offers a unique opportunity with two separate living spaces on one parcel. The main home features 3 bedrooms and 2.5 bathrooms and a detached 1 bed, 1 bath apartment. Improved roof, HWH, and electrical wiring.
Key facts
- Electrical wiring
- Improved roof
- 0.44 acre lot
Tags
Neighborhood map
What this means for you Summary
Snapshot
- This is a 4-bed/1.5-bath single-family listed at $128k.
Deal economics
- At list price, monthly cash flow is $726 ($9k/yr) — positive.
- The deal already cash-flows at list — no discount required.
- Meets the 1% rule at list price ($2k rent vs $128k).
- Recommended offer: $121k (6.0% below list) — sets the bar for market timing.
- Cap rate 13.1% vs local median 4.9% in Gulfport — top-decile yield for the area; either an underpriced asset or a hidden risk that comps aren't pricing in. Stress-test before assuming the spread holds.
Location & tenants
- Location reads 73/100 on livability (#15 in MS) — a middle-class / working-renter tenant base. Strengths: cost of living A+, housing A+, health & safety A+; Watch: schools D, amenities F, commute F.
- Harrison County School District (rural): math 52% / reading 46% proficiency, ranked #14 of 130 in MS (top 11%) — families likely to look elsewhere, expect single-tenant / working-renter base with shorter leases; 62% free/reduced lunch — lower-income household profile, screen leases tightly.
- Market conditions: Rents rising fast (+7.0%/yr); 763 active listings in the ZIP; 2,194 units permitted in Harrison County in 2024 (0 in 5+ unit buildings).
- This rent runs 37% of the median local income ($63k/yr) — at the standard rent-burdened threshold; future hikes will face affordability resistance.
Forward outlook
- Local home prices are declining (-3.0%/yr); year-one equity from $888 of loan paydown is wiped out by about $4k of value loss. Plan a longer hold.
- Harrison County population projected at +27% by 2050 — long-run rental-demand tailwind backs the buy-and-hold thesis.
- At projected returns (-3.0% appreciation + 7.0% rent growth), your $36k cash investment doubles in ~5 years — after that, you're playing with house money.
Negotiation context
- It's been on market 70 days — a 6% lower offer ($121k) is reasonable based on typical stale-listing flexibility.
- 3 sale attempts since 9y ago; this cycle's ask has dropped $22k (14%) from the opening price — seller is motivated, your offer sets the floor, not the list.
Risks & watch-outs
- Climate carrying-cost: severe wind risk, 99% chance of damaging wind over 30y; extreme-heat days projected 7→21/yr by 2055 (HVAC capex compounding) — expect insurance premiums to compound above CPI over the hold.
Questions for the listing agent
- It's been on market 70 days. Have you received any prior offers? Is the seller open to a 6% concession, seller financing, or rate buy-down credit?
- Built in 1974 — when were the roof, HVAC, electrical panel, plumbing, and water heater last replaced?
- Why hasn't it sold? Are there any deal-killer items the seller is aware of (foundation, flood, title, zoning, code violations)?
- Is there a deadline driving the sale (1031 exchange, divorce, estate, relocation)? That informs how much negotiation room exists.
- Schools are D-rated, which usually means shorter tenancies and higher turnover. Who's the typical renter profile here, and what's been the actual vacancy rate?
- What's the average days-on-market for RENTAL listings here right now (not sales)? A rising rental-DOM trend means longer vacancies and softer asking-rent achievability than the comps imply.
- What's the recent tenant-quality profile in this submarket — average credit score on applications, eviction rate, late-payment / NSF rate, and stable-employment percentage? A property-management company in the area should have these aggregated.
- How much new for-sale + rental construction is in the pipeline within 1–3 miles? Heavy new supply typically softens prices + rents 12–24 months out; constrained supply supports both.
Investment metrics
- 1% rule
- 1.52% ✓
- Cap rate
- 13.07%
- Cash-on-cash
- 24.21%
- DSCR
- 2.08
- GRM
- 5.5
CMA / ARV
- ARV (median comp)
- $416,617
- List price
- $128,500
- Delta
- -69.16%
- Verdict
- UNDERPRICED
- Comps
- 20 within 1.0 mi
Show comp detail 12 sales within ~0.75 mi
| Address | Dist | Beds/Ba | Sqft | Sold | Price | $/sf | Match |
|---|---|---|---|---|---|---|---|
| 12017 Parc Merlot | 0.39mi | 4/2.5 | 2,811 (-2%) | 3mo | $393,595 | $140 | 72 |
| 12034 Parc Aux Chenes | 0.50mi | 4/2.5 | 2,811 (-2%) | 5mo | $397,320 | $141 | 66 |
| 12124 Parc Aux Chenes | 0.32mi | 5/3.0 (+1) | 2,720 (-5%) | 2mo | $411,299 | $151 | 64 |
| 12044 Parc Aux Chenes | 0.50mi | 4/2.5 | 2,811 (-2%) | 7mo | $405,570 | $144 | 63 |
| 12047 Parc Merlot | 0.31mi | 5/3.0 (+1) | 2,720 (-5%) | 8mo | $410,045 | $151 | 60 |
| 12028 Parc Aux Chenes | 0.50mi | 5/3.0 (+1) | 2,720 (-5%) | 1mo | $397,430 | $146 | 57 |
| 12037 Parc Aux Chenes | 0.46mi | 5/3.0 (+1) | 2,720 (-5%) | 3mo | $397,964 | $146 | 57 |
| 10071 Parc Merlot | 0.45mi | 5/3.0 (+1) | 2,720 (-5%) | 6mo | $412,930 | $152 | 55 |
| 12003 Parc Merlot | 0.43mi | 5/3.0 (+1) | 2,720 (-5%) | 8mo | $387,940 | $143 | 54 |
| 12038 Parc Aux Chenes | 0.50mi | 5/3.0 (+1) | 2,720 (-5%) | 9mo | $407,995 | $150 | 49 |
| 11423 W Ashton Ln | 0.62mi | 4/3.0 | 2,439 (-15%) | 0mo | $360,000 | $148 | 40 |
| 12018 Parc Aux Chenes | 0.49mi | 5/3.0 (+1) | 2,476 (-14%) | 5mo | $387,707 | $157 | 39 |
Match score weights: distance 35% · size 25% · config 20% · recency 20%. Top-matched comps best support the ARV.
Projected returns pro-forma
-3.0% appreciation · 6.99% rent growth · sell at horizon
- IRR
- 21.7%
- Equity multiple
- 1.93×
- Total profit
- $33,529
- Equity at exit
- $19,160
- IRR
- 32.2%
- Equity multiple
- 4.47×
- Total profit
- $124,892
- Equity at exit
- $11,110
Cash invested: $35,980 (down + closing). Projections, not guarantees.
Landlord ↔ Tenant lean methodology
- Overall (STATE)
- 90 Strongly Landlord-Friendly
- State Mississippi
- 90 Strongly Landlord-Friendly · R+11
- County
- — inherits STATE
- City
- — inherits STATE
ZIP-level market 39503
- Home prices YoY
- -21.5%
- Rents YoY
- 7.0%
- Active inventory
- 763
- Price-to-rent
- 5.5×
Monthly cashflow live
- Estimated rent
- $1,947 medium interval (Pro) →
- Mortgage (P&I)
- −$674
- Tax from tax record
- −$85 /mo · $1,019/yr
- Insurance
- −$54
- HOA
- −$0
- Vacancy / Maint / Mgmt
- −$409
- Net cashflow
- $726
Break-even live
UW: 25.0% down · 7.5% · 30yr · 1.5% tax · 5.0% vac · 8.0% maint · 8.0% mgmt
Financing live
Cash to close
- Down payment
- $32,125
- Closing costs
- $3,855
- Reserves months
- —
- Total cash needed
- —
Loan-product check · same deal, 3 products live
Conventional
25% down · 7.5% · 30yr
- Down + closing
- —
- Monthly P&I
- —
- Monthly cashflow
- —
- DSCR
- —
- Eligible?
- —
Personal DTI + credit; lowest rate.
DSCR
20% down · 8.5% · 30yr
- Down + closing
- —
- Monthly P&I
- —
- Monthly cashflow
- —
- DSCR
- —
- Eligible?
- —
No personal income docs; deal must DSCR.
Hard money
10% down · 12.0% · 12mo
- Down + closing
- —
- Monthly P&I
- —
- Monthly cashflow
- —
- DSCR
- —
- Eligible?
- —
Short-term bridge; refi at stabilization.
Listing history 23 events
-
2026-06-18days on market $128,500 Active 70 DOM
-
2026-06-17days on market $128,500 Active 69 DOM
-
2026-06-16days on market $128,500 Active 68 DOM
-
2026-06-15days on market $128,500 Active 67 DOM
-
2026-06-14days on market $128,500 Active 65 DOM
-
2026-06-13days on market $128,500 Active 64 DOM
-
2026-06-10days on market $128,500 Active 62 DOM
-
2026-06-09days on market $128,500 Active 61 DOM
-
2026-06-08days on market $128,500 Active 60 DOM
-
2026-06-07days on market $128,500 Active 59 DOM
-
2026-06-02days on market $128,500 Active 54 DOM
-
2026-06-01days on market $128,500 Active 53 DOM
-
2026-05-31days on market $128,500 Active 52 DOM
-
2026-05-30days on market $128,500 Active 51 DOM
-
2026-05-18price $128,500 224-char remark
Show marketing remark (224 chars)
This property offers a unique opportunity with two separate living spaces on one parcel. The main home features 3 bedrooms and 2.5 bathrooms and a detached 1 bed, 1 bath apartment. Improved roof, HWH, and electrical wiring.
-
2026-05-04price $135,000 224-char remark
Show marketing remark (224 chars)
This property offers a unique opportunity with two separate living spaces on one parcel. The main home features 3 bedrooms and 2.5 bathrooms and a detached 1 bed, 1 bath apartment. Improved roof, HWH, and electrical wiring.
-
2026-04-09$150,000 Active 224-char remark
Show marketing remark (224 chars)
This property offers a unique opportunity with two separate living spaces on one parcel. The main home features 3 bedrooms and 2.5 bathrooms and a detached 1 bed, 1 bath apartment. Improved roof, HWH, and electrical wiring.
-
2021-10-01historical
-
2018-12-06soldstatus
-
2018-11-30soldstatus
-
2018-06-22$40,000
-
2017-06-20$59,999
-
2017-06-12soldstatus
ⓘ Source: listings_history table (triggers on properties + properties_extension) + one-shot
backfill from property_details.listing_events for pre-trigger history.
Tax reassessment forecast MS · Resets to sale price
- Current annual tax
- $1,019 · $85/mo
- Projected year-2 tax
- $1,019 · $85/mo
- Expected delta
- $0/yr ($0/mo · 0.0%)
ⓘ Screening estimate from a state-policy table — verify with the county assessor before closing.
Climate risk First Street
- Flood 3/10 Moderate FEMA zone X (unshaded) · 10% chance over 30 yrs
- Wildfire 4/10 Moderate
- Heat 10/10 Extreme 7 d/yr ≥107°F today · 21 d/yr by 30 yrs out
- Wind 9/10 Extreme 99% chance of damaging wind over 30 yrs
- Air quality 2/10 Low 1 unhealthy d/yr today · 2 by 30 yrs out
Nearby sold comps map
Loading sold comps map…
Walkable amenities ~0.75 mi
Loading nearby amenities…
Taxation est. · year 1
- Rental income
- $23,366
- − Mortgage interest
- −$7,198
- − Property taxes
- −$1,019
- − Insurance
- −$642
- − Repairs & maintenance
- −$1,869
- − Management
- −$1,869
- − Depreciation
- −$3,738
- Taxable income
- $7,030
- Est. tax owed @ 24.0%
- −$1,687
- After-tax cash flow
- $7,024/yr
For passive investors: Depreciation is non-cash, so a rental often shows a tax loss while cash-flowing — sheltering income. Rental losses are passive: they offset passive income freely, and up to $25,000/yr can offset ordinary (W-2) income if you actively participate and your MAGI is under $100k (phasing out to $0 by $150k); unused losses carry forward. On sale, claimed depreciation is recaptured at up to 25%, and gains may owe capital-gains tax (a 1031 exchange can defer both). Figures are a year-1 estimate at your 24.0% rate — not tax advice; consult a CPA.
Schools (NCES district)
- District
- Harrison County School District
- NCES district ID
- 2801770
- Math proficiency
- 52% ▼ -4.00%
- Reading proficiency
- 46% ▼ -4.00%
- Median HH income
- $46,504
- Composite
- 41.66/100
- National rank
- #3419
- State rank
- #14 of 130 in MS
Livability — Gulfport
- Score
- 73/100
- State rank
- #15
- US rank
- #5010
Category grades
Schools grade is shown separately in the Schools card above.
Census & demographics
- Census place
- Gulfport, MS
- County
- Harrison County · 178,171 people
- City population
- 96,188
- Metro
- Gulfport-Biloxi, MS
- Population (ZIP)
- 55,059
- Household income
- $62,641
- Rent vs Own
- Severe rent burden
- 1686.0
Population outlook (Harrison County) Hauer SSP2
- Today (2025)
- 228,444 people
- By 2030
- 241,942 · +5.9%
- By 2040
- 267,531 · +17.1%
- By 2050
- 291,062 · +27.4%
- By 2075
- 346,711 · +51.8%
- By 2100
- 378,165 · +65.5%
Race, ethnicity, and origin ACS 2023
- Neighborhood character
- Diverse neighborhood (Simpson 0.58)
- Race & ethnicity
- White 58% Black 27% Two or more races 9% Hispanic / Latino 6% Asian 2%
- Hispanic origin (detail)
- Mexican 2% Puerto Rican 1%
- Common ancestry
- Lithuanian 5% Slovak 1% Portuguese 1%
- Foreign-born
- 3% · Canada
- Languages at home
- 95% English-only · Spanish 3%
Political lean MEDSL · Harrison
- 2024 margin
- Strong R (+28.9) · D 35.0% · R 63.9% · Other 1.1%
- 2008→2024 swing
- -2.9pp toward R · 2008: -26.0pp · 2024: -28.9pp
- All cycles
- 2024: R+28.9 2020: R+25.2 2016: R+30.7 2012: R+26.6 2008: R+26.0
Not yet ingested
- Civics
- —
Market trends
- HPI YoY
- ▼ -51.39%
- Current HPI
- 187.285
- Rent YoY
- ▲ 6.99%
- Metro
- Gulfport-Biloxi, MS
- State GDP YoY
- —
- F500 in state
- 0
Price history
+114.2% since first listed9 events — show timeline
- 2026-05-18 Price Changed $128,500 MLSU
- 2026-05-04 Price Changed $135,000 MLSU
- 2026-04-09 Listed $150,000 MLSU
- 2021-10-01 Listing Removed — MLSU
- 2018-12-06 Sold (Public Records) — Public Records
- 2018-11-30 Sold (MLS) — MLSU
- 2018-06-22 Listed $40,000 MLSU
- 2017-06-20 Listed $59,999 MLSU
- 2017-06-12 Sold (Public Records) — Public Records
Property tax history
+8.2%/yrLatest (2025): $1,019 · +5.7% YoY. Source: county tax records.
Cash-flow waterfall
monthlySold comps — $/sqft
last 12 mo · ≤1 miLoading sold comps…