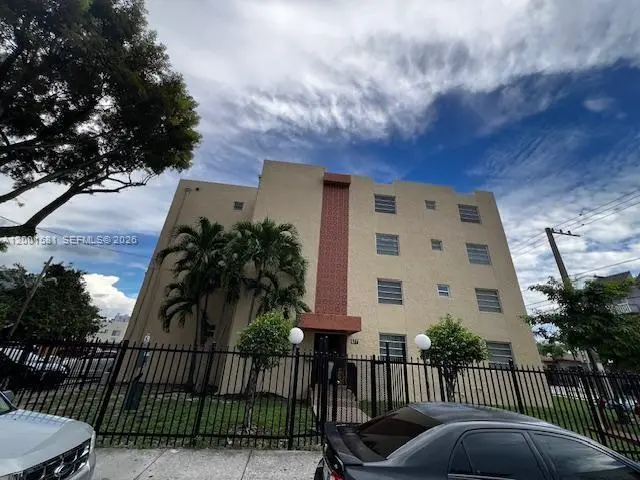
677 SW 9th Ave #205 · Miami, FL
Flood risk 2/10 · Minimal
- FEMA flood zone
- X (unshaded)
- Chance of flooding over 30 yrs
- 0.05%
- Est. flood insurance / yr
- $507 – $1,088
Fire risk 1/10 · Minimal
- Est. fire insurance / yr
- $947 – $1,759
Heat risk 10/10 · Severe
- Hot days now (above 103°F)
- 7 days/yr
- Hot days in 30 yrs
- 30 days/yr
Wind risk 10/10 · Severe
- Chance of severe wind over 30 yrs
- 99.0%
Air-quality risk 2/10 · Minimal
- Unhealthy air days now
- 1 days/yr
- Unhealthy air days in 30 yrs
- 1 days/yr
Risk factors via First Street. Map © Google.
Why this score? — see what drove the B grade
The composite is a weighted blend of 9 inputs, each scored 0–100. Each bar is that input's sub-score; the figure is the points it added to the 100-point composite (weight × sub-score).
- Cash flow +30.0/30.0
- 1% rule +10.0/10.0
- DSCR +10.0/10.0
- ARV discount +7.5/15.0
- Schools +4.2/10.0
- Appreciation +4.1/10.0
- Livability +3.9/5.0
- Condition / age +2.5/5.0
- Rent growth +2.4/5.0
$220,000
🖨 Deal sheet (PDF) 📄 Offer letter ✓ Due diligence
Listing remarks
REDUCED TO SELL!!! LOCATION - LOCATION - LOCATION, LITTLE HAVANA, CLOSE TO DOWNTOWN, 8TH DISTRICT, PASSED 40 & 50 YR CERTIFICATION, RESERVES, GATED BUILDING, REMOTE CONTROLLED ENTRANCE AND SECURED PEDESTIAN ENTRYWAY, GREAT CORNER BUILDING OFFERING UNOBSTRUCTED VIEWS FOR EXTRA LIGHTING, 1/1, 2ND FLOOR UNIT, IN MOVE IN CONDITION, SELLER HAS MADE THE FOLLOWING IMPROVEMENTS: BRAND NEW - NEVER USED STAINLESS STEEL APPLIANCES INCLUDING: REFRIGERATOR, ELECT. RANGE, AND RANGE HOOD, ALSO INSTALLED ALL INPACT GLASS SLIDING DOOR AND WINDOWS WITH PERMITS IN JUNE 2025, A/C SYSTEM WAS REPLACED IN MAY, 2018, PAINTED THE ENTIRE UNIT, REPLACED CEILING LIGHT FIXTURES, NEW HARDWARE ON CABINET DOORS ,
Key facts
- Gated building
- Impact glass windows
- Unobstructed views
Tags
Property features AI
Finance
- Financial info: Pets allowed with size limit (maximum 20 lbs)
- HOA & community: Monthly association fee; Association fee includes management, common areas, laundry, grounds maintenance, structure maintenance, reserve fund, roof, sewer, trash, and water; Association amenities include laundry and elevators
Exterior
- Parking: Assigned parking (one space)
- Security: Phone entry; Complex fenced; Security/high-impact doors
- Utilities: Cable available; Municipal sewer and water included in association; Electric service available
- Home design: Condominium (attached property); Single-level unit within a 4-story building; Entry level: 2; Updated/remodeled; Block construction
- Construction: Block construction; Effective year built
- Exterior features: Balcony; Open balcony/patio; Fence; Security/high-impact doors; Exterior lighting; Complex is fenced; Phone entry
Interior
- Kitchen: Dishwasher; Electric range; Icemaker; Refrigerator
- Bedrooms: Bedroom located on main level; Second-floor entry
- Flooring: Ceramic tile; Tile
- Bathrooms: 1 full bathroom
- Heating & cooling: Central heating; Central air conditioning
- Interior features: Impact glass windows; Breakfast bar; Entrance foyer; Elevator access; Combined living/dining area; Walk-in closet(s); Unfurnished
- Laundry & utility: Common area laundry
Neighborhood map
What this means for you Summary
Snapshot
- This is a 1-bed/1.0-bath condo listed at $220k.
Deal economics
- At list price, monthly cash flow is $1k ($16k/yr) — positive.
- The deal already cash-flows at list — no discount required.
- Meets the 1% rule at list price ($4k rent vs $220k).
- Recommended offer: $213k (3.0% below list) — sets the bar for market timing.
- Cap rate 13.4% vs local median 1.9% in Miami — top-decile yield for the area; either an underpriced asset or a hidden risk that comps aren't pricing in. Stress-test before assuming the spread holds.
Location & tenants
- Location reads 78/100 on livability (#177 in FL, #2,724 nationally) — a middle-class / working-renter tenant base. Strengths: amenities A+, commute A+, health & safety A+; Watch: employment C-, crime F, cost of living F.
- Miami-Dade (suburban): math 45% / reading 54% proficiency, ranked #40 of 73 in FL (top 55%) — families likely to look elsewhere, expect single-tenant / working-renter base with shorter leases; 64% free/reduced lunch — lower-income household profile, screen leases tightly.
- Market conditions: Rents soft (-0.5%/yr); 639 active listings in the ZIP; 10,051 units permitted in Miami-Dade County in 2024 (7,758 in 5+ unit buildings).
- At $4,018/mo this rent would consume 79% of the median local household income ($61k/yr) (locally 5231% of renters already pay >50% of income on rent) — very limited rent-growth headroom before tenants either downsize or default.
Forward outlook
- Local home prices are declining (-1.8%/yr); year-one equity from $2k of loan paydown is wiped out by about $4k of value loss. Plan a longer hold.
- Miami-Dade County population projected at +28% by 2050 — long-run rental-demand tailwind backs the buy-and-hold thesis.
- At projected returns (-1.8% appreciation + 0.0% rent growth), your $62k cash investment doubles in ~5 years — after that, you're playing with house money.
Negotiation context
- It's been on market 45 days — a 3% lower offer ($213k) is reasonable based on typical stale-listing flexibility.
- 3 sale attempts with the ask held roughly flat each time — persistent listings suggest the price (not the market) is what's stuck; bring a comps-based counter.
- Current owner paid $48k; list at $220k implies a 358% gain — meaningful room to come down on a strong offer.
Risks & watch-outs
- Climate carrying-cost: severe wind risk, 99% chance of damaging wind over 30y; extreme-heat days projected 7→30/yr by 2055 (HVAC capex compounding) — expect insurance premiums to compound above CPI over the hold.
Questions for the listing agent
- It's been on market 45 days. Have you received any prior offers? Is the seller open to a 3% concession, seller financing, or rate buy-down credit?
- Built in 1972 — when were the roof, HVAC, electrical panel, plumbing, and water heater last replaced?
- What does the HOA fee cover, when was the last increase, and are there any pending special assessments or reserve-fund shortfalls?
- Any open or pending special assessments — roof, HVAC, plumbing, elevator, façade? What's the per-unit balance and payoff schedule, and is the seller paying it off at close or rolling it to the buyer?
- Is there a deadline driving the sale (1031 exchange, divorce, estate, relocation)? That informs how much negotiation room exists.
- Schools are B-rated — typically a magnet for longer-tenancy family renters. What's the average tenant stay here, and is there a school-zone premium baked into asking?
- Crime grade is F in this area — have there been break-ins, vandalism, or insurance claims at this property in the last 3 years? What carrier currently insures it and at what premium?
- What's the average days-on-market for RENTAL listings here right now (not sales)? A rising rental-DOM trend means longer vacancies and softer asking-rent achievability than the comps imply.
- What's the recent tenant-quality profile in this submarket — average credit score on applications, eviction rate, late-payment / NSF rate, and stable-employment percentage? A property-management company in the area should have these aggregated.
- How much new apartment / multifamily construction is in the pipeline within 1–3 miles? Heavy new supply (>2% of stock underway) typically softens rents 12–24 months out; light construction supports rent growth.
Investment metrics
- 1% rule
- 1.83% ✓
- Cap rate
- 13.44%
- Cash-on-cash
- 25.51%
- DSCR
- 2.14
- GRM
- 4.6
CMA / ARV
No comps found within radius.
Projected returns pro-forma
-1.79% appreciation · 0.0% rent growth · sell at horizon
- IRR
- 18.5%
- Equity multiple
- 1.77×
- Total profit
- $47,621
- Equity at exit
- $44,887
- IRR
- 22.7%
- Equity multiple
- 2.86×
- Total profit
- $114,719
- Equity at exit
- $40,439
Cash invested: $61,600 (down + closing). Projections, not guarantees.
Landlord ↔ Tenant lean methodology
- Overall (STATE)
- 87 Strongly Landlord-Friendly
- State Florida
- 87 Strongly Landlord-Friendly · R+3
- County
- — inherits STATE
- City
- — inherits STATE
ZIP-level market 33130
- Home prices YoY
- -0.5%
- Rents YoY
- -0.5%
- Active inventory
- 639
- Price-to-rent
- 4.6×
Monthly cashflow live
- Estimated rent
- $4,018 medium interval (Pro) →
- Mortgage (P&I)
- −$1,154
- Tax est. 1.5%
- −$275 /mo · $3,300/yr
- Insurance
- −$92
- HOA
- −$344
- Vacancy / Maint / Mgmt
- −$844
- Net cashflow
- $1,310
Break-even live
Sensitivity live
| Price | -10% $1,462 | -5% $1,386 | +0% $1,310 | +5% $1,234 | +10% $1,158 |
|---|---|---|---|---|---|
| Rent | -10% $992 | -5% $1,151 | +0% $1,310 | +5% $1,468 | +10% $1,627 |
| Rate | -1.0pp $1,420 | -0.5pp $1,366 | base $1,310 | +0.5pp $1,253 | +1.0pp $1,195 |
UW: 25.0% down · 7.5% · 30yr · 1.5% tax · 5.0% vac · 8.0% maint · 8.0% mgmt
Financing live
Cash to close
- Down payment
- $55,000
- Closing costs
- $6,600
- Reserves months
- —
- Total cash needed
- —
Loan-product check · same deal, 3 products live
Conventional
25% down · 7.5% · 30yr
- Down + closing
- —
- Monthly P&I
- —
- Monthly cashflow
- —
- DSCR
- —
- Eligible?
- —
Personal DTI + credit; lowest rate.
DSCR
20% down · 8.5% · 30yr
- Down + closing
- —
- Monthly P&I
- —
- Monthly cashflow
- —
- DSCR
- —
- Eligible?
- —
No personal income docs; deal must DSCR.
Hard money
10% down · 12.0% · 12mo
- Down + closing
- —
- Monthly P&I
- —
- Monthly cashflow
- —
- DSCR
- —
- Eligible?
- —
Short-term bridge; refi at stabilization.
HOA detail condo
- Monthly dues
- $344 · $4,128/yr
- Likely covers
- security
- Assessments
- None detected in remarks — confirm with the listing agent.
Listing history 23 events
-
2026-06-18days on market $220,000 Active 45 DOM
-
2026-06-17days on market $220,000 Active 44 DOM
-
2026-06-16days on market $220,000 Active 43 DOM
-
2026-06-15days on market $220,000 Active 42 DOM
-
2026-06-13days on market $220,000 Active 40 DOM
-
2026-06-09days on market $220,000 Active 36 DOM
-
2026-06-08days on market $220,000 Active 35 DOM
-
2026-06-07days on market $220,000 Active 34 DOM
-
2026-06-04days on market $220,000 Active 31 DOM
-
2026-06-03days on market $220,000 Active 30 DOM
-
2026-06-02days on market $220,000 Active 29 DOM
-
2026-06-01days on market $220,000 Active 28 DOM
-
2026-05-31days on market $220,000 Active 27 DOM
-
2026-05-20status Active
-
2026-04-30status Pending
-
2026-04-15price $220,000
-
2026-04-15$230,000 Active
-
2026-04-14historical
-
2025-10-20$230,000 Active
-
2001-12-20soldstatus $48,000
-
1999-08-09soldstatus $41,000
-
1994-09-19soldstatus $40,000
-
1982-07-01soldstatus $45,000
ⓘ Source: listings_history table (triggers on properties + properties_extension) + one-shot
backfill from property_details.listing_events for pre-trigger history.
Climate risk First Street
- Flood 2/10 Low FEMA zone X (unshaded) · 5% chance over 30 yrs
- Wildfire 1/10 Low
- Heat 10/10 Extreme 7 d/yr ≥103°F today · 30 d/yr by 30 yrs out
- Wind 10/10 Extreme 99% chance of damaging wind over 30 yrs
- Air quality 2/10 Low 1 unhealthy d/yr today · 1 by 30 yrs out
Nearby sold comps map
Loading sold comps map…
Walkable amenities ~0.75 mi
Loading nearby amenities…
Taxation est. · year 1
- Rental income
- $48,213
- − Mortgage interest
- −$12,323
- − Property taxes
- −$3,300
- − Insurance
- −$1,100
- − Repairs & maintenance
- −$3,857
- − Management
- −$3,857
- − HOA
- −$4,128
- − Depreciation
- −$6,400
- Taxable income
- $13,248
- Est. tax owed @ 24.0%
- −$3,179
- After-tax cash flow
- $12,537/yr
For passive investors: Depreciation is non-cash, so a rental often shows a tax loss while cash-flowing — sheltering income. Rental losses are passive: they offset passive income freely, and up to $25,000/yr can offset ordinary (W-2) income if you actively participate and your MAGI is under $100k (phasing out to $0 by $150k); unused losses carry forward. On sale, claimed depreciation is recaptured at up to 25%, and gains may owe capital-gains tax (a 1031 exchange can defer both). Figures are a year-1 estimate at your 24.0% rate — not tax advice; consult a CPA.
Schools (NCES district)
- District
- Miami-Dade
- NCES district ID
- 1200390
- Math proficiency
- 45% ▼ -16.00%
- Reading proficiency
- 54% ▼ -5.00%
- Median HH income
- $43,928
- Composite
- 41.76/100
- National rank
- #3397
- State rank
- #40 of 73 in FL
Livability — Miami
- Score
- 78/100
- State rank
- #177
- US rank
- #2724
Category grades
Schools grade is shown separately in the Schools card above.
Census & demographics
- Census place
- Miami, FL
- County
- Miami-Dade County · 2,697,751 people
- City population
- 827,308
- Metro
- Miami-Fort Lauderdale-Pompano Beach, FL
- Population (ZIP)
- 34,964
- Household income
- $61,009
- Rent vs Own
- Severe rent burden
- 5231.0
Population outlook (Miami-Dade County) Hauer SSP2
- Today (2025)
- 3,126,439 people
- By 2030
- 3,325,765 · +6.4%
- By 2040
- 3,697,561 · +18.3%
- By 2050
- 4,012,134 · +28.3%
- By 2075
- 4,605,612 · +47.3%
- By 2100
- 4,866,598 · +55.7%
Race, ethnicity, and origin ACS 2023
- Neighborhood character
- Predominantly Hispanic (73%)
- Race & ethnicity
- Hispanic / Latino 73% Two or more races 44% White 17% Black 4% Asian 3%
- Hispanic origin (detail)
- Mexican 3% Puerto Rican 3% Cuban 24% Dominican 4%
- Common ancestry
- Romanian 2% Estonian 1% Lithuanian 1%
- Foreign-born
- 60% · Canada, Jamaica, Guatemala
- Languages at home
- 23% English-only · Spanish 70% Other Indo-European 2% Russian/Polish/Slavic 1%
Political lean MEDSL · Miami-Dade
- 2024 margin
- R (+11.4) · D 43.9% · R 55.4%
- 2008→2024 swing
- -27.6pp toward R · 2008: 16.1pp · 2024: -11.4pp
- All cycles
- 2024: R+11.4 2020: D+7.3 2016: D+29.6 2012: D+23.7 2008: D+16.1
Not yet ingested
- Civics
- —
Market trends
- HPI YoY
- ▼ -1.79%
- Current HPI
- 344.7752
- Rent YoY
- ▼ -0.53%
- Metro
- Miami-Fort Lauderdale-Pompano Beach, FL
- State GDP YoY
- ▲ 3.28%
- F500 in state
- 36
Industry mix (Fortune 500 HQ in FL)
| Industry | F500 HQs | Revenue |
|---|---|---|
| Industrial Technology | 2 | $29B |
|
||
| Insurance | 2 | $17B |
|
||
| Retail | 1 | $60B |
|
||
| Technology Distribution | 1 | $58B |
|
||
| Homebuilding | 1 | $35B |
|
||
| Technology Manufacturing | 1 | $35B |
|
||
Price history
+388.9% since first listed10 events — show timeline
- 2026-05-20 Relisted — MARMLS
- 2026-04-30 Pending — MARMLS
- 2026-04-15 Price Changed $220,000 MARMLS
- 2026-04-15 Listed $230,000 MARMLS
- 2026-04-14 Listing Removed — MARMLS
- 2025-10-20 Listed $230,000 MARMLS
- 2001-12-20 Sold (Public Records) $48,000 Public Records
- 1999-08-09 Sold (Public Records) $41,000 Public Records
- 1994-09-19 Sold (Public Records) $40,000 Public Records
- 1982-07-01 Sold (Public Records) $45,000 Public Records
Property tax history
-5.2%/yrLatest (2025): $57 · +15.8% YoY. Source: county tax records.
Cash-flow waterfall
monthlySold comps — $/sqft
last 12 mo · ≤1 miLoading sold comps…