 🏗️ New Construction
3510 Grassmere St Unit A/B · Houston, TX
Flood risk 1/10 · Minimal
- FEMA flood zone
- X (unshaded)
- Chance of flooding over 30 yrs
- 0.0%
- Est. flood insurance / yr
- $507 – $1,088
Fire risk 1/10 · Minimal
- Est. fire insurance / yr
- $1,222 – $2,270
Heat risk 9/10 · Severe
- Hot days now (above 109°F)
- 7 days/yr
- Hot days in 30 yrs
- 24 days/yr
Wind risk 9/10 · Severe
- Chance of severe wind over 30 yrs
- 99.0%
Air-quality risk 2/10 · Minimal
- Unhealthy air days now
- 2 days/yr
- Unhealthy air days in 30 yrs
- 2 days/yr
Risk factors via First Street. Map © Google.
Why this score? — see what drove the D+ grade
The composite is a weighted blend of 9 inputs, each scored 0–100. Each bar is that input's sub-score; the figure is the points it added to the 100-point composite (weight × sub-score).
- Cash flow +12.1/30.0
- Appreciation +10.0/10.0
- ARV discount +7.5/15.0
- Rent growth +3.7/5.0
- Livability +3.7/5.0
- DSCR +3.6/10.0
- 1% rule +3.5/10.0
- Schools +2.7/10.0
- Condition / age +2.5/5.0
$578,000
🖨 Deal sheet (PDF) 📄 Offer letter ✓ Due diligence
Multi-family units
County records classify this as Multi-Family (2-4 Unit). Listing-text estimate: 2 units. confirmed
Listing remarks
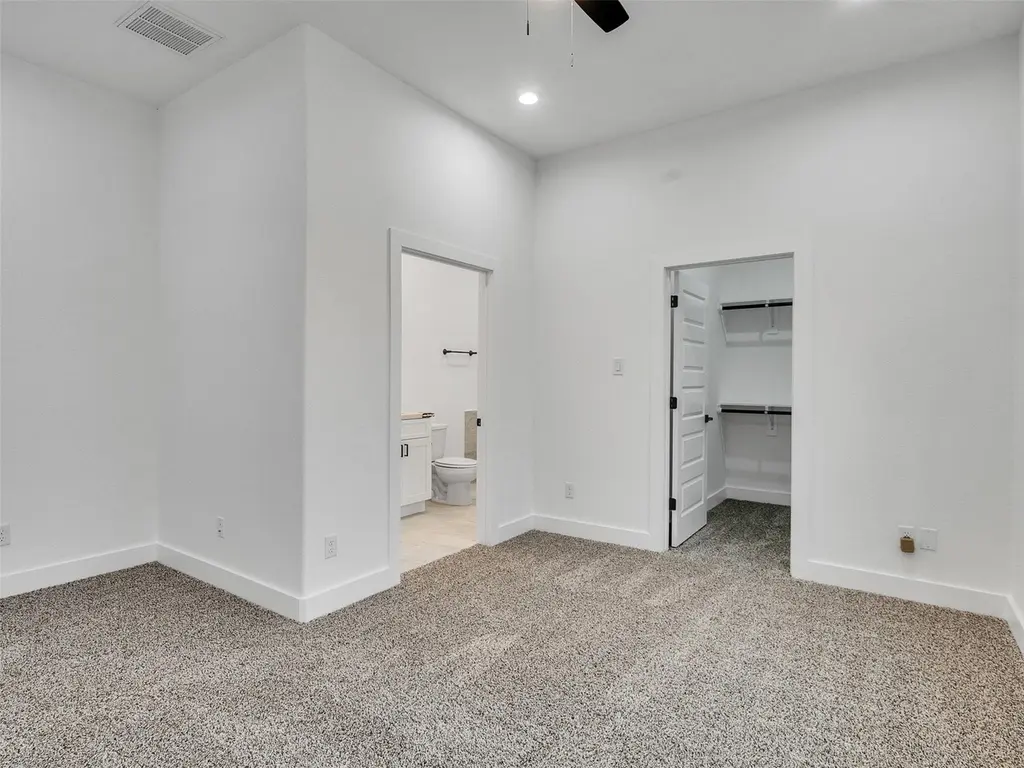
3510 Grassmere St offers a rare opportunity to own a brand-new gated duplex in Houston’s growing Medical Center South area. Each unit features 3 bedrooms, 2.5 bathrooms, and approximately 1,982 SF of modern living space with open-concept layouts, quality finishes, stainless steel appliances, tile and vinyl flooring, and attached garages. Situated on a 7,000 SF lot with full fencing, gated driveway access, landscaping, sidewalks, and gutters. Conveniently located near the Medical Center, Downtown Houston, major freeways, shopping, dining, and universities. Ideal for investors or owner-occupants seeking rental income and modern new construction.
Key facts
- Open-concept layouts
- Full fencing
- Quality finishes
Tags
Property features AI
Finance
- Other: Property listed as residential income (multi-unit with 2 total units); Owner is listing agent (disclosure)
Exterior
- Security: Security gate
- Utilities: Central heating and cooling (electric and gas)
- Home design: Residential income property; New construction (2026); Approximately 3,964 square feet of building area; Lot about 7,000 square feet; Composition roof
- Construction: Built in 2026 by ROCK TOWERS LLC; Composition roof
- Exterior features: Security gate
Interior
- Kitchen: Includes dishwasher, microwave, refrigerator, trash compactor, and disposal
- Bedrooms: Two units, each with 3 bedrooms (total 6 bedrooms)
- Bathrooms: 2 full bathrooms (per unit count unavailable — 2 full baths listed)
- Heating & cooling: Central heating (electric and gas); Central air conditioning (electric and gas); Property has heating and cooling
- Interior features: Dishwasher; Disposal; Microwave; Refrigerator; Trash compactor
Neighborhood map
What this means for you Summary
Snapshot
- This is a 2 × 3.0-bed/2.5-bath units multifamily listed at $578k.
Deal economics
- At list price, monthly cash flow is $-100 ($-1k/yr) — negative. Per door: $-50/mo.
- To cash-flow at today's rent, offer at most $453k (21.6% below list).
- To meet the 1% rule (rent ≥ 1% of price), the offer needs to be $396k (31.4% below list).
- Recommended offer: $396k (31.4% below list) — sets the bar for 1% rule.
- Cap rate 6.0% vs local median 3.2% in Houston — top-decile yield for the area; either an underpriced asset or a hidden risk that comps aren't pricing in. Stress-test before assuming the spread holds.
Location & tenants
- Location reads 74/100 on livability (#184 in TX, #4,771 nationally) — a middle-class / working-renter tenant base. Strengths: amenities A+, cost of living A+, housing A+; Watch: crime F.
- Houston ISD (urban): math 27% / reading 35% proficiency, ranked #593 of 826 in TX (top 72%) — families likely to look elsewhere, expect single-tenant / working-renter base with shorter leases; 71% free/reduced lunch — lower-income household profile, screen leases tightly.
- Zoned schools: Reynolds El (math 8% / reading 8%, grade F, #4,301 of 4,322 statewide, top 100%, 334 students, 98% FRL); Attucks Middle (math 15% / reading 22%, grade F, #1,478 of 1,662 statewide, top 90%, 439 students, 98% FRL); Worthing H S (math 22% / reading 21%, grade F, #1,377 of 1,632 statewide, top 85%, 827 students, 96% FRL) — zoned schools average 97% FRL vs 71% district-wide (26 pts higher); higher-poverty schools than district average — tighter screening recommended.
- Zoned-school proficiency averages 16% at this address vs 31% district-wide (-15 pts) — the specific schools serving this property underperform the Houston ISD average; the district grade overstates school quality for this exact location.
- Market conditions: Rents rising fast (+4.8%/yr); 321 active listings in the ZIP; lower-income renter base — watch delinquency; 29,883 units permitted in Harris County in 2024 (8,621 in 5+ unit buildings).
- At $3,965/mo this rent would consume 127% of the median local household income ($37k/yr) (locally 1446% of renters already pay >50% of income on rent) — very limited rent-growth headroom before tenants either downsize or default.
Forward outlook
- In year one you build about $50k of equity ($3k loan paydown + $47k appreciation (10.0% local appreciation)).
- Harris County population projected at +47% by 2050 — long-run rental-demand tailwind backs the buy-and-hold thesis.
- By year 2, paydown + projected appreciation supports a ~$80k cash-out refi (75% LTV) — recoverable capital for the next deal without selling this one.
Negotiation context
- It's been on market 34 days — a 3% lower offer ($561k) is reasonable based on typical stale-listing flexibility.
Risks & watch-outs
- Climate carrying-cost: severe wind risk, 99% chance of damaging wind over 30y; extreme-heat days projected 7→24/yr by 2055 (HVAC capex compounding) — expect insurance premiums to compound above CPI over the hold.
Questions for the listing agent
- What do current leases actually rent for vs. the listed asking? Can we see a recent rent roll and the last 12 months of T-12 income?
- It's been on market 34 days. Have you received any prior offers? Is the seller open to a 31% concession, seller financing, or rate buy-down credit?
- Can we see the unit-by-unit rent roll, current vacancy, and any below-market leases? What's the average tenancy length?
- What capital expenditures (roof, boiler, parking lot, exteriors) have been made in the last 5 years, and what's planned in the next 2?
- Is there a deadline driving the sale (1031 exchange, divorce, estate, relocation)? That informs how much negotiation room exists.
- Schools are D-rated, which usually means shorter tenancies and higher turnover. Who's the typical renter profile here, and what's been the actual vacancy rate?
- Crime grade is F in this area — have there been break-ins, vandalism, or insurance claims at this property in the last 3 years? What carrier currently insures it and at what premium?
- The area grade is low — what's the realistic commute time and amenity access for the typical tenant pool here? Any planned neighborhood developments (good or bad) we should know about?
- What's the average days-on-market for RENTAL listings here right now (not sales)? A rising rental-DOM trend means longer vacancies and softer asking-rent achievability than the comps imply.
- What's the recent tenant-quality profile in this submarket — average credit score on applications, eviction rate, late-payment / NSF rate, and stable-employment percentage? A property-management company in the area should have these aggregated.
- How much new apartment / multifamily construction is in the pipeline within 1–3 miles? Heavy new supply (>2% of stock underway) typically softens rents 12–24 months out; light construction supports rent growth.
Investment metrics
- 1% rule
- 0.85% ✗
- Cap rate
- 6.04%
- Cash-on-cash
- -0.92%
- DSCR
- 0.96
- GRM
- 9.8
CMA / ARV
- ARV (on-the-fly)
- $467,752
- Comps found
- 2
Show comp detail 2 sales within ~0.75 mi
| Address | Dist | Beds/Ba | Sqft | Sold | Price | $/sf | Match |
|---|---|---|---|---|---|---|---|
| 3105 Grassmere St Unit A/B | 0.38mi | 6/— | 4,028 (+2%) | 11mo | $475,000 | $118 | 71 |
| 3110 Bolt St | 0.51mi | 6/3.0 | 3,416 (-14%) | 19mo | $394,950 | $116 | 29 |
Match score weights: distance 35% · size 25% · config 20% · recency 20%. Top-matched comps best support the ARV.
Projected returns pro-forma
10.0% appreciation · 4.77% rent growth · sell at horizon
- IRR
- 24.2%
- Equity multiple
- 2.95×
- Total profit
- $255,615
- Equity at exit
- $421,388
- IRR
- 21.9%
- Equity multiple
- 6.91×
- Total profit
- $773,550
- Equity at exit
- $908,739
Cash invested: $130,971 (down + closing). Projections, not guarantees.
Landlord ↔ Tenant lean methodology
- Overall (STATE)
- 87 Strongly Landlord-Friendly
- State Texas
- 87 Strongly Landlord-Friendly · R+5
- County
- — inherits STATE
- City
- — inherits STATE
ZIP-level market 77051
- Home prices YoY
- 9.7%
- Rents YoY
- 4.8%
- Active inventory
- 321
- Price-to-rent
- 24.3×
Monthly cashflow live
- Estimated rent
- $3,965 high interval (Pro) →
- Mortgage (P&I)
- −$2,453
- Tax est. 1.5%
- −$585 /mo · $7,016/yr
- Insurance
- −$195
- HOA
- −$0
- Vacancy / Maint / Mgmt
- −$833
- Net cashflow
- $-100
Break-even live
Sensitivity live
| Price | -10% $223 | -5% $61 | +0% $-100 | +5% $-262 | +10% $-423 |
|---|---|---|---|---|---|
| Rent | -10% $-413 | -5% $-257 | +0% $-100 | +5% $56 | +10% $213 |
| Rate | -1.0pp $135 | -0.5pp $19 | base $-100 | +0.5pp $-221 | +1.0pp $-345 |
2-unit breakdown (identical units grouped — click to expand)
| Units | Beds | Baths | Est. rent |
|---|---|---|---|
| 2× units | 3.0 | 2.5 | $3,964 |
| #1 | 3.0 | 2.5 | $1,982 |
| #2 | 3.0 | 2.5 | $1,982 |
| Total (2 units) | $3,965 | ||
UW: 25.0% down · 7.5% · 30yr · 1.5% tax · 5.0% vac · 8.0% maint · 8.0% mgmt
Financing live
Cash to close
- Down payment
- $116,938
- Closing costs
- $14,033
- Reserves months
- —
- Total cash needed
- —
Loan-product check · same deal, 3 products live
Conventional
25% down · 7.5% · 30yr
- Down + closing
- —
- Monthly P&I
- —
- Monthly cashflow
- —
- DSCR
- —
- Eligible?
- —
Personal DTI + credit; lowest rate.
DSCR
20% down · 8.5% · 30yr
- Down + closing
- —
- Monthly P&I
- —
- Monthly cashflow
- —
- DSCR
- —
- Eligible?
- —
No personal income docs; deal must DSCR.
Hard money
10% down · 12.0% · 12mo
- Down + closing
- —
- Monthly P&I
- —
- Monthly cashflow
- —
- DSCR
- —
- Eligible?
- —
Short-term bridge; refi at stabilization.
Listing history 13 events
-
2026-06-21days on market $578,000 Active 34 DOM
-
2026-06-18days on market $578,000 Active 31 DOM
-
2026-06-17days on market $578,000 Active 30 DOM
-
2026-06-16days on market $578,000 Active 29 DOM
-
2026-06-15days on market $578,000 Active 28 DOM
-
2026-06-13days on market $578,000 Active 26 DOM
-
2026-06-10days on market $578,000 Active 22 DOM
-
2026-06-08days on market $578,000 Active 21 DOM
-
2026-06-07days on market $578,000 Active 20 DOM
-
2026-06-04days on market $578,000 Active 17 DOM
-
2026-06-01days on market $578,000 Active 14 DOM
-
2026-05-31days on market $578,000 Active 13 DOM
-
2026-05-18$578,000 Active
ⓘ Source: listings_history table (triggers on properties + properties_extension) + one-shot
backfill from property_details.listing_events for pre-trigger history.
Climate risk First Street
- Flood 1/10 Low FEMA zone X (unshaded) · 0% chance over 30 yrs
- Wildfire 1/10 Low
- Heat 9/10 Extreme 7 d/yr ≥109°F today · 24 d/yr by 30 yrs out
- Wind 9/10 Extreme 99% chance of damaging wind over 30 yrs
- Air quality 2/10 Low 2 unhealthy d/yr today · 2 by 30 yrs out
Nearby sold comps map
Loading sold comps map…
Walkable amenities ~0.75 mi
Loading nearby amenities…
Taxation est. · year 1
- Rental income
- $47,580
- − Mortgage interest
- −$26,201
- − Property taxes
- −$7,016
- − Insurance
- −$2,339
- − Repairs & maintenance
- −$3,806
- − Management
- −$3,806
- − Depreciation
- −$13,607
- Taxable loss
- −$9,197
- Est. tax savings @ 24.0%
- +$2,207
- After-tax cash flow
- $1,005/yr
For passive investors: Depreciation is non-cash, so a rental often shows a tax loss while cash-flowing — sheltering income. Rental losses are passive: they offset passive income freely, and up to $25,000/yr can offset ordinary (W-2) income if you actively participate and your MAGI is under $100k (phasing out to $0 by $150k); unused losses carry forward. On sale, claimed depreciation is recaptured at up to 25%, and gains may owe capital-gains tax (a 1031 exchange can defer both). Figures are a year-1 estimate at your 24.0% rate — not tax advice; consult a CPA.
Schools (NCES district)
- District
- Houston ISD
- NCES district ID
- 4823640
- Math proficiency
- 27% ▼ -18.00%
- Reading proficiency
- 35% ▼ -6.00%
- Median HH income
- $46,054
- Composite
- 26.63/100
- National rank
- #7173
- State rank
- #593 of 826 in TX
Livability — Houston
- Score
- 74/100
- State rank
- #184
- US rank
- #4771
Category grades
Schools grade is shown separately in the Schools card above.
Census & demographics
- Census place
- Houston, TX
- County
- Harris County · 4,702,590 people
- City population
- 3,226,434
- Metro
- Houston-The Woodlands-Sugar Land, TX
- Population (ZIP)
- 19,795
- Household income
- $37,415
- Rent vs Own
- Severe rent burden
- 1446.0
Population outlook (Harris County) Hauer SSP2
- Today (2025)
- 5,571,493 people
- By 2030
- 6,089,821 · +9.3%
- By 2040
- 7,142,806 · +28.2%
- By 2050
- 8,185,864 · +46.9%
- By 2075
- 10,574,329 · +89.8%
- By 2100
- 12,109,958 · +117.4%
Race, ethnicity, and origin ACS 2023
- Neighborhood character
- Predominantly Black (77%)
- Race & ethnicity
- Black 77% Hispanic / Latino 16% Two or more races 11% White 3%
- Hispanic origin (detail)
- Mexican 6% Puerto Rican 1%
- Foreign-born
- 8% · Canada, China
- Languages at home
- 88% English-only · Spanish 10%
Political lean MEDSL · Harris
- 2024 margin
- Lean D (+5.5) · D 52.0% · R 46.4% · Other 1.6%
- 2008→2024 swing
- +3.9pp toward D · 2008: 1.6pp · 2024: 5.5pp
- All cycles
- 2024: D+5.5 2020: D+13.3 2016: D+12.4 2012: D+0.1 2008: D+1.6
Not yet ingested
- Civics
- —
Market trends
- HPI YoY
- ▲ 16.02%
- Current HPI
- 180.4283
- Rent YoY
- ▲ 4.77%
- Metro
- Houston-The Woodlands-Sugar Land, TX
- State GDP YoY
- ▲ 3.95%
- F500 in state
- 110
Industry mix (Fortune 500 HQ in TX)
| Industry | F500 HQs | Revenue |
|---|---|---|
| Energy | 16 | $1,198B |
|
||
| Technology | 5 | $198B |
|
||
| Engineering / Construction | 4 | $72B |
|
||
| Energy Services | 3 | $60B |
|
||
| Utilities | 3 | $41B |
|
||
| Healthcare | 2 | $330B |
|
||
Price history
1 event — show timeline
- 2026-05-18 Listed $578,000 HARMLS
Cash-flow waterfall
monthlySold comps — $/sqft
last 12 mo · ≤1 miLoading sold comps…