 🏷️ Likely Rental
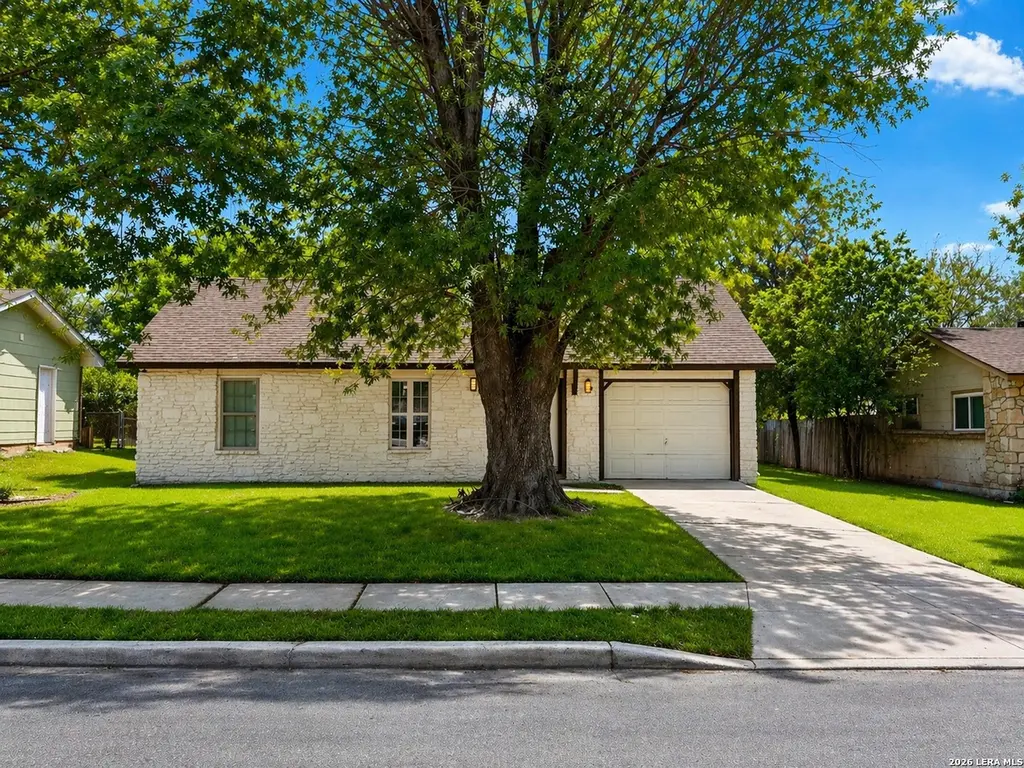
4310 Avenida Prima · San Antonio, TX
Flood risk 1/10 · Minimal
- FEMA flood zone
- X (unshaded)
- Chance of flooding over 30 yrs
- 0.0%
- Est. flood insurance / yr
- $507 – $1,088
Fire risk 1/10 · Minimal
- Est. fire insurance / yr
- $1,222 – $2,270
Heat risk 8/10 · Major
- Hot days now (above 108°F)
- 7 days/yr
- Hot days in 30 yrs
- 22 days/yr
Wind risk 8/10 · Major
- Chance of severe wind over 30 yrs
- 80.0%
Air-quality risk 2/10 · Minimal
- Unhealthy air days now
- 0 days/yr
- Unhealthy air days in 30 yrs
- 1 days/yr
Risk factors via First Street. Map © Google.
Why this score? — see what drove the D grade
The composite is a weighted blend of 9 inputs, each scored 0–100. Each bar is that input's sub-score; the figure is the points it added to the 100-point composite (weight × sub-score).
- ARV discount +15.0/15.0
- Cash flow +8.1/30.0
- Livability +4.0/5.0
- Schools +3.8/10.0
- 1% rule +3.3/10.0
- Rent growth +2.5/5.0
- Condition / age +2.5/5.0
- DSCR +2.1/10.0
- Appreciation +0.0/10.0
$200,000
🖨 Deal sheet 📄 Offer letter ✓ Due diligence
Listing remarks MLS
Great investment opportunity or perfect for house hacking! This unique property features a 3-bedroom, 1-bath main home plus an attached 1-bedroom, 1-bath studio apartment with its own private entrance. The studio was previously rented for $900/month (utilities included), offering immediate income potential. The main home includes a cozy wood-burning fireplace, a functional layout, and a one-car garage. Sitting on a large lot with no HOA, there is plenty of space to expand-add detached units or create additional income-producing opportunities. Conveniently located within walking distance to HEB, Bowlero, and a variety of restaurants, this property combines location, flexibility, and value. Property does need some TLC and is priced accordingly, great upside potential for investors or buyers looking to build equity.
Key facts
- Large lot
- Private entrance
- No hoa
Tags
Neighborhood map
What this means for you Summary
Snapshot
- This is a 3-bed/1.0-bath single-family listed at $200k.
Deal economics
- At list price, monthly cash flow is $-199 ($-2k/yr) — negative.
- To cash-flow at today's rent, offer at most $165k (17.6% below list).
- To meet the 1% rule (rent ≥ 1% of price), the offer needs to be $165k (17.5% below list).
- Recommended offer: $165k (17.6% below list) — sets the bar for cash-flow.
- Cap rate 5.1% vs local median 3.8% in San Antonio — top-decile yield for the area; either an underpriced asset or a hidden risk that comps aren't pricing in. Stress-test before assuming the spread holds.
Location & tenants
- Location reads 80/100 on livability (#31 in TX, #1,616 nationally) — a professional / high-income tenant draw. Strengths: amenities A+, commute A+, cost of living A+; Watch: schools C-, crime F.
- North East ISD (urban): math 38% / reading 49% proficiency, ranked #276 of 826 in TX (top 33%) — families likely to look elsewhere, expect single-tenant / working-renter base with shorter leases.
- Market conditions: Rents soft (-0.1%/yr); 299 active listings in the ZIP; 40 comparable units currently listed for rent nearby; rentals at typical pace (median 24d on market — plan ~3-4 weeks tenant-placement turnaround); solid renter incomes; 8,308 units permitted in Bexar County in 2024 (2,506 in 5+ unit buildings).
Forward outlook
- Local home prices are declining (-3.0%/yr); year-one equity from $1k of loan paydown is wiped out by about $6k of value loss. Plan a longer hold.
- Bexar County population projected at +50% by 2050 — long-run rental-demand tailwind backs the buy-and-hold thesis.
Negotiation context
- It's been on market 69 days — a 6% lower offer ($188k) is reasonable based on typical stale-listing flexibility.
Risks & watch-outs
- Climate carrying-cost: severe wind risk, 80% chance of damaging wind over 30y; extreme-heat days projected 7→22/yr by 2055 (HVAC capex compounding) — expect insurance premiums to compound above CPI over the hold.
Questions for the listing agent
- What do current leases actually rent for vs. the listed asking? Can we see a recent rent roll and the last 12 months of T-12 income?
- It's been on market 69 days. Have you received any prior offers? Is the seller open to a 18% concession, seller financing, or rate buy-down credit?
- Built in 1970 — when were the roof, HVAC, electrical panel, plumbing, and water heater last replaced?
- Why hasn't it sold? Are there any deal-killer items the seller is aware of (foundation, flood, title, zoning, code violations)?
- Is there a deadline driving the sale (1031 exchange, divorce, estate, relocation)? That informs how much negotiation room exists.
- Crime grade is F in this area — have there been break-ins, vandalism, or insurance claims at this property in the last 3 years? What carrier currently insures it and at what premium?
- The area grade is low — what's the realistic commute time and amenity access for the typical tenant pool here? Any planned neighborhood developments (good or bad) we should know about?
- What's the average days-on-market for RENTAL listings here right now (not sales)? A rising rental-DOM trend means longer vacancies and softer asking-rent achievability than the comps imply.
- What's the recent tenant-quality profile in this submarket — average credit score on applications, eviction rate, late-payment / NSF rate, and stable-employment percentage? A property-management company in the area should have these aggregated.
- How much new for-sale + rental construction is in the pipeline within 1–3 miles? Heavy new supply typically softens prices + rents 12–24 months out; constrained supply supports both.
Investment metrics
- 1% rule
- 0.83% ✗
- Cap rate
- 5.10%
- Cash-on-cash
- -4.27%
- DSCR
- 0.81
- GRM
- 10.1
CMA / ARV
- ARV (median comp)
- $283,675
- List price
- $200,000
- Delta
- -29.50%
- Verdict
- UNDERPRICED
- Comps
- 2 within 1.0 mi
Show comp detail 12 sales within ~0.75 mi
| Address | Dist | Beds/Ba | Sqft | Sold | Price | $/sf | Match |
|---|---|---|---|---|---|---|---|
| 4310 Las Cruces | 0.06mi | 3/2.0 | 1,725 (+9%) | 6mo | $249,777 | $145 | 74 |
| 4423 Las Cruces | 0.16mi | 4/2.0 (+1) | 1,675 (+6%) | 1mo | $247,500 | $148 | 73 |
| 4314 Las Cruces St | 0.06mi | 2/2.0 (-1) | 1,511 (-5%) | 11mo | $205,000 | $136 | 71 |
| 4427 Las Cruces | 0.18mi | 4/2.0 (+1) | 1,692 (+6%) | 2mo | $250,000 | $148 | 70 |
| 4803 Casa Bello | 0.54mi | 3/2.0 | 1,618 (+2%) | 7mo | $190,000 | $117 | 62 |
| 4247 Bayliss | 0.53mi | 3/2.0 | 1,520 (-4%) | 4mo | $225,000 | $148 | 61 |
| 11314 El Sendero | 0.25mi | 3/2.0 | 1,417 (-11%) | 8mo | $206,000 | $145 | 60 |
| 11218 El Sendero | 0.36mi | 3/2.0 | 1,472 (-7%) | 9mo | $225,000 | $153 | 59 |
| 4350 Eagle Nest | 0.37mi | 4/2.0 (+1) | 1,434 (-10%) | 1mo | $230,000 | $160 | 57 |
| 4902 El Presidio | 0.69mi | 3/2.0 | 1,499 (-6%) | 1mo | $224,999 | $150 | 54 |
| 12630 Thistle Down | 0.55mi | 3/2.0 | 1,711 (+8%) | 10mo | $275,000 | $161 | 49 |
| 11947 Alamo Blanco | 0.39mi | 4/2.0 (+1) | 1,792 (+13%) | 5mo | $237,500 | $133 | 47 |
Match score weights: distance 35% · size 25% · config 20% · recency 20%. Top-matched comps best support the ARV.
Projected returns pro-forma
-3.0% appreciation · 0.0% rent growth · sell at horizon
- IRR
- -27.2%
- Equity multiple
- 0.11×
- Total profit
- $-49,829
- Equity at exit
- $29,821
- IRR
- -42.8%
- Equity multiple
- -0.39×
- Total profit
- $-78,008
- Equity at exit
- $17,292
Cash invested: $56,000 (down + closing). Projections, not guarantees.
Landlord ↔ Tenant lean methodology
- Overall (STATE)
- 87 Strongly Landlord-Friendly
- State Texas
- 87 Strongly Landlord-Friendly · R+5
- County
- — inherits STATE
- City
- — inherits STATE
ZIP-level market 78233
- Home prices YoY
- -31.0%
- Rents YoY
- -0.1%
- Active inventory
- 299
- Price-to-rent
- 10.1×
Monthly cashflow live
- Estimated rent
- $1,650 high interval (Pro) →
- Mortgage (P&I)
- −$1,049
- Tax from tax record
- −$371 /mo · $4,447/yr
- Insurance
- −$83
- HOA
- −$0
- Vacancy / Maint / Mgmt
- −$347
- Net cashflow
- $-199
Break-even live
UW: 25.0% down · 7.5% · 30yr · 1.5% tax · 5.0% vac · 8.0% maint · 8.0% mgmt
Financing live
Cash to close
- Down payment
- $50,000
- Closing costs
- $6,000
- Reserves months
- —
- Total cash needed
- —
Loan-product check · same deal, 3 products live
Conventional
25% down · 7.5% · 30yr
- Down + closing
- —
- Monthly P&I
- —
- Monthly cashflow
- —
- DSCR
- —
- Eligible?
- —
Personal DTI + credit; lowest rate.
DSCR
20% down · 8.5% · 30yr
- Down + closing
- —
- Monthly P&I
- —
- Monthly cashflow
- —
- DSCR
- —
- Eligible?
- —
No personal income docs; deal must DSCR.
Hard money
10% down · 12.0% · 12mo
- Down + closing
- —
- Monthly P&I
- —
- Monthly cashflow
- —
- DSCR
- —
- Eligible?
- —
Short-term bridge; refi at stabilization.
Rent comps 40 comps
| Address | Beds | Baths | Sqft | Rent | $/sqft | DOM | Units | Dist |
|---|---|---|---|---|---|---|---|---|
| 4426 Avenida Prima St San Antonio, TX | 4.0 | 2.0 | 1144 | $1,550 | $1.35 | 24d | 1 | 0.21mi |
| 4322 Vespero San Antonio, TX | 3.0 | 2.0 | 1499 | $1,600 | $1.07 | 16d | 1 | 0.23mi |
| 4411 Terra Summit Rd San Antonio, TX | 3.0 | 2.0 | 1193 | $1,300 | $1.09 | 24d | 1 | 0.31mi |
| 11214 Center Point Rd San Antonio, TX | 3.0 | 2.0 | 1180 | $1,320 | $1.12 | 44d | 1 | 0.36mi |
| 4438 Bayliss St San Antonio, TX | 3.0 | 2.0 | 1320 | $1,750 | $1.33 | 18d | 1 | 0.43mi |
| 12617 Thistle Down San Antonio, TX | 3.0 | 2.0 | 1621 | $1,875 | $1.16 | 15d | 1 | 0.53mi |
| 335 Harmony Ct San Antonio, TX | 2.0 | 1.5 | 1220 | $1,195 | $0.98 | 44d | 1 | 0.55mi |
| 4242 Bayliss St San Antonio, TX | 3.0 | 2.0 | 1446 | $1,725 | $1.19 | 44d | 1 | 0.59mi |
| 4755 Casa Oro St San Antonio, TX | 4.0 | 1.5 | 1377 | $1,525 | $1.11 | 24d | 1 | 0.59mi |
| 12133 El Sendero St San Antonio, TX | 2.0 | 1.5 | 1100 | $1,375 | $1.25 | 44d | 1 | 0.62mi |
| 4915 Sierra Madre San Antonio, TX | 3.0 | 2.0 | 1596 | $1,495 | $0.94 | 11d | 1 | 0.68mi |
| 12619 Woodbrace St San Antonio, TX | 2.0 | 2.5 | 1843 | $2,100 | $1.14 | 18d | 1 | 0.69mi |
| 4910 El Presidio Dr San Antonio, TX | 3.0 | 2.0 | 1600 | $1,700 | $1.06 | 24d | 1 | 0.70mi |
| 4827 Casa Grande St San Antonio, TX | 3.0 | 2.0 | 1125 | $1,650 | $1.47 | 8d | 1 | 0.71mi |
| 4911 Casa Grande St San Antonio, TX | 3.0 | 2.0 | 1196 | $2,000 | $1.67 | 24d | 1 | 0.76mi |
| 12635 Scarsdale St San Antonio, TX | 1.0–2.0 | 1.0–2.0 | 900 | $1,540 | $1.71 | 3d | 18 | 0.76mi |
| 4278 Putting Grn San Antonio, TX | 2.0 | 2.0 | 1974 | $2,995 | $1.52 | 44d | 1 | 0.93mi |
| 3919 Perrin Central Blvd San Antonio, TX | 1.0–2.0 | 1.0–2.0 | 778 | $1,185 | $1.52 | 3d | 44 | 0.94mi |
| 3800 Perrin Central Blvd San Antonio, TX | 1.0–3.0 | 1.0–2.0 | 940 | $1,769 | $1.88 | 44d | 38 | 0.99mi |
| 3800 Perrin Central Blvd San Antonio, TX | 1.0–3.0 | 1.0–2.0 | 940 | $1,789 | $1.90 | 24d | 35 | 0.99mi |
| 4623 Erin Blvd San Antonio, TX | 2.0 | 1.0 | 1056 | $1,350 | $1.28 | 24d | 1 | 1.01mi |
| 3902 Perrin Central Blvd San Antonio, TX | 1.0–2.0 | 1.0–2.0 | 777 | $1,428 | $1.84 | 2d | 32 | 1.04mi |
| 13031 Park Xing San Antonio, TX | 1.0–3.0 | 1.0–2.5 | 1070 | $2,051 | $1.92 | 2d | 22 | 1.04mi |
| 4410 Putting Grn San Antonio, TX | 3.0 | 2.0 | 1324 | $1,770 | $1.34 | 44d | 1 | 1.06mi |
| 5411 Encanta St San Antonio, TX | 3.0 | 1.5 | 1053 | $1,435 | $1.36 | 44d | 1 | 1.08mi |
| 4318 Windswept San Antonio, TX | 3.0 | 2.0 | 1958 | $1,995 | $1.02 | 2d | 1 | 1.09mi |
| 4502 Longvale Dr San Antonio, TX | 3.0 | 2.0 | 1092 | $1,600 | $1.47 | 4d | 1 | 1.20mi |
| 4815 Sorrento San Antonio, TX | 3.0 | 2.0 | 1312 | $1,550 | $1.18 | 4d | 1 | 1.22mi |
| 4815 Sorrento San Antonio, TX | 3.0 | 2.0 | 1312 | $1,550 | $1.18 | 24d | 1 | 1.22mi |
| 4527 Clear Spring Dr San Antonio, TX | 3.0 | 1.5 | 1098 | $1,350 | $1.23 | 24d | 1 | 1.24mi |
| 13408 Bristow Dawn San Antonio, TX | 3.0 | 2.5 | 1497 | $1,450 | $0.97 | 24d | 1 | 1.25mi |
| 13313 Bristow Dawn San Antonio, TX | 3.0 | 2.5 | 1615 | $2,200 | $1.36 | 44d | 1 | 1.26mi |
| 12426 Magnifico St San Antonio, TX | 3.0 | 2.0 | 1501 | $2,000 | $1.33 | 44d | 1 | 1.26mi |
| 13416 Bristow Dawn San Antonio, TX | 2.0 | 2.5 | 1281 | $1,450 | $1.13 | 15d | 1 | 1.27mi |
| 13309 Bristow Dawn San Antonio, TX | 3.0 | 2.5 | 1454 | $1,475 | $1.01 | 24d | 1 | 1.27mi |
| 4138 Clear Spring Dr San Antonio, TX | 3.0 | 2.0 | 1435 | $1,650 | $1.15 | 44d | 1 | 1.29mi |
| 13516 Bristow Dawn San Antonio, TX | 2.0 | 2.5 | 1281 | $1,425 | $1.11 | 14d | 1 | 1.30mi |
| 13530 Bristow Dawn San Antonio, TX | 3.0 | 2.5 | 1614 | $1,550 | $0.96 | 44d | 1 | 1.30mi |
| 12714 La Quinta San Antonio, TX | 3.0 | 2.0 | 1626 | $1,950 | $1.20 | 24d | 1 | 1.35mi |
| 13422 Patmore Dr San Antonio, TX | 3.0 | 2.0 | 1272 | $1,495 | $1.18 | 24d | 1 | 1.36mi |
Listing history 18 events
-
2026-06-18days on market $200,000 Active 69 DOM
-
2026-06-17days on market $200,000 Active 68 DOM
-
2026-06-16days on market $200,000 Active 67 DOM
-
2026-06-13days on market $200,000 Active 64 DOM
-
2026-06-13days on market $200,000 Active 63 DOM
-
2026-06-09days on market $200,000 Active 60 DOM
-
2026-06-08statusdays on market $200,000 Active 59 DOM
-
2026-06-07days on market $200,000 Back on Market 58 DOM
-
2026-06-04days on market $200,000 Back on Market 55 DOM
-
2026-06-03days on market $200,000 Back on Market 54 DOM
-
2026-06-02days on market $200,000 Back on Market 53 DOM
-
2026-06-01days on market $200,000 Back on Market 52 DOM
-
2026-05-31days on market $200,000 Back on Market 51 DOM
-
2026-04-10$200,000 New 824-char remark
Show marketing remark (824 chars)
Great investment opportunity or perfect for house hacking! This unique property features a 3-bedroom, 1-bath main home plus an attached 1-bedroom, 1-bath studio apartment with its own private entrance. The studio was previously rented for $900/month (utilities included), offering immediate income potential. The main home includes a cozy wood-burning fireplace, a functional layout, and a one-car garage. Sitting on a large lot with no HOA, there is plenty of space to expand-add detached units or create additional income-producing opportunities. Conveniently located within walking distance to HEB, Bowlero, and a variety of restaurants, this property combines location, flexibility, and value. Property does need some TLC and is priced accordingly, great upside potential for investors or buyers looking to build equity.
-
2013-08-14soldstatus
-
2010-03-25soldstatus
-
2008-12-17soldstatus
-
1994-10-01soldstatus
ⓘ Source: listings_history table (triggers on properties + properties_extension) + one-shot
backfill from property_details.listing_events for pre-trigger history.
Tax reassessment forecast TX · Resets to sale price
- Current annual tax
- $4,447 · $371/mo
- Projected year-2 tax
- $4,447 · $371/mo
- Expected delta
- $0/yr ($0/mo · 0.0%)
ⓘ Screening estimate from a state-policy table — verify with the county assessor before closing.
Climate risk First Street
- Flood 1/10 Low FEMA zone X (unshaded) · 0% chance over 30 yrs
- Wildfire 1/10 Low
- Heat 8/10 Severe 7 d/yr ≥108°F today · 22 d/yr by 30 yrs out
- Wind 8/10 Severe 80% chance of damaging wind over 30 yrs
- Air quality 2/10 Low 0 unhealthy d/yr today · 1 by 30 yrs out
Nearby sold comps map
Loading sold comps map…
Walkable amenities ~0.75 mi
Loading nearby amenities…
Taxation est. · year 1
- Rental income
- $19,801
- − Mortgage interest
- −$11,203
- − Property taxes
- −$4,447
- − Insurance
- −$1,000
- − Repairs & maintenance
- −$1,584
- − Management
- −$1,584
- − Depreciation
- −$5,818
- Taxable loss
- −$5,835
- Est. tax savings @ 24.0%
- +$1,400
- After-tax cash flow
- $-989/yr
For passive investors: Depreciation is non-cash, so a rental often shows a tax loss while cash-flowing — sheltering income. Rental losses are passive: they offset passive income freely, and up to $25,000/yr can offset ordinary (W-2) income if you actively participate and your MAGI is under $100k (phasing out to $0 by $150k); unused losses carry forward. On sale, claimed depreciation is recaptured at up to 25%, and gains may owe capital-gains tax (a 1031 exchange can defer both). Figures are a year-1 estimate at your 24.0% rate — not tax advice; consult a CPA.
Schools (NCES district)
- District
- North East ISD
- NCES district ID
- 4832940
- Math proficiency
- 38% ▼ -14.00%
- Reading proficiency
- 49% ▼ -4.00%
- Median HH income
- $57,715
- Composite
- 38.1/100
- National rank
- #4276
- State rank
- #276 of 826 in TX
Livability — San Antonio
- Score
- 80/100
- State rank
- #31
- US rank
- #1616
Category grades
Schools grade is shown separately in the Schools card above.
Census & demographics
- Census place
- San Antonio, TX
- County
- Bexar County · 1,990,555 people
- City population
- 1,806,925
- Metro
- San Antonio-New Braunfels, TX
- Population (ZIP)
- 48,911
- Household income
- $76,421
- Rent vs Own
- Severe rent burden
- 1635.0
Population outlook (Bexar County) Hauer SSP2
- Today (2025)
- 2,336,851 people
- By 2030
- 2,560,728 · +9.6%
- By 2040
- 3,020,569 · +29.3%
- By 2050
- 3,493,522 · +49.5%
- By 2075
- 4,668,459 · +99.8%
- By 2100
- 5,533,242 · +136.8%
Race, ethnicity, and origin ACS 2023
- Neighborhood character
- Diverse neighborhood (Simpson 0.62)
- Race & ethnicity
- Hispanic / Latino 52% White 31% Two or more races 23% Black 11% Asian 3% Native American 1%
- Hispanic origin (detail)
- Mexican 42% Puerto Rican 3%
- Common ancestry
- Romanian 1% Lithuanian 1% Italian 1%
- Foreign-born
- 12% · Canada, South Korea, Vietnam
- Languages at home
- 69% English-only · Spanish 27% Korean 1% Other Asian/Pacific 1%
Political lean MEDSL · Bexar
- 2024 margin
- Lean D (+9.8) · D 54.3% · R 44.6% · Other 1.1%
- 2008→2024 swing
- +4.2pp toward D · 2008: 5.6pp · 2024: 9.8pp
- All cycles
- 2024: D+9.8 2020: D+18.2 2016: D+13.5 2012: D+4.6 2008: D+5.6
Not yet ingested
- Civics
- —
Market trends
- HPI YoY
- ▼ -123.27%
- Current HPI
- 274.943
- Rent YoY
- ▼ -0.06%
- Metro
- San Antonio-New Braunfels, TX
- State GDP YoY
- ▲ 3.95%
- F500 in state
- 110
Industry mix (Fortune 500 HQ in TX)
| Industry | F500 HQs | Revenue |
|---|---|---|
| Energy | 16 | $1,198B |
|
||
| Technology | 5 | $198B |
|
||
| Engineering / Construction | 4 | $72B |
|
||
| Energy Services | 3 | $60B |
|
||
| Utilities | 3 | $41B |
|
||
| Healthcare | 2 | $330B |
|
||
Price history
5 events — show timeline
- 2026-04-10 Listed $200,000 LERA
- 2013-08-14 Sold (Public Records) — Public Records
- 2010-03-25 Sold (Public Records) — Public Records
- 2008-12-17 Sold (Public Records) — Public Records
- 1994-10-01 Sold (Public Records) — Public Records
Property tax history
+8.3%/yrLatest (2025): $4,447 · +1.0% YoY. Source: county tax records.
Cash-flow waterfall
monthlySold comps — $/sqft
last 12 mo · ≤1 miLoading sold comps…