 Fourplex
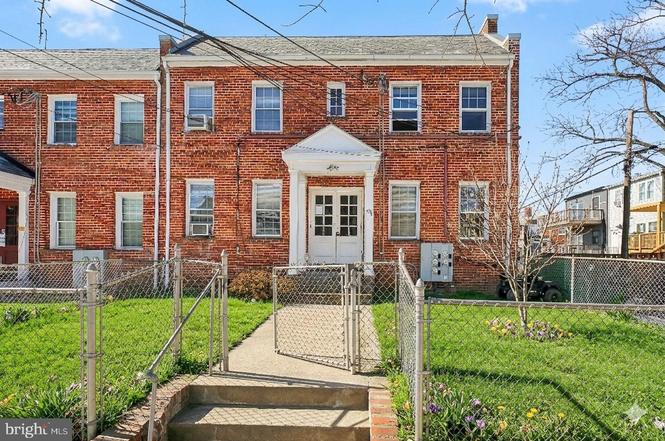
5618 1st Pl NW · Washington, DC
Flood risk 1/10 · Minimal
- FEMA flood zone
- X (unshaded)
- Chance of flooding over 30 yrs
- 0.0%
- Est. flood insurance / yr
- $507 – $1,088
Fire risk 1/10 · Minimal
- Est. fire insurance / yr
- $631 – $1,173
Heat risk 7/10 · Major
- Hot days now (above 104°F)
- 7 days/yr
- Hot days in 30 yrs
- 15 days/yr
Wind risk 4/10 · Minor
- Chance of severe wind over 30 yrs
- 20.0%
Air-quality risk 4/10 · Minor
- Unhealthy air days now
- 5 days/yr
- Unhealthy air days in 30 yrs
- 6 days/yr
Risk factors via First Street. Map © Google.
Why this score? — see what drove the C- grade
The composite is a weighted blend of 9 inputs, each scored 0–100. Each bar is that input's sub-score; the figure is the points it added to the 100-point composite (weight × sub-score).
- Cash flow +21.3/30.0
- ARV discount +7.5/15.0
- DSCR +6.8/10.0
- 1% rule +5.0/10.0
- Livability +3.7/5.0
- Schools +3.6/10.0
- Rent growth +2.9/5.0
- Condition / age +2.5/5.0
- Appreciation +0.0/10.0
$749,900
🖨 Deal sheet (PDF) 📄 Offer letter ✓ Due diligence
Multi-family units
County records classify this as Multi-Family (2-4 Unit). Listing-text estimate: 4 units. confirmed
Listing remarks
Well-maintained brick 4-unit property located in the highly sought-after Manor Park neighborhood of NW Washington, DC. Built with solid 1930s construction, this asset offers four 1-bedroom, 1-bath units, each featuring hardwood floors and a screened-in porch. Several units include newer furnaces, water heaters, and appliances, reducing immediate capital improvement needs. The property also features a detached 4-car garage, providing additional income potential. All units are currently tenant-occupied on month-to-month leases, offering flexibility for investors or future repositioning. One upper-level unit is expected to become vacant in the near future, presenting an immediate opportunity f
Key facts
- Water heaters
- Screened-in porch
- Newer furnaces
Tags
Property features AI
Finance
- Other: Ownership is fee simple; Rent control: No; Existing lease type: Month-to-month
- Financial info: Four total rental units with all four currently leased; Three units on month-to-month leases; Gross scheduled income noted; actual rent reported; Gross income reported; Net operating income reported; Operating expenses include trash
- HOA & community: Details not provided
Exterior
- Parking: Detached rear-entry garage; Four garage parking spaces (total); Off-street and on-street parking available; Public/unassigned parking present; Second garage on property
- Security: Details not provided
- Utilities: Public water; Public sewer (listed as public septic); Electric service with circuit breakers
- Home design: Detached building; 2 stories; Estimated year built
- Construction: Brick construction; Concrete perimeter and brick/mortar foundation; Building not winterized
- Exterior features: Balcony; Enclosed deck(s); Above-grade outdoor structures
Interior
- Kitchen: Galley kitchen (appliance details not provided)
- Bedrooms: Four one-bedroom units (some listed as month-to-month)
- Flooring: Wood floors
- Bathrooms: Details not provided
- Heating & cooling: Hot water radiator heating; Natural gas heating and hot water; Electric cooling (system details not provided)
- Interior features: Traditional floor plan; Galley kitchen layout; Wood floors throughout; No basement
- Laundry & utility: No units furnished (laundry details not provided)
Neighborhood map
What this means for you Summary
Snapshot
- This is a 4 × 1-bed/1.0-bath units multifamily listed at $750k.
Deal economics
- At list price, monthly cash flow is $1k ($13k/yr) — positive. Per door: $274/mo.
- The deal already cash-flows at list — no discount required.
- Meets the 1% rule at list price ($8k rent vs $750k).
- Recommended offer: $727k (3.0% below list) — sets the bar for market timing.
- Cap rate 8.0% vs local median 2.5% in Washington — top-decile yield for the area; either an underpriced asset or a hidden risk that comps aren't pricing in. Stress-test before assuming the spread holds.
Location & tenants
- Location reads 73/100 on livability (#1 in DC) — a middle-class / working-renter tenant base. Strengths: amenities A+, commute A+, employment A+; Watch: crime F, cost of living F.
- District Of Columbia Public Schools (urban): math 33% / reading 40% proficiency, ranked #8 of 32 in DC (top 25%) — families likely to look elsewhere, expect single-tenant / working-renter base with shorter leases; 65% free/reduced lunch — lower-income household profile, screen leases tightly.
- Market conditions: Rents rising (+1.4%/yr); 370 active listings in the ZIP; 30 comparable units currently listed for rent nearby; rentals at typical pace (median 20d on market — plan ~3-4 weeks tenant-placement turnaround); high-income renter base; 1,737 units permitted in District of Columbia in 2024 (1,506 in 5+ unit buildings).
- At $7,500/mo this rent would consume 82% of the median local household income ($110k/yr) (locally 3020% of renters already pay >50% of income on rent) — very limited rent-growth headroom before tenants either downsize or default.
Forward outlook
- Local home prices are declining (-3.0%/yr); year-one equity from $5k of loan paydown is wiped out by about $22k of value loss. Plan a longer hold.
- District of Columbia County population projected at +50% by 2050 — long-run rental-demand tailwind backs the buy-and-hold thesis.
Negotiation context
- It's been on market 53 days — a 3% lower offer ($727k) is reasonable based on typical stale-listing flexibility.
- 3 sale attempts; this cycle's ask has dropped $83k (10%) from the opening price — seller is motivated, your offer sets the floor, not the list.
- Current owner paid $77k; list at $750k implies a 874% gain — meaningful room to come down on a strong offer.
Risks & watch-outs
- Watch-outs: built in 1935 — expect roof / HVAC / electrical / plumbing capex.
- Climate carrying-cost: extreme-heat days projected 7→15/yr by 2055 (HVAC capex compounding) — expect insurance premiums to compound above CPI over the hold.
Questions for the listing agent
- It's been on market 53 days. Have you received any prior offers? Is the seller open to a 3% concession, seller financing, or rate buy-down credit?
- Can we see the unit-by-unit rent roll, current vacancy, and any below-market leases? What's the average tenancy length?
- What capital expenditures (roof, boiler, parking lot, exteriors) have been made in the last 5 years, and what's planned in the next 2?
- Built in 1935 — when were the roof, HVAC, electrical panel, plumbing, and water heater last replaced?
- Is there a deadline driving the sale (1031 exchange, divorce, estate, relocation)? That informs how much negotiation room exists.
- Crime grade is F in this area — have there been break-ins, vandalism, or insurance claims at this property in the last 3 years? What carrier currently insures it and at what premium?
- What's the average days-on-market for RENTAL listings here right now (not sales)? A rising rental-DOM trend means longer vacancies and softer asking-rent achievability than the comps imply.
- What's the recent tenant-quality profile in this submarket — average credit score on applications, eviction rate, late-payment / NSF rate, and stable-employment percentage? A property-management company in the area should have these aggregated.
- How much new apartment / multifamily construction is in the pipeline within 1–3 miles? Heavy new supply (>2% of stock underway) typically softens rents 12–24 months out; light construction supports rent growth.
Investment metrics
- 1% rule
- 1.00% ✓
- Cap rate
- 8.05%
- Cash-on-cash
- 6.27%
- DSCR
- 1.28
- GRM
- 8.3
CMA / ARV
- ARV (on-the-fly)
- $750,400
- Comps found
- 3
Show comp detail 3 sales within ~0.75 mi
| Address | Dist | Beds/Ba | Sqft | Sold | Price | $/sf | Match |
|---|---|---|---|---|---|---|---|
| 100 Emerson St NW | 0.60mi | 4/— | 2,800 (0%) | 10mo | $750,000 | $268 | 64 |
| 5228 4th St NW | 0.40mi | 4/4.0 | 2,516 (-10%) | 18mo | $836,000 | $332 | 49 |
| 306 Decatur St NW | 0.71mi | 4/— | 3,164 (+13%) | 20mo | $775,000 | $245 | 29 |
Match score weights: distance 35% · size 25% · config 20% · recency 20%. Top-matched comps best support the ARV.
Projected returns pro-forma
-3.0% appreciation · 1.45% rent growth · sell at horizon
- IRR
- -8.3%
- Equity multiple
- 0.70×
- Total profit
- $-63,247
- Equity at exit
- $111,813
- IRR
- -0.8%
- Equity multiple
- 0.95×
- Total profit
- $-11,319
- Equity at exit
- $64,838
Cash invested: $209,972 (down + closing). Projections, not guarantees.
Landlord ↔ Tenant lean methodology
- Overall (CITY)
- 0 Strongly Tenant-Friendly
- State District of Columbia
- 12 Strongly Tenant-Friendly · D+43
- County
- — inherits STATE
- City Washington
- 0 Strongly Tenant-Friendly · D+43
ZIP-level market 20011
- Rents YoY
- 1.4%
- Active inventory
- 370
- Price-to-rent
- 33.3×
Monthly cashflow live
- Estimated rent
- $7,500 high interval (Pro) →
- Mortgage (P&I)
- −$3,933
- Tax from tax record
- −$583 /mo · $6,991/yr
- Insurance
- −$312
- HOA
- −$0
- Vacancy / Maint / Mgmt
- −$1,575
- Net cashflow
- $1,097
Break-even live
Sensitivity live
| Price | -10% $1,522 | -5% $1,310 | +0% $1,097 | +5% $885 | +10% $673 |
|---|---|---|---|---|---|
| Rent | -10% $505 | -5% $801 | +0% $1,097 | +5% $1,394 | +10% $1,690 |
| Rate | -1.0pp $1,475 | -0.5pp $1,288 | base $1,097 | +0.5pp $903 | +1.0pp $705 |
4-unit breakdown (identical units grouped — click to expand)
| Units | Beds | Baths | Est. rent |
|---|---|---|---|
| 4× units | 1 | 1 | $7,500 |
| #1 | 1 | 1 | $1,875 |
| #2 | 1 | 1 | $1,875 |
| #3 | 1 | 1 | $1,875 |
| #4 | 1 | 1 | $1,875 |
| Total (4 units) | $7,500 | ||
UW: 25.0% down · 7.5% · 30yr · 1.5% tax · 5.0% vac · 8.0% maint · 8.0% mgmt
Financing live
Cash to close
- Down payment
- $187,475
- Closing costs
- $22,497
- Reserves months
- —
- Total cash needed
- —
Loan-product check · same deal, 3 products live
Conventional
25% down · 7.5% · 30yr
- Down + closing
- —
- Monthly P&I
- —
- Monthly cashflow
- —
- DSCR
- —
- Eligible?
- —
Personal DTI + credit; lowest rate.
DSCR
20% down · 8.5% · 30yr
- Down + closing
- —
- Monthly P&I
- —
- Monthly cashflow
- —
- DSCR
- —
- Eligible?
- —
No personal income docs; deal must DSCR.
Hard money
10% down · 12.0% · 12mo
- Down + closing
- —
- Monthly P&I
- —
- Monthly cashflow
- —
- DSCR
- —
- Eligible?
- —
Short-term bridge; refi at stabilization.
Rent comps 30 comps
| Address | Beds | Baths | Sqft | Rent | $/sqft | DOM | Units | Dist |
|---|---|---|---|---|---|---|---|---|
| 225 Missouri Ave NW Washington, DC | 5.0 | 4.5 | 2138 | $7,100 | $3.32 | 0d | 1 | 0.12mi |
| 5520 N Capitol St NW Washington, DC | 4.0 | 3.5 | 2070 | $5,399 | $2.61 | 5d | 1 | 0.20mi |
| 5430 N Capitol St NW Washington, DC | 3.0 | 2.5 | 2400 | $4,200 | $1.75 | 5d | 1 | 0.25mi |
| 5201 2nd St NW Unit A Washington, DC | 4.0 | 2.5 | 2000 | $4,000 | $2.00 | 25d | 1 | 0.31mi |
| 5404 4th St NW #1 Washington, DC | 4.0 | 4.5 | 2250 | $5,500 | $2.44 | 5d | 1 | 0.32mi |
| 5404 4th St NW #2 Washington, DC | 4.0 | 3.5 | 2250 | $5,900 | $2.62 | 5d | 1 | 0.32mi |
| 5020 2nd St NW Unit 3 Washington, DC | 3.0 | 1.0 | 2880 | $3,245 | $1.13 | 25d | 1 | 0.42mi |
| 617 Longfellow St NW Washington, DC | 4.0 | 3.5 | 2500 | $5,500 | $2.20 | 25d | 1 | 0.46mi |
| 520 Jefferson St NW Washington, DC | 4.0 | 4.0 | 2380 | $6,499 | $2.73 | 3d | 1 | 0.46mi |
| 114 Sheridan St NW Washington, DC | 3.0 | 3.0 | 2359 | $4,850 | $2.06 | 25d | 1 | 0.55mi |
| 317 Riggs Rd NE Washington, DC | 3.0 | 3.5 | 2040 | $3,950 | $1.94 | 19d | 1 | 0.62mi |
| 317 Riggs Rd NE Washington, DC | 3.0 | 3.5 | 2040 | $3,950 | $1.94 | 19d | 1 | 0.62mi |
| 432 Emerson St NW Washington, DC | 4.0 | 3.5 | 2340 | $5,800 | $2.48 | 17d | 1 | 0.65mi |
| 4909 Illinois Ave NW Washington, DC | 3.0 | 2.0 | 2460 | $3,950 | $1.61 | 25d | 1 | 0.77mi |
| 400 Ava Way NE Washington, DC | 4.0 | 3.5 | 2466 | $4,595 | $1.86 | 21d | 1 | 0.88mi |
| 4823 9th St NW Washington, DC | 4.0 | 2.0 | 2144 | $3,750 | $1.75 | 6d | 1 | 0.89mi |
| 5518 13th St NW Washington, DC | 4.0 | 2.5 | 2746 | $4,875 | $1.78 | 3d | 1 | 0.92mi |
| 5308 13th St NW Washington, DC | 3.0 | 3.5 | 3300 | $4,000 | $1.21 | 25d | 1 | 0.94mi |
| 513 Whittier St NW Washington, DC | 5.0 | 4.0 | 2352 | $6,275 | $2.67 | 3d | 1 | 1.02mi |
| 513 Whittier St NW Washington, DC | 5.0 | 4.0 | 2352 | $6,275 | $2.67 | 16d | 1 | 1.02mi |
| 1305 Rittenhouse St NW Washington, DC | 3.0 | 2.5 | 2177 | $3,850 | $1.77 | 25d | 1 | 1.06mi |
| 1311 Fort Stevens Dr NW Unit 1 Washington, DC | 3.0 | 1.0 | 3108 | $2,500 | $0.80 | 22d | 1 | 1.06mi |
| 4605 Georgia Ave NW Washington, DC | 4.0 | 3.0 | 2000 | $4,500 | $2.25 | 8d | 1 | 1.08mi |
| 1317 Rittenhouse St NW Washington, DC | 5.0 | 3.0 | 2534 | $3,900 | $1.54 | 25d | 1 | 1.08mi |
| 5211 14th St NW Washington, DC | 4.0 | 3.0 | 2220 | $4,500 | $2.03 | 25d | 1 | 1.13mi |
| 1002 Chillum Rd Hyattsville, MD | 4.0 | 2.0 | 2232 | $3,000 | $1.34 | 44d | 1 | 1.14mi |
| 1419 Rittenhouse St NW Washington, DC | 3.0 | 1.5 | 2091 | $3,350 | $1.60 | 12d | 1 | 1.27mi |
| 4023 New Hampshire Ave NW Washington, DC | 4.0 | 3.5 | 1946 | $5,950 | $3.06 | 25d | 1 | 1.28mi |
| 1501 Crittenden St NW Washington, DC | 5.0 | 2.0 | 3310 | $9,000 | $2.72 | 25d | 1 | 1.39mi |
| 3815 New Hampshire Ave NW Washington, DC | 4.0 | 3.5 | 2300 | $5,150 | $2.24 | 5d | 1 | 1.46mi |
Listing history 10 events
-
2026-06-15status $749,900 Pending 53 DOM
-
2026-04-26historical Active Under Contract
-
2026-04-10price $749,900
-
2026-03-25price $799,500
-
2026-03-24status Active
-
2026-03-04historical
-
2026-03-02historical Active Under Contract
-
2026-02-09$832,977 Active
-
2026-02-07$832,977 Active
-
1982-06-15soldstatus $77,000
ⓘ Source: listings_history table (triggers on properties + properties_extension) + one-shot
backfill from property_details.listing_events for pre-trigger history.
Tax reassessment forecast DC · Partial reset (capped growth)
- Current annual tax
- $6,991 · $583/mo
- Projected year-2 tax
- $6,991 · $583/mo
- Expected delta
- $0/yr ($0/mo · 0.0%)
ⓘ Screening estimate from a state-policy table — verify with the county assessor before closing.
Climate risk First Street
- Flood 1/10 Low FEMA zone X (unshaded) · 0% chance over 30 yrs
- Wildfire 1/10 Low
- Heat 7/10 Severe 7 d/yr ≥104°F today · 15 d/yr by 30 yrs out
- Wind 4/10 Moderate 20% chance of damaging wind over 30 yrs
- Air quality 4/10 Moderate 5 unhealthy d/yr today · 6 by 30 yrs out
Nearby sold comps map
Loading sold comps map…
Walkable amenities ~0.75 mi
Loading nearby amenities…
Taxation est. · year 1
- Rental income
- $90,000
- − Mortgage interest
- −$42,006
- − Property taxes
- −$6,991
- − Insurance
- −$3,750
- − Repairs & maintenance
- −$7,200
- − Management
- −$7,200
- − Depreciation
- −$21,815
- Taxable income
- $1,038
- Est. tax owed @ 24.0%
- −$249
- After-tax cash flow
- $12,920/yr
For passive investors: Depreciation is non-cash, so a rental often shows a tax loss while cash-flowing — sheltering income. Rental losses are passive: they offset passive income freely, and up to $25,000/yr can offset ordinary (W-2) income if you actively participate and your MAGI is under $100k (phasing out to $0 by $150k); unused losses carry forward. On sale, claimed depreciation is recaptured at up to 25%, and gains may owe capital-gains tax (a 1031 exchange can defer both). Figures are a year-1 estimate at your 24.0% rate — not tax advice; consult a CPA.
Schools (NCES district)
- District
- District Of Columbia Public Schools
- NCES district ID
- 1100030
- Math proficiency
- 33% ▲ 3.00%
- Reading proficiency
- 40% ▲ 5.00%
- Median HH income
- $67,671
- Composite
- 35.84/100
- National rank
- #9606
- State rank
- #8 of 32 in DC
Livability — Washington
- Score
- 73/100
- State rank
- #1
- US rank
- #5327
Category grades
Schools grade is shown separately in the Schools card above.
Census & demographics
- Census place
- Washington, DC
- County
- District of Columbia · 671,873 people
- City population
- 671,873
- Metro
- Washington-Arlington-Alexandria, DC-VA-MD-WV
- Population (ZIP)
- 67,434
- Household income
- $110,309
- Rent vs Own
- Severe rent burden
- 3020.0
Population outlook (District of Columbia County) Hauer SSP2
- Today (2025)
- 821,926 people
- By 2030
- 899,517 · +9.4%
- By 2040
- 1,061,162 · +29.1%
- By 2050
- 1,231,493 · +49.8%
- By 2075
- 1,603,312 · +95.1%
- By 2100
- 1,847,141 · +124.7%
Race, ethnicity, and origin ACS 2023
- Neighborhood character
- Diverse neighborhood (Simpson 0.66)
- Race & ethnicity
- Black 50% Hispanic / Latino 23% White 20% Two or more races 10% Asian 2%
- Hispanic origin (detail)
- Mexican 2% Dominican 1%
- Common ancestry
- Lithuanian 1% Romanian 1% Slovak 1%
- Foreign-born
- 21% · Canada
- Languages at home
- 70% English-only · Spanish 20% French/Haitian/Cajun 2% Other Indo-European 1%
Political lean MEDSL · District of Columbia
- 2024 margin
- Solid D (+86.1) · D 91.2% · R 5.1% · Other 3.8%
- 2008→2024 swing
- +0.1pp no change · 2008: 85.9pp · 2024: 86.1pp
- All cycles
- 2024: D+86.1 2020: D+86.8 2016: D+88.7 2012: D+84.2 2008: D+85.9
Not yet ingested
- Civics
- —
Market trends
- HPI YoY
- ▼ -755.96%
- Current HPI
- 378.1083
- Rent YoY
- ▲ 1.45%
- Metro
- Washington-Arlington-Alexandria, DC-VA-MD-WV
- State GDP YoY
- ▲ 1.33%
- F500 in state
- 6
Industry mix (Fortune 500 HQ in DC)
| Industry | F500 HQs | Revenue |
|---|---|---|
| Financial Services | 1 | $153B |
|
||
| Life Sciences / Industrials | 1 | $25B |
|
||
| Industrial Machinery | 1 | $8B |
|
||
Price history
+873.9% since first listed9 events — show timeline
- 2026-04-26 Contingent — BRIGHT MLS
- 2026-04-10 Price Changed $749,900 BRIGHT MLS
- 2026-03-25 Price Changed $799,500 BRIGHT MLS
- 2026-03-24 Relisted — BRIGHT MLS
- 2026-03-04 Listing Removed — BRIGHT MLS
- 2026-03-02 Contingent — BRIGHT MLS
- 2026-02-09 Listed $832,977 BRIGHT MLS
- 2026-02-07 Listed $832,977 BRIGHT MLS
- 1982-06-15 Sold (Public Records) $77,000 Public Records
Property tax history
+3.5%/yrLatest (2025): $6,991 · +2.9% YoY. Source: county tax records.
Cash-flow waterfall
monthlySold comps — $/sqft
last 12 mo · ≤1 miLoading sold comps…