 🌊 Lakefront
165 NE 203rd Ter Unit C20 · Miami Gardens, FL
Flood risk 4/10 · Minor
- FEMA flood zone
- AE
- Chance of flooding over 30 yrs
- 0.21%
- Est. flood insurance / yr
- $1,737 – $8,500
Fire risk 1/10 · Minimal
- Est. fire insurance / yr
- $947 – $1,759
Heat risk 10/10 · Severe
- Hot days now (above 105°F)
- 5 days/yr
- Hot days in 30 yrs
- 19 days/yr
Wind risk 10/10 · Severe
- Chance of severe wind over 30 yrs
- 99.0%
Air-quality risk 2/10 · Minimal
- Unhealthy air days now
- 2 days/yr
- Unhealthy air days in 30 yrs
- 2 days/yr
Risk factors via First Street. Map © Google.
Why this score? — see what drove the B grade
The composite is a weighted blend of 9 inputs, each scored 0–100. Each bar is that input's sub-score; the figure is the points it added to the 100-point composite (weight × sub-score).
- Cash flow +30.0/30.0
- 1% rule +10.0/10.0
- DSCR +10.0/10.0
- ARV discount +7.5/15.0
- Schools +4.2/10.0
- Livability +3.6/5.0
- Rent growth +2.6/5.0
- Condition / age +2.2/5.0
- Appreciation +0.0/10.0
$100,000
🖨 Deal sheet 📄 Offer letter ✓ Due diligence
Listing remarks
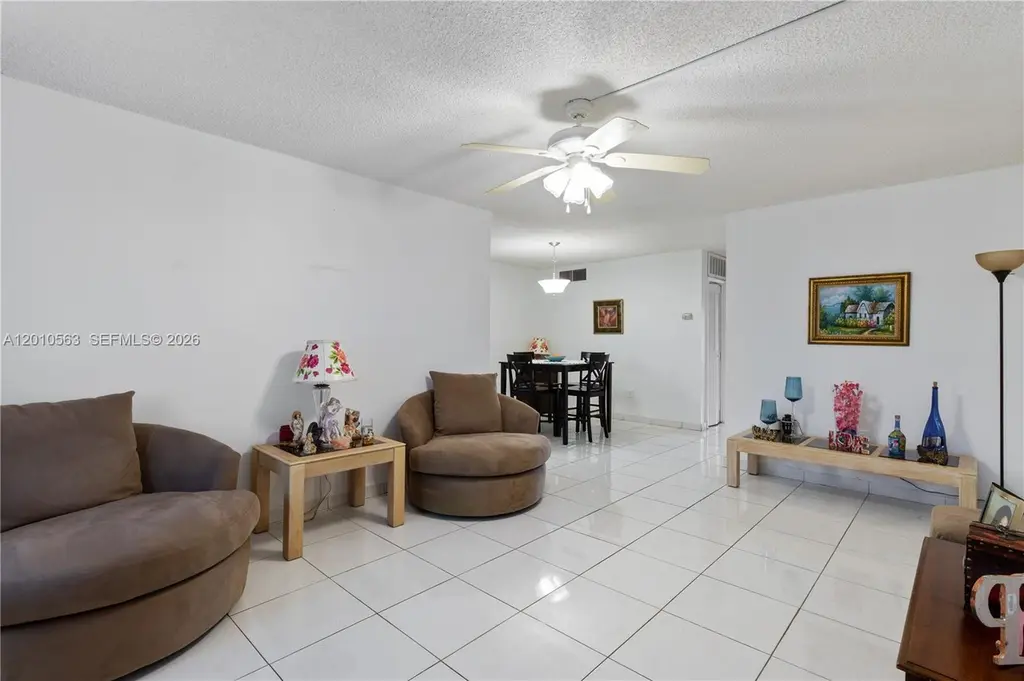
BEAUTIFUL AND BRIGHT 1 BEDROOM / 1 BATH, WITH LAKE VIEWS LOCATED ON THE SECOND FLOOR. CERAMIC FLOORS THROUGHOUT THE APARTMENT FLOORS IN THE BEDROOM. CERAMIC FLOORS ON THE PATIO AND NEW CURTAINS ON THE WINDOWS. THE BEDROOM HAS TWO BIG CLOSETS. LOTS OF SPACE. THE COMMUNITY HAS A POOL, BBQ AREA, EXERCISE ROOM, SAUNA, CLUBHOUSE, POOL TABLES. LOCATION IS PERFECT AND NEAR PUBLIC TRANSPORTATION, SHOPPING, AVENTURA MALL. ATTENTION: HOPA> 55+ OLDER COMMUNITY. AT LEAST ONE PERSON HAS TO BE 55+ OLDER. UNIT IS CURRENTLY RENTED
Key facts
- Lake views
- Community pool
- Exercise room
Tags
Property features AI
Finance
- Financial info: Pets allowed with restrictions
- HOA & community: Monthly association fee of $350; Association covers amenities, cable TV, electricity, hot water, insurance, internet, grounds maintenance, parking, pool(s), sewer, trash and water; Community includes a sauna; Senior community
Exterior
- Parking: Detached garage with 1 covered space
- Home design: 2-story property; Entry on the second level; Attached property; Has a view
- Construction: Block construction; Resale property
- Exterior features: Awnings; Canal-front waterfront
Interior
- Kitchen: Dishwasher
- Bedrooms: Bedroom located on the main level
- Flooring: Ceramic tile
- Bathrooms: 1 full bathroom; 1 half bathroom
- Heating & cooling: Central heating; Central air conditioning
- Interior features: Bedroom on main level; Second floor entry; Ceramic tile flooring
Neighborhood map
What this means for you Summary
Snapshot
- This is a 1-bed/1.5-bath condo listed at $100k. Condition is rated fair.
Deal economics
- At list price, monthly cash flow is $112 ($1k/yr) — positive.
- The deal already cash-flows at list — no discount required.
- Meets the 1% rule at list price ($2k rent vs $100k).
- Recommended offer: $97k (3.0% below list) — sets the bar for market timing.
- Cap rate 12.8% vs local median 3.1% in Miami Gardens — top-decile yield for the area; either an underpriced asset or a hidden risk that comps aren't pricing in. Stress-test before assuming the spread holds.
Location & tenants
- Location reads 72/100 on livability (#338 in FL) — a middle-class / working-renter tenant base. Strengths: commute A+, housing A+, health & safety A+; Watch: employment D+, crime D-, amenities F.
- Miami-Dade (suburban): math 45% / reading 54% proficiency, ranked #40 of 73 in FL (top 55%) — families likely to look elsewhere, expect single-tenant / working-renter base with shorter leases; 64% free/reduced lunch — lower-income household profile, screen leases tightly.
- Market conditions: Rents flat; 572 active listings in the ZIP; 23 comparable units currently listed for rent nearby; rentals at typical pace (median 17d on market — plan ~3-4 weeks tenant-placement turnaround); 10,051 units permitted in Miami-Dade County in 2024 (7,758 in 5+ unit buildings).
- This rent runs 37% of the median local income ($65k/yr) — at the standard rent-burdened threshold; future hikes will face affordability resistance.
Forward outlook
- Local home prices are declining (-3.0%/yr); year-one equity from $691 of loan paydown is wiped out by about $3k of value loss. Plan a longer hold.
- Miami-Dade County population projected at +28% by 2050 — long-run rental-demand tailwind backs the buy-and-hold thesis.
Negotiation context
- It's been on market 49 days — a 3% lower offer ($97k) is reasonable based on typical stale-listing flexibility.
- 6 sale attempts since 6y ago; this cycle's ask has dropped $20k (17%) from the opening price — seller is motivated, your offer sets the floor, not the list.
Risks & watch-outs
- Watch-outs: flood insurance adds $427/mo.
- Climate carrying-cost: in FEMA flood zone AE (mandatory federal flood insurance); severe wind risk, 99% chance of damaging wind over 30y; extreme-heat days projected 5→19/yr by 2055 (HVAC capex compounding) — expect insurance premiums to compound above CPI over the hold.
Questions for the listing agent
- It's been on market 49 days. Have you received any prior offers? Is the seller open to a 3% concession, seller financing, or rate buy-down credit?
- Have any recent inspections been done? Can we get a copy of the seller's disclosures and any deferred-maintenance estimates?
- Built in 1970 — when were the roof, HVAC, electrical panel, plumbing, and water heater last replaced?
- What's the actual annual flood-insurance premium (NFIP or private), and is the property in a SFHA with mandatory coverage?
- What does the HOA fee cover, when was the last increase, and are there any pending special assessments or reserve-fund shortfalls?
- Any open or pending special assessments — roof, HVAC, plumbing, elevator, façade? What's the per-unit balance and payoff schedule, and is the seller paying it off at close or rolling it to the buyer?
- Is there a deadline driving the sale (1031 exchange, divorce, estate, relocation)? That informs how much negotiation room exists.
- Crime grade is D in this area — have there been break-ins, vandalism, or insurance claims at this property in the last 3 years? What carrier currently insures it and at what premium?
- This sits on a lake — are riparian / water-frontage rights deeded with the parcel? Any dock permits, shoreline easements, or HOA water-use restrictions?
- What's the documented flood / surge / shoreline-erosion history here (FEMA AND non-FEMA — e.g., storm surge, creek backup, septic-field saturation)?
- Any water-quality or seasonal algae-bloom issues that affect tenant satisfaction or short-term-rental demand?
- What's the average days-on-market for RENTAL listings here right now (not sales)? A rising rental-DOM trend means longer vacancies and softer asking-rent achievability than the comps imply.
- What's the recent tenant-quality profile in this submarket — average credit score on applications, eviction rate, late-payment / NSF rate, and stable-employment percentage? A property-management company in the area should have these aggregated.
- How much new apartment / multifamily construction is in the pipeline within 1–3 miles? Heavy new supply (>2% of stock underway) typically softens rents 12–24 months out; light construction supports rent growth.
Investment metrics
- 1% rule
- 2.00% ✓
- Cap rate
- 12.76%
- Cash-on-cash
- 23.10%
- DSCR
- 2.03
- GRM
- 4.2
CMA / ARV
No comps found within radius.
Projected returns pro-forma
-3.0% appreciation · 0.22% rent growth · sell at horizon
- IRR
- -14.7%
- Equity multiple
- 0.50×
- Total profit
- $-13,981
- Equity at exit
- $14,910
- IRR
- -20.3%
- Equity multiple
- 0.21×
- Total profit
- $-22,023
- Equity at exit
- $8,646
Cash invested: $28,000 (down + closing). Projections, not guarantees.
Landlord ↔ Tenant lean methodology
- Overall (STATE)
- 87 Strongly Landlord-Friendly
- State Florida
- 87 Strongly Landlord-Friendly · R+3
- County
- — inherits STATE
- City
- — inherits STATE
ZIP-level market 33179
- Rents YoY
- 0.2%
- Active inventory
- 572
- Price-to-rent
- 4.2×
Monthly cashflow live
- Estimated rent
- $2,000 high interval (Pro) →
- Mortgage (P&I)
- −$524
- Tax est. 1.5%
- −$125 /mo · $1,500/yr
- Insurance
- −$42
- Flood insurance flood zone
- −$427 /mo · $5,118/yr
- HOA
- −$350
- Vacancy / Maint / Mgmt
- −$420
- Net cashflow
- $112
Break-even live
UW: 25.0% down · 7.5% · 30yr · 1.5% tax · 5.0% vac · 8.0% maint · 8.0% mgmt
Financing live
Cash to close
- Down payment
- $25,000
- Closing costs
- $3,000
- Reserves months
- —
- Total cash needed
- —
Loan-product check · same deal, 3 products live
Conventional
25% down · 7.5% · 30yr
- Down + closing
- —
- Monthly P&I
- —
- Monthly cashflow
- —
- DSCR
- —
- Eligible?
- —
Personal DTI + credit; lowest rate.
DSCR
20% down · 8.5% · 30yr
- Down + closing
- —
- Monthly P&I
- —
- Monthly cashflow
- —
- DSCR
- —
- Eligible?
- —
No personal income docs; deal must DSCR.
Hard money
10% down · 12.0% · 12mo
- Down + closing
- —
- Monthly P&I
- —
- Monthly cashflow
- —
- DSCR
- —
- Eligible?
- —
Short-term bridge; refi at stabilization.
Rent comps 23 comps
| Address | Beds | Baths | Sqft | Rent | $/sqft | DOM | Units | Dist |
|---|---|---|---|---|---|---|---|---|
| 5525 SW 41st St Hollywood, FL | 2.0 | 2.0 | 1031 | $2,145 | $2.08 | 3d | 1 | 0.83mi |
| 5100 SW 41st St Pembroke Park, FL | 1.0–2.0 | 1.0–2.0 | 815 | $1,699 | $2.08 | 19d | 3 | 0.89mi |
| 5100 SW 41st St Pembroke Park, FL | 1.0–2.0 | 1.0–2.0 | 815 | $1,650 | $2.02 | 3d | 4 | 0.89mi |
| 5540 SW 38th Ct West Park, FL | 2.0 | 1.0 | 768 | $2,000 | $2.60 | 11d | 1 | 0.91mi |
| 5460 SW 38th Ct West Park, FL | 2.0 | 1.0 | 890 | $2,350 | $2.64 | 24d | 1 | 0.92mi |
| 5440 SW 38th Ct West Park, FL | 2.0 | 1.0 | 768 | $1,900 | $2.47 | 7d | 1 | 0.92mi |
| 5440 SW 38th Ct West Park, FL | 2.0 | 1.0 | 768 | $1,900 | $2.47 | 24d | 1 | 0.92mi |
| 5710 SW 38th St West Park, FL | 2.0 | 1.0 | 835 | $2,400 | $2.87 | 24d | 1 | 0.92mi |
| 5510 SW 38th St West Park, FL | 2.0 | 1.0 | 855 | $2,250 | $2.63 | 2d | 1 | 0.96mi |
| 5510 SW 38th St Unit 5510 West Park, FL | 2.0 | 1.0 | 822 | $2,250 | $2.74 | 4d | 1 | 0.96mi |
| 5510 SW 38th St Unit 5510 West Park, FL | 2.0 | 1.0 | 822 | $2,250 | $2.74 | 3d | 1 | 0.96mi |
| 3721 SW 54th Ave West Park, FL | 2.0 | 1.0 | 768 | $2,100 | $2.73 | 12d | 1 | 1.02mi |
| 3700 SW 52nd Ave Hollywood, FL | 2.0 | 2.0 | 850 | $1,446 | $1.70 | 24d | 1 | 1.04mi |
| 3842 SW 48th Ave Hollywood, FL | 2.0 | 2.0 | 966 | $2,000 | $2.07 | 24d | 1 | 1.05mi |
| 3856 SW 48th Ave #3856 Pembroke Park, FL | 2.0 | 2.0 | 950 | $2,150 | $2.26 | 16d | 1 | 1.06mi |
| 3838 SW 48th Ave Unit 3838 Pembroke Park, FL | 2.0 | 2.0 | 966 | $2,200 | $2.28 | 24d | 1 | 1.06mi |
| 3828 SW 48th Ave Unit D27 Hollywood, FL | 2.0 | 2.0 | 950 | $2,300 | $2.42 | 24d | 1 | 1.08mi |
| 3874 SW 48th Ave #3874 Pembroke Park, FL | 2.0 | 2.0 | 950 | $2,150 | $2.26 | 7d | 1 | 1.08mi |
| 3826 SW 48th Ave Unit 3826 Pembroke Park, FL | 2.0 | 2.0 | 950 | $2,200 | $2.32 | 15d | 1 | 1.10mi |
| 3826 SW 48th Ave Unit 3826 Pembroke Park, FL | 2.0 | 2.0 | 950 | $2,200 | $2.32 | 5d | 1 | 1.10mi |
| 6112 SW 37th St Unit B Miramar, FL | 2.0 | 1.0 | 850 | $1,800 | $2.12 | 22d | 1 | 1.11mi |
| 5521 SW 34th St Unit 2 Pembroke Park, FL | 2.0 | 1.0 | 692 | $1,750 | $2.53 | 24d | 1 | 1.29mi |
| 6033 SW 35th St Unit 101 Miramar, FL | 2.0 | 2.0 | 1000 | $1,995 | $2.00 | 24d | 1 | 1.32mi |
HOA detail condo
- Monthly dues
- $350 · $4,200/yr
- Likely covers
- pool
- Assessments
- None detected in remarks — confirm with the listing agent.
Listing history 27 events
-
2026-06-18days on market $100,000 Active 49 DOM
-
2026-06-17days on market $100,000 Active 48 DOM
-
2026-06-16days on market $100,000 Active 47 DOM
-
2026-06-15days on market $100,000 Active 46 DOM
-
2026-06-13days on market $100,000 Active 44 DOM
-
2026-06-09days on market $100,000 Active 40 DOM
-
2026-06-08days on market $100,000 Active 39 DOM
-
2026-06-07days on market $100,000 Active 38 DOM
-
2026-06-04days on market $100,000 Active 35 DOM
-
2026-06-03days on market $100,000 Active 34 DOM
-
2026-06-02days on market $100,000 Active 33 DOM
-
2026-06-01days on market $100,000 Active 32 DOM
-
2026-05-31days on market $100,000 Active 31 DOM
-
2026-05-12price $100,000
-
2026-04-30$120,000 Active
-
2025-12-31historical
-
2025-07-16$130,000 Active
-
2024-12-31historical
-
2024-08-06$140,000 Active
-
2024-06-14historical
-
2024-05-28price $125,000
-
2024-04-26price $140,000
-
2023-11-15$145,000 Active
-
2021-12-01historical
-
2021-02-12$90,000 Active
-
2021-02-11historical
-
2020-06-18$90,000 Active
ⓘ Source: listings_history table (triggers on properties + properties_extension) + one-shot
backfill from property_details.listing_events for pre-trigger history.
Climate risk First Street
- Flood 4/10 Moderate FEMA zone AE · 21% chance over 30 yrs
- Wildfire 1/10 Low
- Heat 10/10 Extreme 5 d/yr ≥105°F today · 19 d/yr by 30 yrs out
- Wind 10/10 Extreme 99% chance of damaging wind over 30 yrs
- Air quality 2/10 Low 2 unhealthy d/yr today · 2 by 30 yrs out
Nearby sold comps map
Loading sold comps map…
Walkable amenities ~0.75 mi
Loading nearby amenities…
Taxation est. · year 1
- Rental income
- $24,000
- − Mortgage interest
- −$5,602
- − Property taxes
- −$1,500
- − Insurance
- −$5,618
- − Repairs & maintenance
- −$1,920
- − Management
- −$1,920
- − HOA
- −$4,200
- − Depreciation
- −$2,909
- Taxable income
- $331
- Est. tax owed @ 24.0%
- −$79
- After-tax cash flow
- $1,269/yr
For passive investors: Depreciation is non-cash, so a rental often shows a tax loss while cash-flowing — sheltering income. Rental losses are passive: they offset passive income freely, and up to $25,000/yr can offset ordinary (W-2) income if you actively participate and your MAGI is under $100k (phasing out to $0 by $150k); unused losses carry forward. On sale, claimed depreciation is recaptured at up to 25%, and gains may owe capital-gains tax (a 1031 exchange can defer both). Figures are a year-1 estimate at your 24.0% rate — not tax advice; consult a CPA.
Condition & rehab AI · 12 photos
This 1-bedroom/1.5-bath condo requires moderate repairs and maintenance, with potential for significant value increase through painting, landscaping, and kitchen/bathroom updates.
Repairs flagged
- Minor kitchen cabinets — slight wear
- Minor bathroom fixtures — slight wear
- Moderate exterior paint — some fading
- Minor landscaping — some overgrown areas
Value-add opportunities
- Both painting — enhances curb appeal and interior aesthetics
- Both landscaping — improves curb appeal and enhances property value
- Both kitchen and bathroom updates — modernizes spaces and improves functionality
Renovation cost estimate screening
| Repair item | Severity | Est. cost |
|---|---|---|
| kitchen cabinets · slight wear | Minor | $500–3,000 |
| bathroom fixtures · slight wear | Minor | $500–3,000 |
| exterior paint · some fading | Moderate | $3,000–15,000 |
| landscaping · some overgrown areas | Minor | $500–3,000 |
| Total estimated repair cost · 4 items | $4,500–24,000 |
Value-add ROI direction
- Both painting — enhances curb appeal and interior aesthetics ↑
- Both landscaping — improves curb appeal and enhances property value ↑
- Both kitchen and bathroom updates — modernizes spaces and improves functionality ↑
ⓘ Cost ranges are severity-bucket heuristics (US national rule-of-thumb). Get contractor quotes + a written scope before underwriting a rehab budget.
Schools (NCES district)
- District
- Miami-Dade
- NCES district ID
- 1200390
- Math proficiency
- 45% ▼ -16.00%
- Reading proficiency
- 54% ▼ -5.00%
- Median HH income
- $43,928
- Composite
- 41.76/100
- National rank
- #3397
- State rank
- #40 of 73 in FL
Livability — Miami Gardens
- Score
- 72/100
- State rank
- #338
- US rank
- #5854
Category grades
Schools grade is shown separately in the Schools card above.
Census & demographics
- Census place
- Miami Gardens, FL
- County
- Miami-Dade County · 2,697,751 people
- Metro
- Miami-Fort Lauderdale-Pompano Beach, FL
- Population (ZIP)
- 51,591
- Household income
- $65,211
- Rent vs Own
- Severe rent burden
- 3123.0
Population outlook (Miami-Dade County) Hauer SSP2
- Today (2025)
- 3,126,439 people
- By 2030
- 3,325,765 · +6.4%
- By 2040
- 3,697,561 · +18.3%
- By 2050
- 4,012,134 · +28.3%
- By 2075
- 4,605,612 · +47.3%
- By 2100
- 4,866,598 · +55.7%
Race, ethnicity, and origin ACS 2023
- Neighborhood character
- Diverse neighborhood (Simpson 0.67)
- Race & ethnicity
- Black 39% Hispanic / Latino 38% Two or more races 23% White 19% Asian 1%
- Hispanic origin (detail)
- Mexican 1% Puerto Rican 2% Cuban 6% Dominican 3% Salvadoran 3%
- Common ancestry
- Hispanic 13% Scotch-Irish 2% Romanian 2%
- Foreign-born
- 48% · Canada, Jamaica, Dominican Republic
- Languages at home
- 42% English-only · Spanish 37% French/Haitian/Cajun 13% Other Indo-European 2%
Political lean MEDSL · Miami-Dade
- 2024 margin
- R (+11.4) · D 43.9% · R 55.4%
- 2008→2024 swing
- -27.6pp toward R · 2008: 16.1pp · 2024: -11.4pp
- All cycles
- 2024: R+11.4 2020: D+7.3 2016: D+29.6 2012: D+23.7 2008: D+16.1
Not yet ingested
- Civics
- —
Market trends
- HPI YoY
- ▼ -608.34%
- Current HPI
- 328.1733
- Rent YoY
- ▲ 0.22%
- Metro
- Miami-Fort Lauderdale-Pompano Beach, FL
- State GDP YoY
- ▲ 3.28%
- F500 in state
- 36
Industry mix (Fortune 500 HQ in FL)
| Industry | F500 HQs | Revenue |
|---|---|---|
| Industrial Technology | 2 | $29B |
|
||
| Insurance | 2 | $17B |
|
||
| Retail | 1 | $60B |
|
||
| Technology Distribution | 1 | $58B |
|
||
| Homebuilding | 1 | $35B |
|
||
| Technology Manufacturing | 1 | $35B |
|
||
Price history
+11.1% since first listed14 events — show timeline
- 2026-05-12 Price Changed $100,000 MARMLS
- 2026-04-30 Listed $120,000 MARMLS
- 2025-12-31 Listing Removed — MARMLS
- 2025-07-16 Listed $130,000 MARMLS
- 2024-12-31 Listing Removed — MARMLS
- 2024-08-06 Listed $140,000 MARMLS
- 2024-06-14 Listing Removed — MARMLS
- 2024-05-28 Price Changed $125,000 MARMLS
- 2024-04-26 Price Changed $140,000 MARMLS
- 2023-11-15 Listed $145,000 MARMLS
- 2021-12-01 Listing Removed — MARMLS
- 2021-02-12 Listed $90,000 MARMLS
- 2021-02-11 Listing Removed — MARMLS
- 2020-06-18 Listed $90,000 MARMLS
Cash-flow waterfall
monthlySold comps — $/sqft
last 12 mo · ≤1 miLoading sold comps…