167 Short Rd · Ellenboro, NC
Flood risk 1/10 · Minimal
- FEMA flood zone
- X (unshaded)
- Chance of flooding over 30 yrs
- 0.0%
- Est. flood insurance / yr
- $507 – $1,088
Fire risk 4/10 · Minor
- Est. fire insurance / yr
- $906 – $1,684
Heat risk 5/10 · Moderate
- Hot days now (above 104°F)
- 7 days/yr
- Hot days in 30 yrs
- 16 days/yr
Wind risk 2/10 · Minimal
- Chance of severe wind over 30 yrs
- 1.0%
Air-quality risk 3/10 · Minor
- Unhealthy air days now
- 3 days/yr
- Unhealthy air days in 30 yrs
- 3 days/yr
Risk factors via First Street. Map © Google.
Why this score? — see what drove the B- grade
The composite is a weighted blend of 9 inputs, each scored 0–100. Each bar is that input's sub-score; the figure is the points it added to the 100-point composite (weight × sub-score).
- Cash flow +30.0/30.0
- 1% rule +10.0/10.0
- DSCR +10.0/10.0
- ARV discount +7.5/15.0
- Schools +3.6/10.0
- Livability +3.2/5.0
- Rent growth +2.5/5.0
- Condition / age +2.5/5.0
- Appreciation +0.0/10.0
$85,500
🖨 Deal sheet 📄 Offer letter ✓ Due diligence
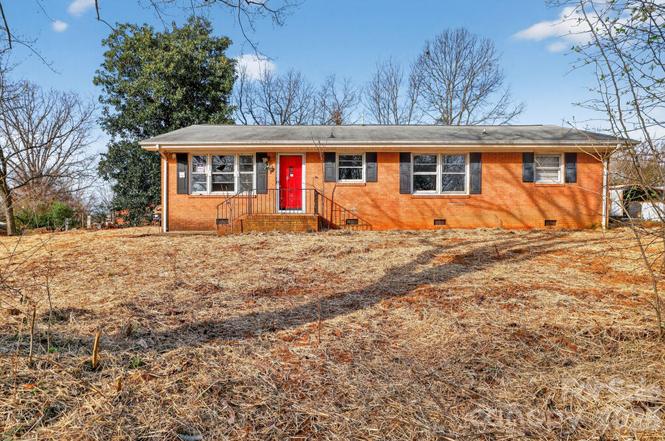
Listing remarks
Brick ranch on a large lot with a detached workshop. Solid home with hardwood floors and a great layout. Needs cosmetic updates, but priced accordingly. Great opportunity for an investor or buyer looking to build equity.
Key facts
- Great layout
- Large lot
- Detached workshop
Tags
Property features AI
Finance
- HOA & community: No HOA
Exterior
- Parking: Detached garage; 3 garage spaces; Has a garage
- Utilities: Water: Other (see remarks); Sewer: Other (see remarks)
- Home design: Single-family residential property; Site-built construction; One story (single level); R zoning
- Construction: Part brick and vinyl exterior; Crawl space foundation
- Exterior features: Lot includes both dirt and paved road frontage; Publicly maintained road access; Approximately 0.3 acre lot
Interior
- Kitchen: No appliances listed
- Bedrooms: 3 bedrooms on the main level
- Bathrooms: 1 full bathroom on the main level
- Heating & cooling: Heat pump heating; Central air conditioning
- Interior features: 3 total rooms; Fireplace in the family room
- Laundry & utility: No laundry features specified
Neighborhood map
What this means for you Summary
Snapshot
- This is a 3-bed/1.0-bath single-family listed at $86k.
Deal economics
- At list price, monthly cash flow is $546 ($7k/yr) — positive.
- The deal already cash-flows at list — no discount required.
- Meets the 1% rule at list price ($1k rent vs $86k).
- Recommended offer: $78k (9.0% below list) — sets the bar for market timing.
Location & tenants
- Location reads 63/100 on livability (#407 in NC) — a middle-class / working-renter tenant base. Strengths: cost of living A+, housing A+; Watch: schools C-, crime F, amenities F.
- Rutherford County Schools (rural): math 43% / reading 44% proficiency, ranked #98 of 178 in NC (top 55%) — families likely to look elsewhere, expect single-tenant / working-renter base with shorter leases; 60% free/reduced lunch — lower-income household profile, screen leases tightly.
- Market conditions: 48 active listings in the ZIP; 193 units permitted in Rutherford County in 2024 (0 in 5+ unit buildings).
Forward outlook
- Local home prices are declining (-3.0%/yr); year-one equity from $591 of loan paydown is wiped out by about $3k of value loss. Plan a longer hold.
- Rutherford County population projected at -17% by 2050 — secular population decline; favor cash flow + early exit over multi-decade hold.
- At projected returns (-3.0% appreciation + 3.0% rent growth), your $24k cash investment doubles in ~5 years — after that, you're playing with house money.
Negotiation context
- It's been on market 102 days — a 9% lower offer ($78k) is reasonable based on typical stale-listing flexibility.
Risks & watch-outs
- Climate carrying-cost: extreme-heat days projected 7→16/yr by 2055 (HVAC capex compounding) — expect insurance premiums to compound above CPI over the hold.
Questions for the listing agent
- It's been on market 102 days. Have you received any prior offers? Is the seller open to a 9% concession, seller financing, or rate buy-down credit?
- Built in 1964 — when were the roof, HVAC, electrical panel, plumbing, and water heater last replaced?
- Why hasn't it sold? Are there any deal-killer items the seller is aware of (foundation, flood, title, zoning, code violations)?
- Is there a deadline driving the sale (1031 exchange, divorce, estate, relocation)? That informs how much negotiation room exists.
- Crime grade is F in this area — have there been break-ins, vandalism, or insurance claims at this property in the last 3 years? What carrier currently insures it and at what premium?
- What's the average days-on-market for RENTAL listings here right now (not sales)? A rising rental-DOM trend means longer vacancies and softer asking-rent achievability than the comps imply.
- What's the recent tenant-quality profile in this submarket — average credit score on applications, eviction rate, late-payment / NSF rate, and stable-employment percentage? A property-management company in the area should have these aggregated.
- How much new for-sale + rental construction is in the pipeline within 1–3 miles? Heavy new supply typically softens prices + rents 12–24 months out; constrained supply supports both.
Investment metrics
- 1% rule
- 1.66% ✓
- Cap rate
- 13.96%
- Cash-on-cash
- 27.37%
- DSCR
- 2.22
- GRM
- 5.0
CMA / ARV
No comps found within radius.
Projected returns pro-forma
-3.0% appreciation · 3.0% rent growth · sell at horizon
- IRR
- 21.4%
- Equity multiple
- 1.87×
- Total profit
- $20,933
- Equity at exit
- $12,748
- IRR
- 29.5%
- Equity multiple
- 3.63×
- Total profit
- $63,050
- Equity at exit
- $7,392
Cash invested: $23,940 (down + closing). Projections, not guarantees.
Landlord ↔ Tenant lean methodology
- Overall (STATE)
- 85 Strongly Landlord-Friendly
- State North Carolina
- 85 Strongly Landlord-Friendly · R+3
- County
- — inherits STATE
- City
- — inherits STATE
ZIP-level market 28040
- Home prices YoY
- -10.1%
- Active inventory
- 48
- Price-to-rent
- 5.0×
Monthly cashflow live
- Estimated rent
- $1,416 medium interval (Pro) →
- Mortgage (P&I)
- −$448
- Tax from tax record
- −$89 /mo · $1,062/yr
- Insurance
- −$36
- HOA
- −$0
- Vacancy / Maint / Mgmt
- −$297
- Net cashflow
- $546
Break-even live
UW: 25.0% down · 7.5% · 30yr · 1.5% tax · 5.0% vac · 8.0% maint · 8.0% mgmt
Financing live
Cash to close
- Down payment
- $21,375
- Closing costs
- $2,565
- Reserves months
- —
- Total cash needed
- —
Loan-product check · same deal, 3 products live
Conventional
25% down · 7.5% · 30yr
- Down + closing
- —
- Monthly P&I
- —
- Monthly cashflow
- —
- DSCR
- —
- Eligible?
- —
Personal DTI + credit; lowest rate.
DSCR
20% down · 8.5% · 30yr
- Down + closing
- —
- Monthly P&I
- —
- Monthly cashflow
- —
- DSCR
- —
- Eligible?
- —
No personal income docs; deal must DSCR.
Hard money
10% down · 12.0% · 12mo
- Down + closing
- —
- Monthly P&I
- —
- Monthly cashflow
- —
- DSCR
- —
- Eligible?
- —
Short-term bridge; refi at stabilization.
Listing history 20 events
-
2026-06-19days on market $85,500 Active 102 DOM
-
2026-06-18days on market $85,500 Active 101 DOM
-
2026-06-17days on market $85,500 Active 100 DOM
-
2026-06-16days on market $85,500 Active 99 DOM
-
2026-06-15days on market $85,500 Active 98 DOM
-
2026-06-14days on market $85,500 Active 96 DOM
-
2026-06-13days on market $85,500 Active 95 DOM
-
2026-06-10days on market $85,500 Active 93 DOM
-
2026-06-09days on market $85,500 Active 92 DOM
-
2026-06-08days on market $85,500 Active 91 DOM
-
2026-06-07days on market $85,500 Active 90 DOM
-
2026-06-02days on market $85,500 Active 85 DOM
-
2026-06-01pricedays on market $85,500 Active 84 DOM
-
2026-05-31days on market $94,500 Active 83 DOM
-
2026-05-30days on market $94,500 Active 82 DOM
-
2026-04-29price $94,500
-
2026-04-21price $104,500
-
2026-04-08price $116,550
-
2026-03-19price $129,500
-
2026-03-09$144,900 Active
ⓘ Source: listings_history table (triggers on properties + properties_extension) + one-shot
backfill from property_details.listing_events for pre-trigger history.
Tax reassessment forecast NC · Resets to sale price
- Current annual tax
- $1,062 · $89/mo
- Projected year-2 tax
- $1,062 · $89/mo
- Expected delta
- $0/yr ($0/mo · 0.0%)
ⓘ Screening estimate from a state-policy table — verify with the county assessor before closing.
Climate risk First Street
- Flood 1/10 Low FEMA zone X (unshaded) · 0% chance over 30 yrs
- Wildfire 4/10 Moderate
- Heat 5/10 Major 7 d/yr ≥104°F today · 16 d/yr by 30 yrs out
- Wind 2/10 Low 100% chance of damaging wind over 30 yrs
- Air quality 3/10 Moderate 3 unhealthy d/yr today · 3 by 30 yrs out
Nearby sold comps map
Loading sold comps map…
Walkable amenities ~0.75 mi
Loading nearby amenities…
Taxation est. · year 1
- Rental income
- $16,991
- − Mortgage interest
- −$4,789
- − Property taxes
- −$1,062
- − Insurance
- −$428
- − Repairs & maintenance
- −$1,359
- − Management
- −$1,359
- − Depreciation
- −$2,487
- Taxable income
- $5,506
- Est. tax owed @ 24.0%
- −$1,321
- After-tax cash flow
- $5,231/yr
For passive investors: Depreciation is non-cash, so a rental often shows a tax loss while cash-flowing — sheltering income. Rental losses are passive: they offset passive income freely, and up to $25,000/yr can offset ordinary (W-2) income if you actively participate and your MAGI is under $100k (phasing out to $0 by $150k); unused losses carry forward. On sale, claimed depreciation is recaptured at up to 25%, and gains may owe capital-gains tax (a 1031 exchange can defer both). Figures are a year-1 estimate at your 24.0% rate — not tax advice; consult a CPA.
Schools (NCES district)
- District
- Rutherford County Schools
- NCES district ID
- 3704080
- Math proficiency
- 43% ▼ -1.00%
- Reading proficiency
- 44% ▼ -2.00%
- Median HH income
- $36,490
- Composite
- 36.11/100
- National rank
- #4753
- State rank
- #98 of 178 in NC
Livability — Ellenboro
- Score
- 63/100
- State rank
- #407
- US rank
- #15416
Category grades
Schools grade is shown separately in the Schools card above.
Census & demographics
- Census place
- Ellenboro, NC
- Population (ZIP)
- 7,047
Population outlook (Rutherford County) Hauer SSP2
- Today (2025)
- 63,695 people
- By 2030
- 61,670 · -3.2%
- By 2040
- 57,212 · -10.2%
- By 2050
- 52,763 · -17.2%
- By 2075
- 44,493 · -30.1%
- By 2100
- 38,127 · -40.1%
Race, ethnicity, and origin ACS 2023
- Neighborhood character
- Predominantly White (86%)
- Race & ethnicity
- White 86% Two or more races 5% Black 4% Hispanic / Latino 4%
- Common ancestry
- Serbian 3% Italian 1% Romanian 1%
- Foreign-born
- 3% · Canada
- Languages at home
- 94% English-only · Spanish 5%
Political lean MEDSL · Rutherford
- 2024 margin
- Solid R (+47.8) · D 25.8% · R 73.6%
- 2008→2024 swing
- -16.0pp toward R · 2008: -31.8pp · 2024: -47.8pp
- All cycles
- 2024: R+47.8 2020: R+45.8 2016: R+47.9 2012: R+33.5 2008: R+31.8
Not yet ingested
- Civics
- —
Market trends
- HPI YoY
- ▼ -30.84%
- Current HPI
- 274.2615
- Rent YoY
- —
- Metro
- —
- State GDP YoY
- ▲ 3.28%
- F500 in state
- 26
Industry mix (Fortune 500 HQ in NC)
| Industry | F500 HQs | Revenue |
|---|---|---|
| Financial Services | 2 | $213B |
|
||
| Retail | 2 | $95B |
|
||
| Industrial Conglomerate | 1 | $38B |
|
||
| Metals / Steel | 1 | $35B |
|
||
| Utilities | 1 | $30B |
|
||
| Industrial Machinery | 1 | $19B |
|
||
Price history
-34.8% since first listed5 events — show timeline
- 2026-04-29 Price Changed $94,500 CANOPYMLS as Distributed by MLS Grid
- 2026-04-21 Price Changed $104,500 CANOPYMLS as Distributed by MLS Grid
- 2026-04-08 Price Changed $116,550 CANOPYMLS as Distributed by MLS Grid
- 2026-03-19 Price Changed $129,500 CANOPYMLS as Distributed by MLS Grid
- 2026-03-09 Listed $144,900 CANOPYMLS as Distributed by MLS Grid
Property tax history
+3.9%/yrLatest (2025): $1,062 · +7.2% YoY. Source: county tax records.
Cash-flow waterfall
monthlySold comps — $/sqft
last 12 mo · ≤1 miLoading sold comps…