155 W End Dr · Moncks Corner, SC
Flood risk 1/10 · Minimal
- FEMA flood zone
- X (unshaded)
- Chance of flooding over 30 yrs
- 0.0%
- Est. flood insurance / yr
- $507 – $1,088
Fire risk 6/10 · Moderate
- Est. fire insurance / yr
- $783 – $1,453
Heat risk 8/10 · Major
- Hot days now (above 109°F)
- 7 days/yr
- Hot days in 30 yrs
- 17 days/yr
Wind risk 8/10 · Major
- Chance of severe wind over 30 yrs
- 80.0%
Air-quality risk 2/10 · Minimal
- Unhealthy air days now
- 2 days/yr
- Unhealthy air days in 30 yrs
- 2 days/yr
Risk factors via First Street. Map © Google.
Why this score? — see what drove the B- grade
The composite is a weighted blend of 9 inputs, each scored 0–100. Each bar is that input's sub-score; the figure is the points it added to the 100-point composite (weight × sub-score).
- Cash flow +28.6/30.0
- DSCR +10.0/10.0
- 1% rule +7.7/10.0
- ARV discount +7.5/15.0
- Schools +3.6/10.0
- Livability +3.4/5.0
- Rent growth +3.2/5.0
- Condition / age +2.5/5.0
- Appreciation +0.0/10.0
$160,000
🖨 Deal sheet (PDF) 📄 Offer letter ✓ Due diligence
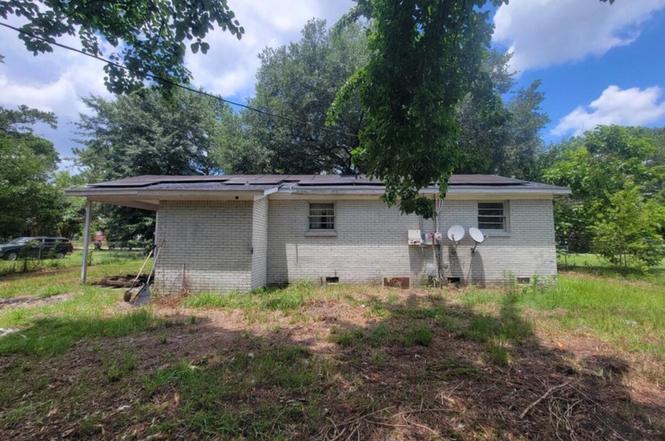
Listing remarks
Situated on a half-acre lot with convenient access to Moncks Corner, this property offers strong potential for the buyer looking to bring their own vision to life. With TLC and patience, it could be an excellent value opportunity in a growing area.
Key facts
- 0.5 acre lot
- Parking
- Built 1972
Property features AI
Finance
- HOA & community: Community trash service available
Exterior
- Parking: Attached 1-car carport; Total parking for 1 vehicle
- Utilities: Public sewer; Water and sewer via BCW & SA; Electric service from Berkeley Electric Co-Op
- Home design: Single-family detached residential property; One story; Ground-level entry
- Construction: No additional construction details provided
- Exterior features: Architectural roof; Storage structure on property; Interior, level lot in a high area; Lot size under 0.5 acre
Interior
- Kitchen: Electric range
- Bedrooms: 3 bedrooms, primary bedroom on the lower level
- Flooring: Vinyl flooring; Wood flooring
- Bathrooms: 1 bathroom
- Heating & cooling: Electric heating; Central air conditioning
- Interior features: Blown ceiling
- Laundry & utility: Washer hookup; Electric dryer hookup
Neighborhood map
What this means for you Summary
Snapshot
- This is a 3-bed/1.0-bath single-family listed at $160k.
Deal economics
- At list price, monthly cash flow is $528 ($6k/yr) — positive.
- The deal already cash-flows at list — no discount required.
- Meets the 1% rule at list price ($2k rent vs $160k).
- Recommended offer: $141k (12.0% below list) — sets the bar for market timing.
- Cap rate 10.3% vs local median 4.6% in Moncks Corner — top-decile yield for the area; either an underpriced asset or a hidden risk that comps aren't pricing in. Stress-test before assuming the spread holds.
Location & tenants
- Location reads 67/100 on livability (#99 in SC) — a middle-class / working-renter tenant base. Strengths: housing A+, health & safety A+, cost of living A; Watch: crime C-, amenities F, commute F.
- Berkeley 01 (suburban): math 35% / reading 48% proficiency, ranked #30 of 80 in SC (top 38%) — families likely to look elsewhere, expect single-tenant / working-renter base with shorter leases.
- Zoned schools: Berkeley Elementary (619 students, 100% FRL); Berkeley High (math 36% / reading 83%, grade C+, #110 of 196 statewide, top 58%, 1,776 students, 50% FRL) — zoned schools average 75% FRL vs 48% district-wide (27 pts higher); higher-poverty schools than district average — tighter screening recommended.
- Zoned-school proficiency averages 60% at this address vs 42% district-wide (+18 pts) — the actual schools serving this property are materially stronger than the Berkeley 01 average implies; a family-tenant draw the district grade alone would hide.
- Market conditions: Rents rising (+2.8%/yr); 644 active listings in the ZIP; solid renter incomes; 3,183 units permitted in Berkeley County in 2024 (580 in 5+ unit buildings).
Forward outlook
- Local home prices are declining (-3.0%/yr); year-one equity from $1k of loan paydown is wiped out by about $5k of value loss. Plan a longer hold.
- Berkeley County population projected at +48% by 2050 — long-run rental-demand tailwind backs the buy-and-hold thesis.
- At projected returns (-3.0% appreciation + 2.8% rent growth), your $45k cash investment doubles in ~9 years — after that, you're playing with house money.
Negotiation context
- It's been on market 199 days — a 12% lower offer ($141k) is reasonable based on typical stale-listing flexibility.
- 11 sale attempts since 24y ago with the ask held roughly flat each time — persistent listings suggest the price (not the market) is what's stuck; bring a comps-based counter.
- Current owner paid $120k; 33% above their basis — modest negotiation headroom, anchor on the comps not their cost.
Risks & watch-outs
- Climate carrying-cost: severe wind risk, 80% chance of damaging wind over 30y; major wildfire risk; extreme-heat days projected 7→17/yr by 2055 (HVAC capex compounding) — expect insurance premiums to compound above CPI over the hold.
Questions for the listing agent
- It's been on market 199 days. Have you received any prior offers? Is the seller open to a 12% concession, seller financing, or rate buy-down credit?
- Built in 1972 — when were the roof, HVAC, electrical panel, plumbing, and water heater last replaced?
- Why hasn't it sold? Are there any deal-killer items the seller is aware of (foundation, flood, title, zoning, code violations)?
- Is there a deadline driving the sale (1031 exchange, divorce, estate, relocation)? That informs how much negotiation room exists.
- Schools are D-rated, which usually means shorter tenancies and higher turnover. Who's the typical renter profile here, and what's been the actual vacancy rate?
- What's the average days-on-market for RENTAL listings here right now (not sales)? A rising rental-DOM trend means longer vacancies and softer asking-rent achievability than the comps imply.
- What's the recent tenant-quality profile in this submarket — average credit score on applications, eviction rate, late-payment / NSF rate, and stable-employment percentage? A property-management company in the area should have these aggregated.
- How much new for-sale + rental construction is in the pipeline within 1–3 miles? Heavy new supply typically softens prices + rents 12–24 months out; constrained supply supports both.
Investment metrics
- 1% rule
- 1.27% ✓
- Cap rate
- 10.25%
- Cash-on-cash
- 14.14%
- DSCR
- 1.63
- GRM
- 6.6
CMA / ARV
No comps found within radius.
Projected returns pro-forma
-3.0% appreciation · 2.77% rent growth · sell at horizon
- IRR
- 4.2%
- Equity multiple
- 1.16×
- Total profit
- $7,246
- Equity at exit
- $23,857
- IRR
- 13.5%
- Equity multiple
- 2.07×
- Total profit
- $47,747
- Equity at exit
- $13,834
Cash invested: $44,800 (down + closing). Projections, not guarantees.
Landlord ↔ Tenant lean methodology
- Overall (STATE)
- 90 Strongly Landlord-Friendly
- State South Carolina
- 90 Strongly Landlord-Friendly · R+6
- County
- — inherits STATE
- City
- — inherits STATE
ZIP-level market 29461
- Home prices YoY
- -13.9%
- Rents YoY
- 2.8%
- Active inventory
- 644
- Price-to-rent
- 6.6×
Monthly cashflow live
- Estimated rent
- $2,028 medium interval (Pro) →
- Mortgage (P&I)
- −$839
- Tax from tax record
- −$168 /mo · $2,019/yr
- Insurance
- −$67
- HOA
- −$0
- Vacancy / Maint / Mgmt
- −$426
- Net cashflow
- $528
Break-even live
Sensitivity live
| Price | -10% $619 | -5% $573 | +0% $528 | +5% $483 | +10% $437 |
|---|---|---|---|---|---|
| Rent | -10% $368 | -5% $448 | +0% $528 | +5% $608 | +10% $688 |
| Rate | -1.0pp $609 | -0.5pp $569 | base $528 | +0.5pp $487 | +1.0pp $444 |
UW: 25.0% down · 7.5% · 30yr · 1.5% tax · 5.0% vac · 8.0% maint · 8.0% mgmt
Financing live
Cash to close
- Down payment
- $40,000
- Closing costs
- $4,800
- Reserves months
- —
- Total cash needed
- —
Loan-product check · same deal, 3 products live
Conventional
25% down · 7.5% · 30yr
- Down + closing
- —
- Monthly P&I
- —
- Monthly cashflow
- —
- DSCR
- —
- Eligible?
- —
Personal DTI + credit; lowest rate.
DSCR
20% down · 8.5% · 30yr
- Down + closing
- —
- Monthly P&I
- —
- Monthly cashflow
- —
- DSCR
- —
- Eligible?
- —
No personal income docs; deal must DSCR.
Hard money
10% down · 12.0% · 12mo
- Down + closing
- —
- Monthly P&I
- —
- Monthly cashflow
- —
- DSCR
- —
- Eligible?
- —
Short-term bridge; refi at stabilization.
Listing history 50 events
-
2026-06-21days on market $160,000 Active 199 DOM
-
2026-06-18days on market $160,000 Active 196 DOM
-
2026-06-17days on market $160,000 Active 195 DOM
-
2026-06-16days on market $160,000 Active 194 DOM
-
2026-06-15days on market $160,000 Active 193 DOM
-
2026-06-13days on market $160,000 Active 191 DOM
-
2026-06-13days on market $160,000 Active 190 DOM
-
2026-06-10days on market $160,000 Active 188 DOM
-
2026-06-09days on market $160,000 Active 187 DOM
-
2026-06-08days on market $160,000 Active 186 DOM
-
2026-06-07days on market $160,000 Active 185 DOM
-
2026-06-05days on market $160,000 Active 182 DOM
-
2026-06-03days on market $160,000 Active 181 DOM
-
2026-06-03days on market $160,000 Active 180 DOM
-
2026-06-01days on market $160,000 Active 179 DOM
-
2026-05-31days on market $160,000 Active 178 DOM
-
2025-12-04$160,000 Active
-
2025-05-20historical
-
2025-05-12status Active
-
2025-05-12price $172,000
-
2025-05-05historical Active Under Contract
-
2025-04-11status Pending
-
2025-04-02price $179,000
-
2025-03-25price $180,000
-
2025-03-11price $183,000
-
2025-03-05price $184,000
-
2025-02-28price $186,000
-
2025-02-18price $188,000
-
2025-01-14status Active
-
2025-01-02historical Active Under Contract
-
2024-11-30price $189,000
-
2024-10-21price $195,000
-
2024-10-07price $197,500
-
2024-09-27$199,000 Active
-
2024-09-25historical
-
2024-09-21status Active
-
2024-09-21price $199,000
-
2024-08-24historical Active Under Contract
-
2024-08-21price $145,000
-
2024-07-31price $150,000
-
2024-07-26price $165,000
-
2024-07-11$170,000 Active
-
2020-12-31soldstatus $120,000
-
2020-12-30soldstatus $120,000 Closed
-
2020-08-16historical Active Contingent
-
2020-08-14price $120,000
-
2020-06-17status Active
-
2020-04-05historical Active Contingent
-
2020-03-25$135,000 Active
-
2004-05-14soldstatus $69,900
ⓘ Source: listings_history table (triggers on properties + properties_extension) + one-shot
backfill from property_details.listing_events for pre-trigger history.
Tax reassessment forecast SC · Resets to sale price
- Current annual tax
- $2,019 · $168/mo
- Projected year-2 tax
- $2,019 · $168/mo
- Expected delta
- $0/yr ($0/mo · 0.0%)
ⓘ Screening estimate from a state-policy table — verify with the county assessor before closing.
Climate risk First Street
- Flood 1/10 Low FEMA zone X (unshaded) · 0% chance over 30 yrs
- Wildfire 6/10 Major
- Heat 8/10 Severe 7 d/yr ≥109°F today · 17 d/yr by 30 yrs out
- Wind 8/10 Severe 80% chance of damaging wind over 30 yrs
- Air quality 2/10 Low 2 unhealthy d/yr today · 2 by 30 yrs out
Nearby sold comps map
Loading sold comps map…
Walkable amenities ~0.75 mi
Loading nearby amenities…
Taxation est. · year 1
- Rental income
- $24,334
- − Mortgage interest
- −$8,962
- − Property taxes
- −$2,019
- − Insurance
- −$800
- − Repairs & maintenance
- −$1,947
- − Management
- −$1,947
- − Depreciation
- −$4,655
- Taxable income
- $4,005
- Est. tax owed @ 24.0%
- −$961
- After-tax cash flow
- $5,375/yr
For passive investors: Depreciation is non-cash, so a rental often shows a tax loss while cash-flowing — sheltering income. Rental losses are passive: they offset passive income freely, and up to $25,000/yr can offset ordinary (W-2) income if you actively participate and your MAGI is under $100k (phasing out to $0 by $150k); unused losses carry forward. On sale, claimed depreciation is recaptured at up to 25%, and gains may owe capital-gains tax (a 1031 exchange can defer both). Figures are a year-1 estimate at your 24.0% rate — not tax advice; consult a CPA.
Schools (NCES district)
- District
- Berkeley 01
- NCES district ID
- 4501170
- Math proficiency
- 35% ▼ -8.00%
- Reading proficiency
- 48% ▼ -2.00%
- Median HH income
- $52,724
- Composite
- 35.95/100
- National rank
- #4799
- State rank
- #30 of 80 in SC
Livability — Moncks Corner
- Score
- 67/100
- State rank
- #99
- US rank
- #10812
Category grades
Schools grade is shown separately in the Schools card above.
Census & demographics
- County
- Berkeley County · 198,768 people
- City population
- 43,816
- Metro
- Charleston-North Charleston, SC
- Population (ZIP)
- 43,816
- Household income
- $82,666
- Rent vs Own
- Severe rent burden
- 815.0
Population outlook (Berkeley County) Hauer SSP2
- Today (2025)
- 254,184 people
- By 2030
- 279,677 · +10.0%
- By 2040
- 329,379 · +29.6%
- By 2050
- 375,557 · +47.8%
- By 2075
- 476,740 · +87.6%
- By 2100
- 535,945 · +110.8%
Race, ethnicity, and origin ACS 2023
- Neighborhood character
- Majority White (61%)
- Race & ethnicity
- White 61% Black 29% Hispanic / Latino 6% Two or more races 5%
- Hispanic origin (detail)
- Mexican 2% Puerto Rican 2%
- Common ancestry
- Lithuanian 1% Slovak 1% Romanian 1%
- Foreign-born
- 3% · Canada
- Languages at home
- 96% English-only · Spanish 3%
Political lean MEDSL · Berkeley
- 2024 margin
- R (+16.3) · D 41.1% · R 57.4% · Other 1.4%
- 2008→2024 swing
- -3.2pp toward R · 2008: -13.1pp · 2024: -16.3pp
- All cycles
- 2024: R+16.3 2020: R+11.7 2016: R+17.4 2012: R+18.9 2008: R+13.1
Not yet ingested
- Civics
- —
Market trends
- HPI YoY
- ▼ -52.95%
- Current HPI
- 328.7212
- Rent YoY
- ▲ 2.77%
- Metro
- Charleston-North Charleston, SC
- State GDP YoY
- ▲ 4.51%
- F500 in state
- 2
Industry mix (Fortune 500 HQ in SC)
| Industry | F500 HQs | Revenue |
|---|---|---|
| Packaging | 1 | $7B |
|
||
Price history
+392.3% since first listed40 events — show timeline
- 2025-12-04 Listed $160,000 Charleston Trident MLS
- 2025-05-20 Listing Removed — Charleston Trident MLS
- 2025-05-12 Relisted — Charleston Trident MLS
- 2025-05-12 Price Changed $172,000 Charleston Trident MLS
- 2025-05-05 Contingent — Charleston Trident MLS
- 2025-04-11 Pending — Charleston Trident MLS
- 2025-04-02 Price Changed $179,000 Charleston Trident MLS
- 2025-03-25 Price Changed $180,000 Charleston Trident MLS
- 2025-03-11 Price Changed $183,000 Charleston Trident MLS
- 2025-03-05 Price Changed $184,000 Charleston Trident MLS
- 2025-02-28 Price Changed $186,000 Charleston Trident MLS
- 2025-02-18 Price Changed $188,000 Charleston Trident MLS
- 2025-01-14 Relisted — Charleston Trident MLS
- 2025-01-02 Contingent — Charleston Trident MLS
- 2024-11-30 Price Changed $189,000 Charleston Trident MLS
- 2024-10-21 Price Changed $195,000 Charleston Trident MLS
- 2024-10-07 Price Changed $197,500 Charleston Trident MLS
- 2024-09-27 Listed $199,000 Charleston Trident MLS
- 2024-09-25 Listing Removed — Charleston Trident MLS
- 2024-09-21 Relisted — Charleston Trident MLS
- 2024-09-21 Price Changed $199,000 Charleston Trident MLS
- 2024-08-24 Contingent — Charleston Trident MLS
- 2024-08-21 Price Changed $145,000 Charleston Trident MLS
- 2024-07-31 Price Changed $150,000 Charleston Trident MLS
- 2024-07-26 Price Changed $165,000 Charleston Trident MLS
- 2024-07-11 Listed $170,000 Charleston Trident MLS
- 2020-12-31 Sold (Public Records) $120,000 Public Records
- 2020-12-30 Sold (MLS) $120,000 Charleston Trident MLS
- 2020-08-16 Contingent — Charleston Trident MLS
- 2020-08-14 Price Changed $120,000 Charleston Trident MLS
- 2020-06-17 Relisted — Charleston Trident MLS
- 2020-04-05 Contingent — Charleston Trident MLS
- 2020-03-25 Listed $135,000 Charleston Trident MLS
- 2004-05-14 Sold (Public Records) $69,900 Public Records
- 2004-05-10 Sold (MLS) $69,900 Charleston Trident MLS
- 2003-12-31 Listed $69,900 Charleston Trident MLS
- 2003-11-13 Listing Removed — Charleston Trident MLS
- 2003-04-26 Listed $79,900 Charleston Trident MLS
- 2002-06-25 Sold (MLS) $33,000 Charleston Trident MLS
- 2002-03-06 Listed $32,500 Charleston Trident MLS
Property tax history
+13.1%/yrLatest (2025): $2,019 · +1.9% YoY. Source: county tax records.
Cash-flow waterfall
monthlySold comps — $/sqft
last 12 mo · ≤1 miLoading sold comps…