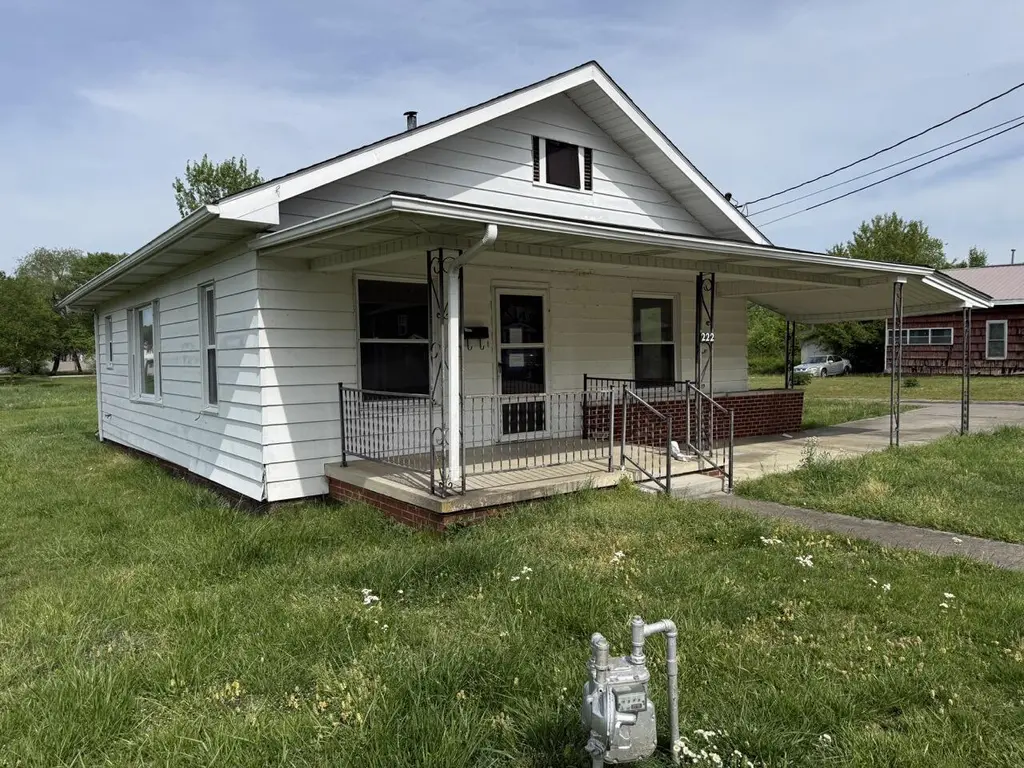
222 Hamlin Ave · Corbin, KY
Flood risk 1/10 · Minimal
- FEMA flood zone
- X (unshaded)
- Chance of flooding over 30 yrs
- 0.0%
- Est. flood insurance / yr
- $507 – $1,088
Fire risk 3/10 · Minor
- Est. fire insurance / yr
- $839 – $1,559
Heat risk 4/10 · Minor
- Hot days now (above 100°F)
- 7 days/yr
- Hot days in 30 yrs
- 20 days/yr
Wind risk 2/10 · Minimal
- Chance of severe wind over 30 yrs
- 4.0%
Air-quality risk 2/10 · Minimal
- Unhealthy air days now
- 0 days/yr
- Unhealthy air days in 30 yrs
- 1 days/yr
Risk factors via First Street. Map © Google.
Why this score? — see what drove the B+ grade
The composite is a weighted blend of 9 inputs, each scored 0–100. Each bar is that input's sub-score; the figure is the points it added to the 100-point composite (weight × sub-score).
- Cash flow +30.0/30.0
- 1% rule +10.0/10.0
- DSCR +10.0/10.0
- ARV discount +7.5/15.0
- Appreciation +5.9/10.0
- Schools +3.8/10.0
- Livability +3.5/5.0
- Rent growth +2.5/5.0
- Condition / age +2.5/5.0
$59,900
🖨 Deal sheet (PDF) 📄 Offer letter ✓ Due diligence
Listing remarks MLS
Home offers 2 bedrooms, 1.5 baths, carport, formal dining room, and large lot in city limits.
Key facts
- Covered porch
- Carport
- 0.6 acre lot
Tags
Property features AI
Exterior
- Parking: Attached carport; Driveway; Carport present
- Utilities: Public water; Public sewer
- Home design: One-story house
- Construction: Aluminum siding
- Exterior features: Block foundation
Interior
- Kitchen: Microwave; Refrigerator; Range
- Bedrooms: 6 total rooms (including bedrooms)
- Flooring: Carpet; Laminate
- Bathrooms: 1 full bathroom; 1 half bathroom
- Heating & cooling: Forced air heating; Electric cooling
- Interior features: Microwave; Refrigerator; Range
Neighborhood map
What this means for you Summary
Snapshot
- This is a 2-bed/1.0-bath single-family listed at $60k.
Deal economics
- At list price, monthly cash flow is $366 ($4k/yr) — positive.
- The deal already cash-flows at list — no discount required.
- Meets the 1% rule at list price ($943 rent vs $60k).
- Recommended offer: $58k (3.0% below list) — sets the bar for market timing.
- Cap rate 13.6% vs local median 3.4% in Corbin — top-decile yield for the area; either an underpriced asset or a hidden risk that comps aren't pricing in. Stress-test before assuming the spread holds.
Location & tenants
- Location reads 69/100 on livability (#179 in KY) — a middle-class / working-renter tenant base. Strengths: cost of living A+, housing A+, crime A-; Watch: amenities F, commute F, employment F.
- Corbin Independent (town): math 42% / reading 50% proficiency, ranked #20 of 165 in KY (top 12%) — families likely to look elsewhere, expect single-tenant / working-renter base with shorter leases.
- Zoned schools: Corbin Middle School (math 46% / reading 56%, grade C, #20 of 217 statewide, top 10%, 646 students, 58% FRL); Corbin High School (math 22% / reading 42%, grade F, #97 of 254 statewide, top 46%, 829 students, 53% FRL).
- Market conditions: 331 active listings in the ZIP.
Forward outlook
- In year one you build about $2k of equity ($414 loan paydown + $1k appreciation (1.8% local appreciation)).
- Knox County population projected at -16% by 2050 — secular population decline; favor cash flow + early exit over multi-decade hold.
- At projected returns (1.8% appreciation + 3.0% rent growth), your $17k cash investment doubles in ~3 years — after that, you're playing with house money.
Negotiation context
- It's been on market 37 days — a 3% lower offer ($58k) is reasonable based on typical stale-listing flexibility.
- 8 sale attempts since 19y ago with the ask held roughly flat each time — persistent listings suggest the price (not the market) is what's stuck; bring a comps-based counter.
Risks & watch-outs
- Watch-outs: built in 1940 — expect roof / HVAC / electrical / plumbing capex.
Questions for the listing agent
- It's been on market 37 days. Have you received any prior offers? Is the seller open to a 3% concession, seller financing, or rate buy-down credit?
- Built in 1940 — when were the roof, HVAC, electrical panel, plumbing, and water heater last replaced?
- Is there a deadline driving the sale (1031 exchange, divorce, estate, relocation)? That informs how much negotiation room exists.
- Schools are B-rated — typically a magnet for longer-tenancy family renters. What's the average tenant stay here, and is there a school-zone premium baked into asking?
- What's the average days-on-market for RENTAL listings here right now (not sales)? A rising rental-DOM trend means longer vacancies and softer asking-rent achievability than the comps imply.
- What's the recent tenant-quality profile in this submarket — average credit score on applications, eviction rate, late-payment / NSF rate, and stable-employment percentage? A property-management company in the area should have these aggregated.
- How much new for-sale + rental construction is in the pipeline within 1–3 miles? Heavy new supply typically softens prices + rents 12–24 months out; constrained supply supports both.
Investment metrics
- 1% rule
- 1.57% ✓
- Cap rate
- 13.63%
- Cash-on-cash
- 26.19%
- DSCR
- 2.17
- GRM
- 5.3
CMA / ARV
- ARV (on-the-fly)
- $123,250
- Comps found
- 9
Show comp detail 9 sales within ~0.75 mi
| Address | Dist | Beds/Ba | Sqft | Sold | Price | $/sf | Match |
|---|---|---|---|---|---|---|---|
| 231 Hatfield St | 0.09mi | 3/1.0 (+1) | 1,018 (+3%) | 12mo | $158,762 | $156 | 76 |
| 95 East Cypress St | 0.44mi | 3/1.0 (+1) | 1,000 (+1%) | 22mo | $62,000 | $62 | 54 |
| 603 South Poplar Ave | 0.63mi | 2/1.0 | 961 (-2%) | 16mo | $120,000 | $125 | 53 |
| 310 Ruby St | 0.28mi | 3/1.0 (+1) | 856 (-13%) | 9mo | $50,000 | $58 | 52 |
| 231 Wilson St | 0.13mi | 1/1.0 (-1) | 840 (-15%) | 18mo | $119,000 | $142 | 49 |
| 507 Caldwell St | 0.40mi | 3/1.0 (+1) | 1,104 (+12%) | 12mo | $166,200 | $151 | 46 |
| 64 Beech Tree Ln Ln | 0.63mi | 2/2.0 | 1,080 (+10%) | 9mo | $179,900 | $167 | 43 |
| 602 Caldwell St | 0.42mi | 3/2.0 (+1) | 1,117 (+13%) | 21mo | $75,000 | $67 | 32 |
| 818 South Poplar Ave | 0.66mi | 2/1.0 | 1,104 (+12%) | 23mo | $75,000 | $68 | 30 |
Match score weights: distance 35% · size 25% · config 20% · recency 20%. Top-matched comps best support the ARV.
Projected returns pro-forma
1.82% appreciation · 3.0% rent growth · sell at horizon
- IRR
- 30.0%
- Equity multiple
- 2.60×
- Total profit
- $26,883
- Equity at exit
- $23,059
- IRR
- 31.6%
- Equity multiple
- 5.04×
- Total profit
- $67,779
- Equity at exit
- $32,776
Cash invested: $16,772 (down + closing). Projections, not guarantees.
Landlord ↔ Tenant lean methodology
- Overall (STATE)
- 83 Strongly Landlord-Friendly
- State Kentucky
- 83 Strongly Landlord-Friendly · R+16
- County
- — inherits STATE
- City
- — inherits STATE
ZIP-level market 40701
- Home prices YoY
- 0.6%
- Active inventory
- 331
- Price-to-rent
- 5.3×
Monthly cashflow live
- Estimated rent
- $943 medium interval (Pro) →
- Mortgage (P&I)
- −$314
- Tax from tax record
- −$40 /mo · $476/yr
- Insurance
- −$25
- HOA
- −$0
- Vacancy / Maint / Mgmt
- −$198
- Net cashflow
- $366
Break-even live
Sensitivity live
| Price | -10% $400 | -5% $383 | +0% $366 | +5% $349 | +10% $332 |
|---|---|---|---|---|---|
| Rent | -10% $292 | -5% $329 | +0% $366 | +5% $403 | +10% $441 |
| Rate | -1.0pp $396 | -0.5pp $381 | base $366 | +0.5pp $351 | +1.0pp $335 |
UW: 25.0% down · 7.5% · 30yr · 1.5% tax · 5.0% vac · 8.0% maint · 8.0% mgmt
Financing live
Cash to close
- Down payment
- $14,975
- Closing costs
- $1,797
- Reserves months
- —
- Total cash needed
- —
Loan-product check · same deal, 3 products live
Conventional
25% down · 7.5% · 30yr
- Down + closing
- —
- Monthly P&I
- —
- Monthly cashflow
- —
- DSCR
- —
- Eligible?
- —
Personal DTI + credit; lowest rate.
DSCR
20% down · 8.5% · 30yr
- Down + closing
- —
- Monthly P&I
- —
- Monthly cashflow
- —
- DSCR
- —
- Eligible?
- —
No personal income docs; deal must DSCR.
Hard money
10% down · 12.0% · 12mo
- Down + closing
- —
- Monthly P&I
- —
- Monthly cashflow
- —
- DSCR
- —
- Eligible?
- —
Short-term bridge; refi at stabilization.
Listing history 31 events
-
2026-06-15statusdays on market $59,900 Pending 37 DOM
-
2026-06-13days on market $59,900 Active 36 DOM
-
2026-06-12days on market $59,900 Active 35 DOM
-
2026-06-09days on market $59,900 Active 32 DOM
-
2026-06-08days on market $59,900 Active 31 DOM
-
2026-06-07days on market $59,900 Active 30 DOM
-
2026-06-04days on market $59,900 Active 26 DOM
-
2026-06-02days on market $59,900 Active 25 DOM
-
2026-06-01days on market $59,900 Active 24 DOM
-
2026-05-31days on market $59,900 Active 23 DOM
-
2026-05-31remarks 574-char remark
-
2026-05-31status $59,900 Active 22 DOM
-
2026-05-08status Pending
-
2026-04-14$59,900 Active
-
2022-07-08soldstatus $95,000 Closed 93-char remark
Show marketing remark (93 chars)
Home offers 2 bedrooms, 1.5 baths, carport, formal dining room, and large lot in city limits.
-
2022-07-08soldstatus $95,000
Show marketing remark (93 chars)
Home offers 2 bedrooms, 1.5 baths, carport, formal dining room, and large lot in city limits.
-
2022-06-06historical Contingent 93-char remark
Show marketing remark (93 chars)
Home offers 2 bedrooms, 1.5 baths, carport, formal dining room, and large lot in city limits.
-
2022-05-11status Active 93-char remark
Show marketing remark (93 chars)
Home offers 2 bedrooms, 1.5 baths, carport, formal dining room, and large lot in city limits.
-
2022-03-26historical Contingent 93-char remark
Show marketing remark (93 chars)
Home offers 2 bedrooms, 1.5 baths, carport, formal dining room, and large lot in city limits.
-
2022-03-15status Active 93-char remark
Show marketing remark (93 chars)
Home offers 2 bedrooms, 1.5 baths, carport, formal dining room, and large lot in city limits.
-
2022-02-19historical Contingent 93-char remark
Show marketing remark (93 chars)
Home offers 2 bedrooms, 1.5 baths, carport, formal dining room, and large lot in city limits.
-
2022-02-14status Active 93-char remark
Show marketing remark (93 chars)
Home offers 2 bedrooms, 1.5 baths, carport, formal dining room, and large lot in city limits.
-
2022-01-29status Pending 93-char remark
Show marketing remark (93 chars)
Home offers 2 bedrooms, 1.5 baths, carport, formal dining room, and large lot in city limits.
-
2022-01-27$99,900 Active 93-char remark
Show marketing remark (93 chars)
Home offers 2 bedrooms, 1.5 baths, carport, formal dining room, and large lot in city limits.
-
2009-01-31historical
-
2008-09-23$62,900
-
2008-08-31historical
-
2008-02-21$69,500
-
2008-02-08historical
-
2007-08-10$72,500
-
1979-08-01soldstatus $18,500
ⓘ Source: listings_history table (triggers on properties + properties_extension) + one-shot
backfill from property_details.listing_events for pre-trigger history.
Tax reassessment forecast KY · Resets to sale price
- Current annual tax
- $476 · $40/mo
- Projected year-2 tax
- $515 · $43/mo
- Expected delta
- +$39/yr (+$3/mo · 8.2%)
ⓘ Screening estimate from a state-policy table — verify with the county assessor before closing.
Climate risk First Street
- Flood 1/10 Low FEMA zone X (unshaded) · 0% chance over 30 yrs
- Wildfire 3/10 Moderate
- Heat 4/10 Moderate 7 d/yr ≥100°F today · 20 d/yr by 30 yrs out
- Wind 2/10 Low 4% chance of damaging wind over 30 yrs
- Air quality 2/10 Low 0 unhealthy d/yr today · 1 by 30 yrs out
Nearby sold comps map
Loading sold comps map…
Walkable amenities ~0.75 mi
Loading nearby amenities…
Taxation est. · year 1
- Rental income
- $11,314
- − Mortgage interest
- −$3,355
- − Property taxes
- −$476
- − Insurance
- −$300
- − Repairs & maintenance
- −$905
- − Management
- −$905
- − Depreciation
- −$1,743
- Taxable income
- $3,630
- Est. tax owed @ 24.0%
- −$871
- After-tax cash flow
- $3,522/yr
For passive investors: Depreciation is non-cash, so a rental often shows a tax loss while cash-flowing — sheltering income. Rental losses are passive: they offset passive income freely, and up to $25,000/yr can offset ordinary (W-2) income if you actively participate and your MAGI is under $100k (phasing out to $0 by $150k); unused losses carry forward. On sale, claimed depreciation is recaptured at up to 25%, and gains may owe capital-gains tax (a 1031 exchange can defer both). Figures are a year-1 estimate at your 24.0% rate — not tax advice; consult a CPA.
Schools (NCES district)
- District
- Corbin Independent
- NCES district ID
- 2101320
- Math proficiency
- 42% ▼ -19.00%
- Reading proficiency
- 50% ▼ -13.00%
- Median HH income
- $36,928
- Composite
- 38.19/100
- National rank
- #4259
- State rank
- #20 of 165 in KY
Livability — Corbin
- Score
- 69/100
- State rank
- #179
- US rank
- #8891
Category grades
Schools grade is shown separately in the Schools card above.
Census & demographics
- Census place
- Corbin, KY
- Population (ZIP)
- 29,767
Population outlook (Knox County) Hauer SSP2
- Today (2025)
- 30,741 people
- By 2030
- 29,887 · -2.8%
- By 2040
- 27,940 · -9.1%
- By 2050
- 25,826 · -16.0%
- By 2075
- 20,895 · -32.0%
- By 2100
- 16,238 · -47.2%
Race, ethnicity, and origin ACS 2023
- Neighborhood character
- Predominantly White (95%)
- Race & ethnicity
- White 95% Two or more races 3% Hispanic / Latino 1%
- Common ancestry
- Serbian 2% Slovak 2% Italian 1%
- Foreign-born
- 1% · Canada
- Languages at home
- 99% English-only · Spanish 1%
Political lean MEDSL · Knox
- 2024 margin
- Solid R (+71.1) · D 13.8% · R 85.0% · Other 1.2%
- 2008→2024 swing
- -26.6pp toward R · 2008: -44.6pp · 2024: -71.1pp
- All cycles
- 2024: R+71.1 2020: R+67.0 2016: R+67.7 2012: R+53.9 2008: R+44.6
Not yet ingested
- Civics
- —
Market trends
- HPI YoY
- ▲ 1.82%
- Current HPI
- 294.7961
- Rent YoY
- —
- Metro
- —
- State GDP YoY
- ▲ 1.81%
- F500 in state
- 4
Industry mix (Fortune 500 HQ in KY)
| Industry | F500 HQs | Revenue |
|---|---|---|
| Healthcare | 1 | $118B |
|
||
| Food / Beverage | 1 | $7B |
|
||
Price history
+223.8% since first listed19 events — show timeline
- 2026-05-08 Pending — ImagineMLS
- 2026-04-14 Listed $59,900 ImagineMLS
- 2022-07-08 Sold (Public Records) $95,000 Public Records
- 2022-07-08 Sold (MLS) $95,000 ImagineMLS
- 2022-06-06 Contingent — ImagineMLS
- 2022-05-11 Relisted — ImagineMLS
- 2022-03-26 Contingent — ImagineMLS
- 2022-03-15 Relisted — ImagineMLS
- 2022-02-19 Contingent — ImagineMLS
- 2022-02-14 Relisted — ImagineMLS
- 2022-01-29 Pending — ImagineMLS
- 2022-01-27 Listed $99,900 ImagineMLS
- 2009-01-31 Listing Removed — ImagineMLS
- 2008-09-23 Listed $62,900 ImagineMLS
- 2008-08-31 Listing Removed — ImagineMLS
- 2008-02-21 Listed $69,500 ImagineMLS
- 2008-02-08 Listing Removed — ImagineMLS
- 2007-08-10 Listed $72,500 ImagineMLS
- 1979-08-01 Sold (Public Records) $18,500 Public Records
Property tax history
+10.0%/yrLatest (2025): $476 · +0.2% YoY. Source: county tax records.
Cash-flow waterfall
monthlySold comps — $/sqft
last 12 mo · ≤1 miLoading sold comps…