1550 Radical Ln · Racine, OH
Flood risk 1/10 · Minimal
- FEMA flood zone
- X (unshaded)
- Chance of flooding over 30 yrs
- 0.0%
- Est. flood insurance / yr
- $507 – $1,088
Fire risk 3/10 · Minor
- Est. fire insurance / yr
- $787 – $1,461
Heat risk 4/10 · Minor
- Hot days now (above 101°F)
- 7 days/yr
- Hot days in 30 yrs
- 18 days/yr
Wind risk 2/10 · Minimal
- Chance of severe wind over 30 yrs
- 1.0%
Air-quality risk 2/10 · Minimal
- Unhealthy air days now
- 0 days/yr
- Unhealthy air days in 30 yrs
- 1 days/yr
Risk factors via First Street. Map © Google.
Why this score? — see what drove the B- grade
The composite is a weighted blend of 9 inputs, each scored 0–100. Each bar is that input's sub-score; the figure is the points it added to the 100-point composite (weight × sub-score).
- Cash flow +26.9/30.0
- DSCR +9.3/10.0
- ARV discount +7.5/15.0
- 1% rule +6.5/10.0
- Appreciation +5.0/10.0
- Livability +3.2/5.0
- Rent growth +2.5/5.0
- Condition / age +2.5/5.0
- Schools +2.2/10.0
$75,000
🖨 Deal sheet (PDF) 📄 Offer letter ✓ Due diligence
Listing remarks
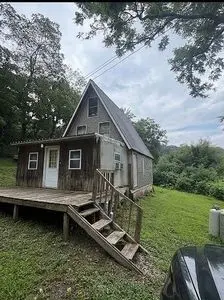
Property Highlights: 10.3 private acres A-frame cabin 2 bedrooms / 1 bathroom Quiet, secluded location Great hunting or recreational property Needs work & acirc; & euro; & ldquo; priced for potential Call or text if interested, 740-645-0802
Key facts
- Private acres
- Hunting property
- A-frame cabin
Tags
Neighborhood map
What this means for you Summary
Snapshot
- This is a 2-bed/1.0-bath single-family listed at $75k.
Deal economics
- At list price, monthly cash flow is $208 ($2k/yr) — positive.
- The deal already cash-flows at list — no discount required.
- Meets the 1% rule at list price ($861 rent vs $75k).
- Recommended offer: $73k (3.0% below list) — sets the bar for market timing.
Location & tenants
- Location reads 65/100 on livability (#718 in OH) — a middle-class / working-renter tenant base. Strengths: cost of living A+, housing A+; Watch: employment C-, health & safety C-, crime D+.
- Mason County Schools (town): math 20% / reading 33% proficiency, ranked #44 of 55 in WV (top 80%) — low school quality limits family demand, transient renter base, plan for 1-2y turnover.
- Zoned schools: Pt. Pleasant Primary (351 students, 0% FRL); Point Pleasant Junior/Senior High School (math 13% / reading 35%, grade F, #95 of 110 statewide, top 86%, 1,107 students, 0% FRL) — zoned schools average 0% FRL vs 47% district-wide (47 pts lower); this property's tenant base skews higher-income than the district average.
- Market conditions: 3 units permitted in Mason County in 2024 (0 in 5+ unit buildings).
- This rent is only 17% of the median local income ($61k/yr) — well below the 30% rent-burden line; pricing power to push rent on renewal without tenant pushback.
Forward outlook
- In year one you build about $3k of equity ($519 loan paydown + $2k appreciation (3.0% local appreciation)).
- Mason County population projected at -14% by 2050 — secular population decline; favor cash flow + early exit over multi-decade hold.
- At projected returns (3.0% appreciation + 3.0% rent growth), your $21k cash investment doubles in ~4 years — after that, you're playing with house money.
Negotiation context
- It's been on market 38 days — a 3% lower offer ($73k) is reasonable based on typical stale-listing flexibility.
Questions for the listing agent
- It's been on market 38 days. Have you received any prior offers? Is the seller open to a 3% concession, seller financing, or rate buy-down credit?
- Is there a deadline driving the sale (1031 exchange, divorce, estate, relocation)? That informs how much negotiation room exists.
- Schools are B-rated — typically a magnet for longer-tenancy family renters. What's the average tenant stay here, and is there a school-zone premium baked into asking?
- Crime grade is D in this area — have there been break-ins, vandalism, or insurance claims at this property in the last 3 years? What carrier currently insures it and at what premium?
- What's the average days-on-market for RENTAL listings here right now (not sales)? A rising rental-DOM trend means longer vacancies and softer asking-rent achievability than the comps imply.
- What's the recent tenant-quality profile in this submarket — average credit score on applications, eviction rate, late-payment / NSF rate, and stable-employment percentage? A property-management company in the area should have these aggregated.
- How much new for-sale + rental construction is in the pipeline within 1–3 miles? Heavy new supply typically softens prices + rents 12–24 months out; constrained supply supports both.
Investment metrics
- 1% rule
- 1.15% ✓
- Cap rate
- 9.62%
- Cash-on-cash
- 11.88%
- DSCR
- 1.53
- GRM
- 7.3
CMA / ARV
No comps found within radius.
Projected returns pro-forma
3.0% appreciation · 3.0% rent growth · sell at horizon
- IRR
- 18.6%
- Equity multiple
- 2.06×
- Total profit
- $22,260
- Equity at exit
- $33,723
- IRR
- 19.9%
- Equity multiple
- 3.89×
- Total profit
- $60,679
- Equity at exit
- $51,972
Cash invested: $21,000 (down + closing). Projections, not guarantees.
Monthly cashflow live
- Estimated rent
- $861 medium interval (Pro) →
- Mortgage (P&I)
- −$393
- Tax from tax record
- −$48 /mo · $572/yr
- Insurance
- −$31
- HOA
- −$0
- Vacancy / Maint / Mgmt
- −$181
- Net cashflow
- $208
Break-even live
Sensitivity live
| Price | -10% $250 | -5% $229 | +0% $208 | +5% $187 | +10% $165 |
|---|---|---|---|---|---|
| Rent | -10% $140 | -5% $174 | +0% $208 | +5% $242 | +10% $276 |
| Rate | -1.0pp $246 | -0.5pp $227 | base $208 | +0.5pp $188 | +1.0pp $169 |
UW: 25.0% down · 7.5% · 30yr · 1.5% tax · 5.0% vac · 8.0% maint · 8.0% mgmt
Financing live
Cash to close
- Down payment
- $18,750
- Closing costs
- $2,250
- Reserves months
- —
- Total cash needed
- —
Loan-product check · same deal, 3 products live
Conventional
25% down · 7.5% · 30yr
- Down + closing
- —
- Monthly P&I
- —
- Monthly cashflow
- —
- DSCR
- —
- Eligible?
- —
Personal DTI + credit; lowest rate.
DSCR
20% down · 8.5% · 30yr
- Down + closing
- —
- Monthly P&I
- —
- Monthly cashflow
- —
- DSCR
- —
- Eligible?
- —
No personal income docs; deal must DSCR.
Hard money
10% down · 12.0% · 12mo
- Down + closing
- —
- Monthly P&I
- —
- Monthly cashflow
- —
- DSCR
- —
- Eligible?
- —
Short-term bridge; refi at stabilization.
Listing history 19 events
-
2026-06-22days on market $75,000 Active 38 DOM
-
2026-06-21days on market $75,000 Active 37 DOM
-
2026-06-19days on market $75,000 Active 35 DOM
-
2026-06-18days on market $75,000 Active 34 DOM
-
2026-06-17days on market $75,000 Active 33 DOM
-
2026-06-16days on market $75,000 Active 32 DOM
-
2026-06-15days on market $75,000 Active 31 DOM
-
2026-06-14days on market $75,000 Active 29 DOM
-
2026-06-12days on market $75,000 Active 28 DOM
-
2026-06-09days on market $75,000 Active 25 DOM
-
2026-06-08days on market $75,000 Active 24 DOM
-
2026-06-07days on market $75,000 Active 23 DOM
-
2026-06-05days on market $75,000 Active 20 DOM
-
2026-06-03days on market $75,000 Active 19 DOM
-
2026-06-02days on market $75,000 Active 18 DOM
-
2026-06-01days on market $75,000 Active 17 DOM
-
2026-05-31days on market $75,000 Active 16 DOM
-
2026-05-30days on market $75,000 Active 15 DOM
-
2026-05-16$75,000 Active 236-char remark
ⓘ Source: listings_history table (triggers on properties + properties_extension) + one-shot
backfill from property_details.listing_events for pre-trigger history.
Tax reassessment forecast OH · Partial reset (capped growth)
- Current annual tax
- $572 · $48/mo
- Projected year-2 tax
- $871 · $73/mo
- Expected delta
- +$299/yr (+$25/mo · 52.3%)
ⓘ Screening estimate from a state-policy table — verify with the county assessor before closing.
Climate risk First Street
- Flood 1/10 Low FEMA zone X (unshaded) · 0% chance over 30 yrs
- Wildfire 3/10 Moderate
- Heat 4/10 Moderate 7 d/yr ≥101°F today · 18 d/yr by 30 yrs out
- Wind 2/10 Low 100% chance of damaging wind over 30 yrs
- Air quality 2/10 Low 0 unhealthy d/yr today · 1 by 30 yrs out
Nearby sold comps map
Loading sold comps map…
Walkable amenities ~0.75 mi
Loading nearby amenities…
Taxation est. · year 1
- Rental income
- $10,331
- − Mortgage interest
- −$4,201
- − Property taxes
- −$572
- − Insurance
- −$375
- − Repairs & maintenance
- −$826
- − Management
- −$826
- − Depreciation
- −$2,182
- Taxable income
- $1,348
- Est. tax owed @ 24.0%
- −$324
- After-tax cash flow
- $2,171/yr
For passive investors: Depreciation is non-cash, so a rental often shows a tax loss while cash-flowing — sheltering income. Rental losses are passive: they offset passive income freely, and up to $25,000/yr can offset ordinary (W-2) income if you actively participate and your MAGI is under $100k (phasing out to $0 by $150k); unused losses carry forward. On sale, claimed depreciation is recaptured at up to 25%, and gains may owe capital-gains tax (a 1031 exchange can defer both). Figures are a year-1 estimate at your 24.0% rate — not tax advice; consult a CPA.
Schools (NCES district)
- District
- Mason County Schools
- NCES district ID
- 5400780
- Math proficiency
- 20% ▼ -13.00%
- Reading proficiency
- 33% ▼ -10.00%
- Median HH income
- $37,623
- Composite
- 22.07/100
- National rank
- #8191
- State rank
- #44 of 55 in WV
Livability — Racine
- Score
- 65/100
- State rank
- #718
- US rank
- #12977
Category grades
Schools grade is shown separately in the Schools card above.
Census & demographics
- County
- Mason
- Population (ZIP)
- 2,246
- Household income
- $61,439
- Rent vs Own
Population outlook (Mason County) Hauer SSP2
- Today (2025)
- 26,174 people
- By 2030
- 25,482 · -2.6%
- By 2040
- 23,934 · -8.6%
- By 2050
- 22,432 · -14.3%
- By 2075
- 19,241 · -26.5%
- By 2100
- 15,427 · -41.1%
Race, ethnicity, and origin ACS 2023
- Neighborhood character
- Predominantly White (94%)
- Race & ethnicity
- White 94% Two or more races 5% Hispanic / Latino 1%
- Common ancestry
- Serbian 7% Lithuanian 1% Polish 1%
- Languages at home
- 99% English-only · German/W. Germanic 1%
Political lean MEDSL · Mason
- 2024 margin
- Solid R (+58.0) · D 20.0% · R 78.0% · Other 1.9%
- 2008→2024 swing
- -45.1pp toward R · 2008: -12.9pp · 2024: -58.0pp
- All cycles
- 2024: R+58.0 2020: R+53.2 2016: R+54.7 2012: R+20.3 2008: R+12.9
Not yet ingested
- Civics
- —
Market trends
- HPI YoY
- —
- Current HPI
- —
- Rent YoY
- —
- Metro
- —
- State GDP YoY
- ▲ 1.98%
- F500 in state
- 48
Industry mix (Fortune 500 HQ in OH)
| Industry | F500 HQs | Revenue |
|---|---|---|
| Insurance | 3 | $145B |
|
||
| Industrial Machinery | 3 | $49B |
|
||
| Financial Services | 3 | $24B |
|
||
| Consumer Goods | 2 | $93B |
|
||
| Aerospace / Defense | 2 | $47B |
|
||
| Utilities | 2 | $33B |
|
||
Price history
1 event — show timeline
- 2026-05-16 Listed $75,000 FSBO.com
Property tax history
+2.3%/yrLatest (2025): $572 · +12.5% YoY. Source: county tax records.
Cash-flow waterfall
monthlySold comps — $/sqft
last 12 mo · ≤1 miLoading sold comps…