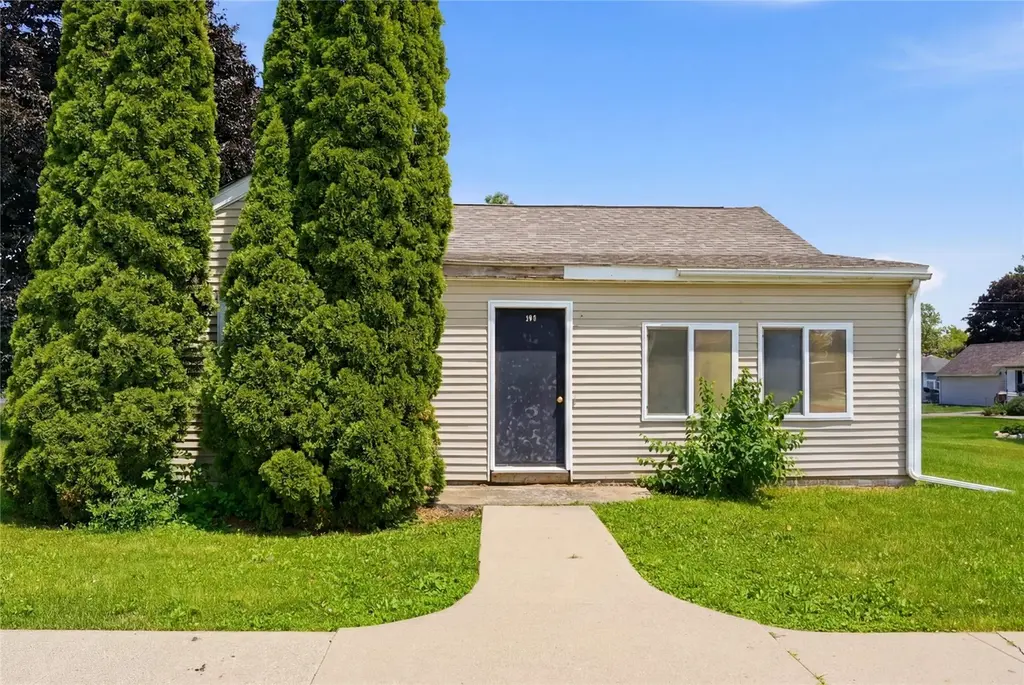
309 2nd Ave · Clarence, IA
Flood risk 1/10 · Minimal
- FEMA flood zone
- X (unshaded)
- Chance of flooding over 30 yrs
- 0.0%
- Est. flood insurance / yr
- $473 – $860
Fire risk 1/10 · Minimal
- Est. fire insurance / yr
- $902 – $1,676
Heat risk 3/10 · Minor
- Hot days now (above 102°F)
- 7 days/yr
- Hot days in 30 yrs
- 15 days/yr
Wind risk 2/10 · Minimal
- Chance of severe wind over 30 yrs
- —
Air-quality risk 2/10 · Minimal
- Unhealthy air days now
- 1 days/yr
- Unhealthy air days in 30 yrs
- 2 days/yr
Risk factors via First Street. Map © Google.
Why this score? — see what drove the D+ grade
The composite is a weighted blend of 9 inputs, each scored 0–100. Each bar is that input's sub-score; the figure is the points it added to the 100-point composite (weight × sub-score).
- Cash flow +16.6/30.0
- ARV discount +5.9/15.0
- Schools +5.3/10.0
- DSCR +5.1/10.0
- Livability +3.8/5.0
- 1% rule +3.7/10.0
- Rent growth +2.5/5.0
- Condition / age +2.5/5.0
- Appreciation +0.0/10.0
$100,000
🖨 Deal sheet (PDF) 📄 Offer letter ✓ Due diligence
Listing remarks
Why rent when you can own? This affordable 2 bedroom/1 bathroom home in Clarence has so much to offer for a great price! Open concept kitchen and living room with potential to convert the formal dining into a third bedroom or an office. One of the bedrooms is currently being used for main floor laundry room but there are laundry hook ups in the basement as well. The one stall detached garage with a carport attached to it with alley access. Take advantage of all of the perks of homeownership at a great price.
Key facts
- 7,841 sq ft lot
- Garage
- Built 1949
Property features AI
Exterior
- Parking: Detached garage; 1-car garage; Carport; Garage with automatic door opener
- Utilities: Public water service; Public sewer service
- Home design: Single-family residence; Frame construction with vinyl siding
- Construction: Frame construction; Vinyl siding
- Exterior features: Public water; Public sewer; Lot approximately 0.18 acres
Interior
- Kitchen: Range; Refrigerator; Gas water heater
- Bathrooms: 1 full bathroom
- Heating & cooling: Natural gas forced air heating; Window/wall air conditioning units
- Interior features: Eat-in kitchen; Full basement
- Laundry & utility: Washer; Dryer; Laundry on main level
Neighborhood map
What this means for you Summary
Snapshot
- This is a 2-bed/1.0-bath single-family listed at $100k.
Deal economics
- At list price, monthly cash flow is $60 ($717/yr) — positive.
- The deal already cash-flows at list — no discount required.
- To meet the 1% rule (rent ≥ 1% of price), the offer needs to be $87k (13.0% below list).
- Recommended offer: $87k (13.0% below list) — sets the bar for 1% rule.
Location & tenants
- Location reads 75/100 on livability (#212 in IA, #3,902 nationally) — a middle-class / working-renter tenant base. Strengths: crime A+, cost of living A+, housing A+; Watch: amenities F, commute F.
- North Cedar Community School District (rural): math 61% / reading 63% proficiency, ranked #219 of 289 in IA (top 76%) — acceptable for families but not a draw, mixed tenant base, ~2y average lease.
- Zoned schools: North Cedar Mechanicsville Elem Ctr (math 57% / reading 52%, grade C, #462 of 616 statewide, top 79%, 159 students, 51% FRL); North Cedar Jr/Sr High School (math 60% / reading 71%, grade B, #204 of 336 statewide, top 61%, 294 students, 41% FRL) — zoned schools average 46% FRL vs 28% district-wide (18 pts higher); higher-poverty schools than district average — tighter screening recommended.
- Market conditions: 9 active listings in the ZIP; 89 units permitted in Cedar County in 2024 (40 in 5+ unit buildings).
Forward outlook
- Local home prices are declining (-3.0%/yr); year-one equity from $691 of loan paydown is wiped out by about $3k of value loss. Plan a longer hold.
- Cedar County population projected to shrink 9% by 2050 — rents likely to lag national; underwrite the cash flow, not the appreciation.
Negotiation context
- Only 3 days on market — expect competitive offers; lowballing is unlikely to land.
- Current owner paid $30k; list at $100k implies a 235% gain — meaningful room to come down on a strong offer.
Risks & watch-outs
- Watch-outs: built in 1949 — expect roof / HVAC / electrical / plumbing capex.
Questions for the listing agent
- Built in 1949 — when were the roof, HVAC, electrical panel, plumbing, and water heater last replaced?
- Is there a deadline driving the sale (1031 exchange, divorce, estate, relocation)? That informs how much negotiation room exists.
- Schools are B-rated — typically a magnet for longer-tenancy family renters. What's the average tenant stay here, and is there a school-zone premium baked into asking?
- The area grade is low — what's the realistic commute time and amenity access for the typical tenant pool here? Any planned neighborhood developments (good or bad) we should know about?
- What's the average days-on-market for RENTAL listings here right now (not sales)? A rising rental-DOM trend means longer vacancies and softer asking-rent achievability than the comps imply.
- What's the recent tenant-quality profile in this submarket — average credit score on applications, eviction rate, late-payment / NSF rate, and stable-employment percentage? A property-management company in the area should have these aggregated.
- How much new for-sale + rental construction is in the pipeline within 1–3 miles? Heavy new supply typically softens prices + rents 12–24 months out; constrained supply supports both.
Investment metrics
- 1% rule
- 0.87% ✗
- Cap rate
- 7.01%
- Cash-on-cash
- 2.56%
- DSCR
- 1.11
- GRM
- 9.6
CMA / ARV
- ARV (on-the-fly)
- $96,525
- Comps found
- 2
Show comp detail 2 sales within ~0.75 mi
| Address | Dist | Beds/Ba | Sqft | Sold | Price | $/sf | Match |
|---|---|---|---|---|---|---|---|
| 307 2nd Ave Ave | 0.01mi | 2/1.5 | 944 (-3%) | 12mo | $93,000 | $99 | 82 |
| 312 3rd. Ave | 0.06mi | 2/1.0 | 1,044 (+7%) | 11mo | $62,000 | $59 | 76 |
Match score weights: distance 35% · size 25% · config 20% · recency 20%. Top-matched comps best support the ARV.
Projected returns pro-forma
-3.0% appreciation · 3.0% rent growth · sell at horizon
- IRR
- -12.3%
- Equity multiple
- 0.56×
- Total profit
- $-12,427
- Equity at exit
- $14,910
- IRR
- -3.2%
- Equity multiple
- 0.78×
- Total profit
- $-6,029
- Equity at exit
- $8,646
Cash invested: $28,000 (down + closing). Projections, not guarantees.
Landlord ↔ Tenant lean methodology
- Overall (STATE)
- 83 Strongly Landlord-Friendly
- State Iowa
- 83 Strongly Landlord-Friendly · R+6
- County
- — inherits STATE
- City
- — inherits STATE
ZIP-level market 52216
- Home prices YoY
- -21.9%
- Active inventory
- 9
- Price-to-rent
- 9.6×
Monthly cashflow live
- Estimated rent
- $870 medium interval (Pro) →
- Mortgage (P&I)
- −$524
- Tax from tax record
- −$62 /mo · $738/yr
- Insurance
- −$42
- HOA
- −$0
- Vacancy / Maint / Mgmt
- −$183
- Net cashflow
- $60
Break-even live
Sensitivity live
| Price | -10% $116 | -5% $88 | +0% $60 | +5% $31 | +10% $3 |
|---|---|---|---|---|---|
| Rent | -10% $-9 | -5% $25 | +0% $60 | +5% $94 | +10% $128 |
| Rate | -1.0pp $110 | -0.5pp $85 | base $60 | +0.5pp $34 | +1.0pp $7 |
UW: 25.0% down · 7.5% · 30yr · 1.5% tax · 5.0% vac · 8.0% maint · 8.0% mgmt
Financing live
Cash to close
- Down payment
- $25,000
- Closing costs
- $3,000
- Reserves months
- —
- Total cash needed
- —
Loan-product check · same deal, 3 products live
Conventional
25% down · 7.5% · 30yr
- Down + closing
- —
- Monthly P&I
- —
- Monthly cashflow
- —
- DSCR
- —
- Eligible?
- —
Personal DTI + credit; lowest rate.
DSCR
20% down · 8.5% · 30yr
- Down + closing
- —
- Monthly P&I
- —
- Monthly cashflow
- —
- DSCR
- —
- Eligible?
- —
No personal income docs; deal must DSCR.
Hard money
10% down · 12.0% · 12mo
- Down + closing
- —
- Monthly P&I
- —
- Monthly cashflow
- —
- DSCR
- —
- Eligible?
- —
Short-term bridge; refi at stabilization.
Listing history 4 events
-
2026-06-22days on market $100,000 Active 3 DOM
-
2026-06-21days on market $100,000 Active 2 DOM
-
2026-06-21remarks 513-char remark
-
2026-06-21$100,000 Active 1 DOM
ⓘ Source: listings_history table (triggers on properties + properties_extension) + one-shot
backfill from property_details.listing_events for pre-trigger history.
Tax reassessment forecast IA · Partial reset (capped growth)
- Current annual tax
- $738 · $62/mo
- Projected year-2 tax
- $1,154 · $96/mo
- Expected delta
- +$416/yr (+$35/mo · 56.4%)
ⓘ Screening estimate from a state-policy table — verify with the county assessor before closing.
Climate risk First Street
- Flood 1/10 Low FEMA zone X (unshaded) · 0% chance over 30 yrs
- Wildfire 1/10 Low
- Heat 3/10 Moderate 7 d/yr ≥102°F today · 15 d/yr by 30 yrs out
- Wind 2/10 Low
- Air quality 2/10 Low 1 unhealthy d/yr today · 2 by 30 yrs out
Nearby sold comps map
Loading sold comps map…
Walkable amenities ~0.75 mi
Loading nearby amenities…
Taxation est. · year 1
- Rental income
- $10,440
- − Mortgage interest
- −$5,602
- − Property taxes
- −$738
- − Insurance
- −$500
- − Repairs & maintenance
- −$835
- − Management
- −$835
- − Depreciation
- −$2,909
- Taxable loss
- −$979
- Est. tax savings @ 24.0%
- +$235
- After-tax cash flow
- $952/yr
For passive investors: Depreciation is non-cash, so a rental often shows a tax loss while cash-flowing — sheltering income. Rental losses are passive: they offset passive income freely, and up to $25,000/yr can offset ordinary (W-2) income if you actively participate and your MAGI is under $100k (phasing out to $0 by $150k); unused losses carry forward. On sale, claimed depreciation is recaptured at up to 25%, and gains may owe capital-gains tax (a 1031 exchange can defer both). Figures are a year-1 estimate at your 24.0% rate — not tax advice; consult a CPA.
Schools (NCES district)
- District
- North Cedar Community School District
- NCES district ID
- 1917100
- Math proficiency
- 61% ▼ -5.00%
- Reading proficiency
- 63% ▼ -7.00%
- Median HH income
- $54,549
- Composite
- 53.17/100
- National rank
- #1507
- State rank
- #219 of 289 in IA
Livability — Clarence
- Score
- 75/100
- State rank
- #212
- US rank
- #3902
Category grades
Schools grade is shown separately in the Schools card above.
Census & demographics
- Census place
- Clarence, IA
- Population (ZIP)
- 1,513
Population outlook (Cedar County) Hauer SSP2
- Today (2025)
- 18,416 people
- By 2030
- 18,294 · -0.7%
- By 2040
- 17,771 · -3.5%
- By 2050
- 16,841 · -8.6%
- By 2075
- 14,503 · -21.2%
- By 2100
- 11,301 · -38.6%
Race, ethnicity, and origin ACS 2023
- Neighborhood character
- Predominantly White (99%)
- Race & ethnicity
- White 99%
- Common ancestry
- Portuguese 2% Lithuanian 1% Italian 1%
Political lean MEDSL · Cedar
- 2024 margin
- Strong R (+21.8) · D 38.4% · R 60.1% · Other 1.5%
- 2008→2024 swing
- -31.4pp toward R · 2008: 9.6pp · 2024: -21.8pp
- All cycles
- 2024: R+21.8 2020: R+17.0 2016: R+18.1 2012: D+4.4 2008: D+9.6
Not yet ingested
- Civics
- —
Market trends
- HPI YoY
- ▼ -52.41%
- Current HPI
- 187.076
- Rent YoY
- —
- Metro
- —
- State GDP YoY
- ▲ 2.48%
- F500 in state
- 4
Industry mix (Fortune 500 HQ in IA)
| Industry | F500 HQs | Revenue |
|---|---|---|
| Financial Services | 1 | $16B |
|
||
| Retail / Convenience | 1 | $15B |
|
||
Price history
+334.8% since first listed3 events — show timeline
- 2026-06-19 Listed $100,000 CRAAR, CDRMLS
- 2017-03-01 Sold (Public Records) $29,875 Public Records
- 2012-06-22 Sold (Public Records) $23,000 Public Records
Property tax history
-1.0%/yrLatest (2025): $738 · -5.1% YoY. Source: county tax records.
Cash-flow waterfall
monthlySold comps — $/sqft
last 12 mo · ≤1 miLoading sold comps…