1 Lake Louise #42 · Sudden Valley, WA
Flood risk 1/10 · Minimal
- FEMA flood zone
- X (unshaded)
- Chance of flooding over 30 yrs
- 0.0%
- Est. flood insurance / yr
- $507 – $1,088
Fire risk 3/10 · Minor
- Est. fire insurance / yr
- $604 – $1,122
Heat risk 2/10 · Minimal
- Hot days now (above 84°F)
- 8 days/yr
- Hot days in 30 yrs
- 20 days/yr
Wind risk 1/10 · Minimal
- Chance of severe wind over 30 yrs
- —
Air-quality risk 7/10 · Major
- Unhealthy air days now
- 11 days/yr
- Unhealthy air days in 30 yrs
- 11 days/yr
Risk factors via First Street. Map © Google.
Why this score? — see what drove the C- grade
The composite is a weighted blend of 9 inputs, each scored 0–100. Each bar is that input's sub-score; the figure is the points it added to the 100-point composite (weight × sub-score).
- Cash flow +17.7/30.0
- ARV discount +7.5/15.0
- 1% rule +6.4/10.0
- DSCR +5.5/10.0
- Schools +4.8/10.0
- Livability +3.4/5.0
- Rent growth +3.3/5.0
- Condition / age +2.5/5.0
- Appreciation +0.0/10.0
$259,000
🖨 Deal sheet (PDF) 📄 Offer letter ✓ Due diligence
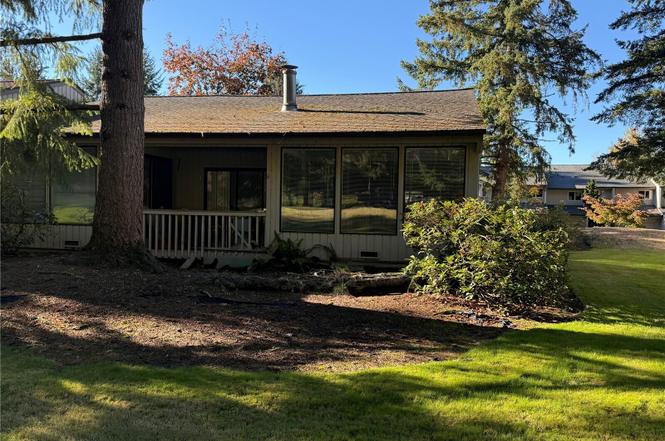
Listing remarks
Current best buy! Very large single level condominium with single car attached garage converted to an office. stainless steel appliances and new Gas Furnace, open floor plan vaulted ceilings with high windows. Large primary bedroom with bathroom. Washer & Dryer included. The Lakeridge complex has its own private swimming pool & tennis court - plus all of Sudden Valley's amenities. Located in the lakeside neighborhood of gate-2, close to Lake Whatcom, the golf course, Lake Louise Trail, and other recreational amenities. Sold as is.
Key facts
- Open floor plan
- Vaulted ceilings
- New gas furnace
Tags
Property features AI
Finance
- Other: Part of a 7-unit building within a 45-unit complex (Lakeridge Condominium); Outdoor pool and golf amenities within the community
- Financial info: Listing terms: Cash or Conventional
- HOA & community: Monthly HOA fee; Association contact: Windermere; HOA covers common area maintenance, lawn service, road maintenance, sewer, water, snow removal, security, and other items; Community amenities: gated entry, golf course access, outdoor pool, sauna, trails, RV parking; Pets allowed; Senior exemption in community
Exterior
- Parking: Off-street parking; RV parking available
- Security: Security gate; Security service
- Utilities: Water service: Water District #10; Sewer service: Water District #10; Power: Puget Sound Energy; Cable: Xfinity; Internet: Comcast / Xfinity; Gas water heater
- Home design: Attached condominium; One-level (single story) condo — end unit; Unit located on the first floor; Has view
- Construction: Wood construction; Composition roof; Built (effective) in 1974
- Exterior features: Wood exterior products; Corner lot; Paved access; Community waterfront / private beach access
Interior
- Kitchen: Dishwasher; Refrigerator; Stove/Range; Electric cooking
- Bedrooms: 3 bedrooms (all on the main level); Primary bedroom on the main level
- Flooring: Carpet
- Bathrooms: 2 full bathrooms (both on the main level); 2 bathtubs
- Heating & cooling: Forced air heating; Forced air cooling; Natural gas energy source
- Interior features: Vaulted ceilings; Electric cooking; Electric dryer; Washer provided; Water heater
- Laundry & utility: Washer hookup; Electric dryer hookup; Utility room on the main level; Garage-located water heater (gas)
Neighborhood map
What this means for you Summary
Snapshot
- This is a 3-bed/2.0-bath condo listed at $259k.
Deal economics
- At list price, monthly cash flow is $208 ($2k/yr) — positive.
- The deal already cash-flows at list — no discount required.
- Meets the 1% rule at list price ($3k rent vs $259k).
- Recommended offer: $236k (9.0% below list) — sets the bar for market timing.
- Cap rate 7.3% vs local median 2.8% in Sudden Valley — top-decile yield for the area; either an underpriced asset or a hidden risk that comps aren't pricing in. Stress-test before assuming the spread holds.
Location & tenants
- Location reads 68/100 on livability (#285 in WA) — a middle-class / working-renter tenant base. Strengths: employment A+, housing A+; Watch: health & safety D, amenities F, cost of living F.
- Bellingham School District (urban): math 47% / reading 63% proficiency, ranked #106 of 291 in WA (top 36%) — acceptable for families but not a draw, mixed tenant base, ~2y average lease.
- Zoned schools: Geneva Elementary School (432 students, 28% FRL); Kulshan Middle School (623 students, 30% FRL); Bellingham High School (1,218 students, 34% FRL) — zoned schools at 31% FRL track the district average.
- Market conditions: Rents rising (+3.4%/yr); 275 active listings in the ZIP; 2 comparable units currently listed for rent nearby; solid renter incomes; 1,190 units permitted in Whatcom County in 2024 (327 in 5+ unit buildings).
- This rent runs 39% of the median local income ($91k/yr) — at the standard rent-burdened threshold; future hikes will face affordability resistance.
Forward outlook
- Local home prices are declining (-3.0%/yr); year-one equity from $2k of loan paydown is wiped out by about $8k of value loss. Plan a longer hold.
- Whatcom County population projected at +28% by 2050 — long-run rental-demand tailwind backs the buy-and-hold thesis.
Negotiation context
- It's been on market 110 days — a 9% lower offer ($236k) is reasonable based on typical stale-listing flexibility.
- Current owner paid $90k; list at $259k implies a 188% gain — meaningful room to come down on a strong offer.
Risks & watch-outs
- Watch-outs: HOA is 20% of rent.
Questions for the listing agent
- It's been on market 110 days. Have you received any prior offers? Is the seller open to a 9% concession, seller financing, or rate buy-down credit?
- Built in 1974 — when were the roof, HVAC, electrical panel, plumbing, and water heater last replaced?
- What does the HOA fee cover, when was the last increase, and are there any pending special assessments or reserve-fund shortfalls?
- Any open or pending special assessments — roof, HVAC, plumbing, elevator, façade? What's the per-unit balance and payoff schedule, and is the seller paying it off at close or rolling it to the buyer?
- Why hasn't it sold? Are there any deal-killer items the seller is aware of (foundation, flood, title, zoning, code violations)?
- Is there a deadline driving the sale (1031 exchange, divorce, estate, relocation)? That informs how much negotiation room exists.
- What's the average days-on-market for RENTAL listings here right now (not sales)? A rising rental-DOM trend means longer vacancies and softer asking-rent achievability than the comps imply.
- What's the recent tenant-quality profile in this submarket — average credit score on applications, eviction rate, late-payment / NSF rate, and stable-employment percentage? A property-management company in the area should have these aggregated.
- How much new apartment / multifamily construction is in the pipeline within 1–3 miles? Heavy new supply (>2% of stock underway) typically softens rents 12–24 months out; light construction supports rent growth.
Investment metrics
- 1% rule
- 1.14% ✓
- Cap rate
- 7.26%
- Cash-on-cash
- 3.44%
- DSCR
- 1.15
- GRM
- 7.3
CMA / ARV
No comps found within radius.
Projected returns pro-forma
-3.0% appreciation · 3.38% rent growth · sell at horizon
- IRR
- -10.3%
- Equity multiple
- 0.62×
- Total profit
- $-27,362
- Equity at exit
- $38,618
- IRR
- -0.2%
- Equity multiple
- 0.98×
- Total profit
- $-1,116
- Equity at exit
- $22,394
Cash invested: $72,520 (down + closing). Projections, not guarantees.
Landlord ↔ Tenant lean methodology
- Overall (STATE)
- 28 Tenant-Leaning
- State Washington
- 28 Tenant-Leaning · D+8
- County
- — inherits STATE
- City
- — inherits STATE
ZIP-level market 98229
- Rents YoY
- 3.4%
- Active inventory
- 275
- Price-to-rent
- 7.3×
Monthly cashflow live
- Estimated rent
- $2,944 medium interval (Pro) →
- Mortgage (P&I)
- −$1,358
- Tax from tax record
- −$50 /mo · $603/yr
- Insurance
- −$108
- HOA
- −$602
- Vacancy / Maint / Mgmt
- −$618
- Net cashflow
- $208
Break-even live
Sensitivity live
| Price | -10% $354 | -5% $281 | +0% $208 | +5% $134 | +10% $61 |
|---|---|---|---|---|---|
| Rent | -10% $-25 | -5% $91 | +0% $208 | +5% $324 | +10% $440 |
| Rate | -1.0pp $338 | -0.5pp $274 | base $208 | +0.5pp $141 | +1.0pp $72 |
UW: 25.0% down · 7.5% · 30yr · 1.5% tax · 5.0% vac · 8.0% maint · 8.0% mgmt
Financing live
Cash to close
- Down payment
- $64,750
- Closing costs
- $7,770
- Reserves months
- —
- Total cash needed
- —
Loan-product check · same deal, 3 products live
Conventional
25% down · 7.5% · 30yr
- Down + closing
- —
- Monthly P&I
- —
- Monthly cashflow
- —
- DSCR
- —
- Eligible?
- —
Personal DTI + credit; lowest rate.
DSCR
20% down · 8.5% · 30yr
- Down + closing
- —
- Monthly P&I
- —
- Monthly cashflow
- —
- DSCR
- —
- Eligible?
- —
No personal income docs; deal must DSCR.
Hard money
10% down · 12.0% · 12mo
- Down + closing
- —
- Monthly P&I
- —
- Monthly cashflow
- —
- DSCR
- —
- Eligible?
- —
Short-term bridge; refi at stabilization.
Rent comps 2 comps
| Address | Beds | Baths | Sqft | Rent | $/sqft | DOM | Units | Dist |
|---|---|---|---|---|---|---|---|---|
| 45 Windward Dr Bellingham, WA | 4.0 | 3.0 | 1857 | $3,645 | $1.96 | 15d | 1 | 0.77mi |
| 136 Windward Dr Bellingham, WA | 3.0 | 1.0 | 1100 | $2,500 | $2.27 | 15d | 1 | 0.85mi |
HOA detail condo
- Monthly dues
- $602 · $7,224/yr
- Likely covers
- gaspool
- Assessments
- None detected in remarks — confirm with the listing agent.
Listing history 20 events
-
2026-06-21days on market $259,000 Active 110 DOM
-
2026-06-18days on market $259,000 Active 107 DOM
-
2026-06-17days on market $259,000 Active 106 DOM
-
2026-06-16days on market $259,000 Active 105 DOM
-
2026-06-15days on market $259,000 Active 104 DOM
-
2026-06-14days on market $259,000 Active 102 DOM
-
2026-06-13days on market $259,000 Active 101 DOM
-
2026-06-10days on market $259,000 Active 99 DOM
-
2026-06-09days on market $259,000 Active 98 DOM
-
2026-06-08days on market $259,000 Active 97 DOM
-
2026-06-07days on market $259,000 Active 96 DOM
-
2026-06-05days on market $259,000 Active 93 DOM
-
2026-06-03days on market $259,000 Active 92 DOM
-
2026-06-02days on market $259,000 Active 91 DOM
-
2026-06-01days on market $259,000 Active 90 DOM
-
2026-05-31days on market $259,000 Active 89 DOM
-
2026-05-30days on market $259,000 Active 88 DOM
-
2026-03-03$259,000 Active
-
1991-05-09soldstatus $89,900
-
1989-01-31soldstatus $62,000
ⓘ Source: listings_history table (triggers on properties + properties_extension) + one-shot
backfill from property_details.listing_events for pre-trigger history.
Tax reassessment forecast WA · Resets to sale price
- Current annual tax
- $603 · $50/mo
- Projected year-2 tax
- $2,538 · $212/mo
- Expected delta
- +$1,935/yr (+$161/mo · 321.0%)
ⓘ Screening estimate from a state-policy table — verify with the county assessor before closing.
Climate risk First Street
- Flood 1/10 Low FEMA zone X (unshaded) · 0% chance over 30 yrs
- Wildfire 3/10 Moderate
- Heat 2/10 Low 8 d/yr ≥84°F today · 20 d/yr by 30 yrs out
- Wind 1/10 Low
- Air quality 7/10 Severe 11 unhealthy d/yr today · 11 by 30 yrs out
Nearby sold comps map
Loading sold comps map…
Walkable amenities ~0.75 mi
Loading nearby amenities…
Taxation est. · year 1
- Rental income
- $35,334
- − Mortgage interest
- −$14,508
- − Property taxes
- −$603
- − Insurance
- −$1,295
- − Repairs & maintenance
- −$2,827
- − Management
- −$2,827
- − HOA
- −$7,224
- − Depreciation
- −$7,535
- Taxable loss
- −$1,484
- Est. tax savings @ 24.0%
- +$356
- After-tax cash flow
- $2,849/yr
For passive investors: Depreciation is non-cash, so a rental often shows a tax loss while cash-flowing — sheltering income. Rental losses are passive: they offset passive income freely, and up to $25,000/yr can offset ordinary (W-2) income if you actively participate and your MAGI is under $100k (phasing out to $0 by $150k); unused losses carry forward. On sale, claimed depreciation is recaptured at up to 25%, and gains may owe capital-gains tax (a 1031 exchange can defer both). Figures are a year-1 estimate at your 24.0% rate — not tax advice; consult a CPA.
Schools (NCES district)
- District
- Bellingham School District
- NCES district ID
- 5300420
- Math proficiency
- 47% ▼ -6.00%
- Reading proficiency
- 63% ▼ -1.00%
- Median HH income
- $47,678
- Composite
- 48.49/100
- National rank
- #4632
- State rank
- #106 of 291 in WA
Livability — Sudden Valley
- Score
- 68/100
- State rank
- #285
- US rank
- #9937
Category grades
Schools grade is shown separately in the Schools card above.
Census & demographics
- Census place
- Sudden Valley, WA
- County
- Whatcom County · 209,776 people
- Metro
- Bellingham, WA
- Population (ZIP)
- 33,298
- Household income
- $90,945
- Rent vs Own
- Severe rent burden
- 1040.0
Population outlook (Whatcom County) Hauer SSP2
- Today (2025)
- 240,408 people
- By 2030
- 254,667 · +5.9%
- By 2040
- 281,365 · +17.0%
- By 2050
- 307,592 · +27.9%
- By 2075
- 375,576 · +56.2%
- By 2100
- 421,637 · +75.4%
Race, ethnicity, and origin ACS 2023
- Neighborhood character
- Predominantly White (77%)
- Race & ethnicity
- White 77% Two or more races 13% Hispanic / Latino 10% Asian 3%
- Hispanic origin (detail)
- Mexican 8%
- Common ancestry
- Portuguese 6% Italian 4% Slovak 4%
- Foreign-born
- 8% · Canada, China, Vietnam
- Languages at home
- 88% English-only · Spanish 7% Chinese 1% German/W. Germanic 1%
Political lean MEDSL · Whatcom
- 2024 margin
- Strong D (+24.9) · D 60.8% · R 35.9% · Other 3.3%
- 2008→2024 swing
- +6.9pp toward D · 2008: 18.0pp · 2024: 24.9pp
- All cycles
- 2024: D+24.9 2020: D+23.9 2016: D+17.7 2012: D+12.1 2008: D+18.0
Not yet ingested
- Civics
- —
Market trends
- HPI YoY
- ▼ -652.00%
- Current HPI
- 413.1478
- Rent YoY
- ▲ 3.38%
- Metro
- Bellingham, WA
- State GDP YoY
- ▲ 4.65%
- F500 in state
- 22
Industry mix (Fortune 500 HQ in WA)
| Industry | F500 HQs | Revenue |
|---|---|---|
| Retail | 2 | $269B |
|
||
| Technology / Retail | 1 | $638B |
|
||
| Technology | 1 | $245B |
|
||
| Telecommunications | 1 | $38B |
|
||
| Food / Beverage | 1 | $36B |
|
||
| Automotive / Trucks | 1 | $34B |
|
||
Price history
+317.7% since first listed3 events — show timeline
- 2026-03-03 Listed $259,000 NWMLS as Distributed by MLS Grid
- 1991-05-09 Sold (Public Records) $89,900 Public Records
- 1989-01-31 Sold (Public Records) $62,000 Public Records
Property tax history
-6.8%/yrLatest (2026): $603 · +8.0% YoY. Source: county tax records.
Cash-flow waterfall
monthlySold comps — $/sqft
last 12 mo · ≤1 miLoading sold comps…